118 Flato · San Antonio, TX
Flood risk 1/10 · Minimal
- FEMA flood zone
- X (unshaded)
- Chance of flooding over 30 yrs
- 0.0%
- Est. flood insurance / yr
- $507 – $1,088
Fire risk 1/10 · Minimal
- Est. fire insurance / yr
- $1,222 – $2,270
Heat risk 8/10 · Major
- Hot days now (above 109°F)
- 7 days/yr
- Hot days in 30 yrs
- 22 days/yr
Wind risk 8/10 · Major
- Chance of severe wind over 30 yrs
- 80.0%
Air-quality risk 2/10 · Minimal
- Unhealthy air days now
- 1 days/yr
- Unhealthy air days in 30 yrs
- 2 days/yr
Risk factors via First Street. Map © Google.
Why this score? — see what drove the B+ grade
The composite is a weighted blend of 9 inputs, each scored 0–100. Each bar is that input's sub-score; the figure is the points it added to the 100-point composite (weight × sub-score).
- Cash flow +30.0/30.0
- 1% rule +10.0/10.0
- DSCR +10.0/10.0
- Appreciation +10.0/10.0
- ARV discount +7.5/15.0
- Livability +4.0/5.0
- Condition / age +2.5/5.0
- Rent growth +2.1/5.0
- Schools +1.4/10.0
$49,900
🖨 Deal sheet (PDF) 📄 Offer letter ✓ Due diligence
Listing remarks MLS
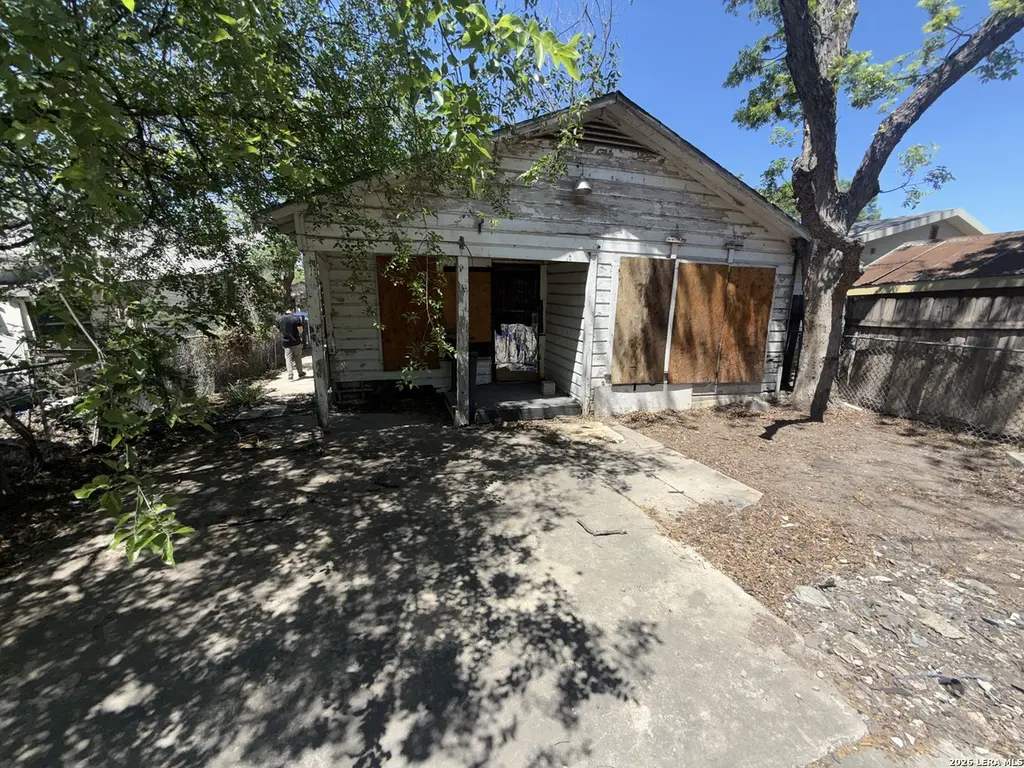
Investor special with endless potential! This property has been fully stripped down and is ready for a complete transformation, making it an ideal opportunity for investors, builders, or those looking to create something from the ground up. Situated on a lot with large, mature trees, the setting offers natural shade, character, and a great foundation for future improvements. With strong upside potential and priced to sell, this is your chance to bring your vision to life and maximize value. Conveniently located in San Antonio with easy access to major roads, shopping, and dining. Opportunities like this don't come around often-secure your next project today!
Key facts
- Easy access
- Large mature trees
- Great foundation
Tags
Neighborhood map
What this means for you Summary
Snapshot
- This is a 2-bed/1.0-bath single-family listed at $50k.
Deal economics
- At list price, monthly cash flow is $499 ($6k/yr) — positive.
- The deal already cash-flows at list — no discount required.
- Meets the 1% rule at list price ($1k rent vs $50k).
- Recommended offer: $47k (6.0% below list) — sets the bar for market timing.
- Cap rate 18.3% vs local median 3.8% in San Antonio — top-decile yield for the area; either an underpriced asset or a hidden risk that comps aren't pricing in. Stress-test before assuming the spread holds.
Location & tenants
- Location reads 80/100 on livability (#31 in TX, #1,616 nationally) — a professional / high-income tenant draw. Strengths: amenities A+, commute A+, cost of living A+; Watch: crime F.
- San Antonio ISD (urban): math 12% / reading 22% proficiency, ranked #805 of 826 in TX (top 98%) — low school quality limits family demand, transient renter base, plan for 1-2y turnover; 80% free/reduced lunch — lower-income household profile, screen leases tightly.
- Zoned schools: Hillcrest El (math 8% / reading 12%, grade F, #4,259 of 4,322 statewide, top 99%, 354 students, 93% FRL); Harris Middle (math 11% / reading 23%, grade F, #1,520 of 1,662 statewide, top 92%, 762 students, 94% FRL, charter); Burbank H S (math 9% / reading 20%, grade F, #1,522 of 1,632 statewide, top 94%, 1,319 students, 90% FRL, charter).
- Market conditions: Rents soft (-1.4%/yr); 95 active listings in the ZIP; 40 comparable units currently listed for rent nearby; rentals at typical pace (median 24d on market — plan ~3-4 weeks tenant-placement turnaround); 8,308 units permitted in Bexar County in 2024 (2,506 in 5+ unit buildings).
Forward outlook
- In year one you build about $5k of equity ($345 loan paydown + $5k appreciation (10.0% local appreciation)).
- Bexar County population projected at +50% by 2050 — long-run rental-demand tailwind backs the buy-and-hold thesis.
- At projected returns (10.0% appreciation + 0.0% rent growth), your $14k cash investment doubles in ~2 years — after that, you're playing with house money.
- By year 6, paydown + projected appreciation supports a ~$31k cash-out refi (75% LTV) — recoverable capital for the next deal without selling this one.
Negotiation context
- It's been on market 68 days — a 6% lower offer ($47k) is reasonable based on typical stale-listing flexibility.
Risks & watch-outs
- Watch-outs: property tax is 4.6% of price; built in 1959 — expect roof / HVAC / electrical / plumbing capex.
- Climate carrying-cost: severe wind risk, 80% chance of damaging wind over 30y; extreme-heat days projected 7→22/yr by 2055 (HVAC capex compounding) — expect insurance premiums to compound above CPI over the hold.
Questions for the listing agent
- It's been on market 68 days. Have you received any prior offers? Is the seller open to a 6% concession, seller financing, or rate buy-down credit?
- Built in 1959 — when were the roof, HVAC, electrical panel, plumbing, and water heater last replaced?
- Property tax is high relative to price — has the assessment been appealed recently, and will the sale trigger a re-assessment?
- Why hasn't it sold? Are there any deal-killer items the seller is aware of (foundation, flood, title, zoning, code violations)?
- Is there a deadline driving the sale (1031 exchange, divorce, estate, relocation)? That informs how much negotiation room exists.
- Crime grade is F in this area — have there been break-ins, vandalism, or insurance claims at this property in the last 3 years? What carrier currently insures it and at what premium?
- What's the average days-on-market for RENTAL listings here right now (not sales)? A rising rental-DOM trend means longer vacancies and softer asking-rent achievability than the comps imply.
- What's the recent tenant-quality profile in this submarket — average credit score on applications, eviction rate, late-payment / NSF rate, and stable-employment percentage? A property-management company in the area should have these aggregated.
- How much new for-sale + rental construction is in the pipeline within 1–3 miles? Heavy new supply typically softens prices + rents 12–24 months out; constrained supply supports both.
Investment metrics
- 1% rule
- 2.47% ✓
- Cap rate
- 18.30%
- Cash-on-cash
- 42.87%
- DSCR
- 2.91
- GRM
- 3.4
CMA / ARV
- ARV (median comp)
- $137,584
- List price
- $49,900
- Delta
- -63.73%
- Verdict
- UNDERPRICED
- Comps
- 20 within 1.0 mi
Show comp detail 12 sales within ~0.75 mi
| Address | Dist | Beds/Ba | Sqft | Sold | Price | $/sf | Match |
|---|---|---|---|---|---|---|---|
| 143 E Baylor | 0.27mi | 2/1.0 | 784 (-7%) | 10mo | $149,999 | $191 | 68 |
| 407 King Roger | 0.39mi | 2/1.0 | 864 (+3%) | 12mo | $217,900 | $252 | 67 |
| 617 Dewitt | 0.28mi | 2/1.0 | 748 (-11%) | 3mo | $160,000 | $214 | 66 |
| 439 W Lubbock St | 0.47mi | 3/1.0 (+1) | 838 (-0%) | 11mo | $125,000 | $149 | 63 |
| 334 Helena | 0.54mi | 2/1.0 | 848 (+1%) | 12mo | $159,900 | $189 | 63 |
| 342 Saint Francis | 0.62mi | 2/1.0 | 860 (+2%) | 9mo | $169,000 | $197 | 60 |
| 226 Carle | 0.25mi | 3/1.0 (+1) | 924 (+10%) | 10mo | $140,000 | $152 | 59 |
| 515 Pruitt Ave | 0.56mi | 3/1.0 (+1) | 840 (0%) | 13mo | $84,900 | $101 | 58 |
| 329 Saint Francis | 0.64mi | 2/2.0 | 800 (-5%) | 3mo | $244,999 | $306 | 55 |
| 203 Big Foot | 0.22mi | 2/2.0 | 714 (-15%) | 10mo | $139,900 | $196 | 53 |
| 724 Ripford | 0.70mi | 2/1.0 | 784 (-7%) | 14mo | $89,000 | $114 | 44 |
| 124 Parkview | 0.48mi | 3/2.0 (+1) | 960 (+14%) | 14mo | $99,000 | $103 | 33 |
Match score weights: distance 35% · size 25% · config 20% · recency 20%. Top-matched comps best support the ARV.
Projected returns pro-forma
10.0% appreciation · 0.0% rent growth · sell at horizon
- IRR
- 55.2%
- Equity multiple
- 4.97×
- Total profit
- $55,457
- Equity at exit
- $44,954
- IRR
- 47.4%
- Equity multiple
- 10.45×
- Total profit
- $132,034
- Equity at exit
- $96,945
Cash invested: $13,972 (down + closing). Projections, not guarantees.
Landlord ↔ Tenant lean methodology
- Overall (STATE)
- 87 Strongly Landlord-Friendly
- State Texas
- 87 Strongly Landlord-Friendly · R+5
- County
- — inherits STATE
- City
- — inherits STATE
ZIP-level market 78204
- Home prices YoY
- 6.4%
- Rents YoY
- -1.4%
- Active inventory
- 95
- Price-to-rent
- 3.4×
Monthly cashflow live
- Estimated rent
- $1,233 high interval (Pro) →
- Mortgage (P&I)
- −$262
- Tax from tax record
- −$192 /mo · $2,308/yr
- Insurance
- −$21
- HOA
- −$0
- Lot rent
- −$0
- Vacancy / Maint / Mgmt
- −$259
- Net cashflow
- $499
Break-even live
Sensitivity live
| Price | -10% $664 | -5% $513 | +0% $499 | +5% $485 | +10% $471 |
|---|---|---|---|---|---|
| Rent | -10% $402 | -5% $451 | +0% $499 | +5% $548 | +10% $597 |
| Rate | -1.0pp $524 | -0.5pp $512 | base $499 | +0.5pp $486 | +1.0pp $473 |
UW: 25.0% down · 7.5% · 30yr · 1.5% tax · 5.0% vac · 8.0% maint · 8.0% mgmt
Financing live
Cash to close
- Down payment
- $12,475
- Closing costs
- $1,497
- Reserves months
- —
- Total cash needed
- —
Loan-product check · same deal, 3 products live
Conventional
25% down · 7.5% · 30yr
- Down + closing
- —
- Monthly P&I
- —
- Monthly cashflow
- —
- DSCR
- —
- Eligible?
- —
Personal DTI + credit; lowest rate.
DSCR
20% down · 8.5% · 30yr
- Down + closing
- —
- Monthly P&I
- —
- Monthly cashflow
- —
- DSCR
- —
- Eligible?
- —
No personal income docs; deal must DSCR.
Hard money
10% down · 12.0% · 12mo
- Down + closing
- —
- Monthly P&I
- —
- Monthly cashflow
- —
- DSCR
- —
- Eligible?
- —
Short-term bridge; refi at stabilization.
Rent comps 40 comps
| Address | Beds | Baths | Sqft | Rent | $/sqft | DOM | Units | Dist |
|---|---|---|---|---|---|---|---|---|
| 323 W Mitchell St San Antonio, TX | 1.0–3.0 | 1.0–2.0 | 873 | $1,248 | $1.43 | 1d | 1 | 0.32mi |
| 2600 S Flores St San Antonio, TX | 2.0 | 1.0 | 705 | $900 | $1.28 | 26d | 3 | 0.32mi |
| 131 Elsie Unit 301 San Antonio, TX | 2.0 | 1.0 | 950 | $795 | $0.84 | 6d | 1 | 0.34mi |
| 150 Bank St San Antonio, TX | 1.0 | 1.0 | 700 | $795 | $1.14 | 46d | 1 | 0.43mi |
| 150 Bank St Unit C San Antonio, TX | 1.0 | 1.0 | 600 | $749 | $1.25 | 22d | 1 | 0.43mi |
| 120 Bank St San Antonio, TX | 3.0 | 2.0 | 1035 | $1,450 | $1.40 | 22d | 1 | 0.45mi |
| 120 Bank St San Antonio, TX | 3.0 | 2.0 | 1035 | $1,495 | $1.44 | 46d | 1 | 0.45mi |
| 271 E Lambert St San Antonio, TX | 3.0 | 1.0 | 950 | $1,250 | $1.32 | 22d | 1 | 0.49mi |
| 226 E Malone Ave San Antonio, TX | 2.0 | 1.0 | 693 | $1,100 | $1.59 | 24d | 1 | 0.50mi |
| 121 E Mitchell St San Antonio, TX | 2.0 | 1.0 | 528 | $850 | $1.61 | 46d | 1 | 0.51mi |
| 438 Pruitt Ave #1 San Antonio, TX | 2.0 | 1.0 | 980 | $1,245 | $1.27 | 46d | 1 | 0.53mi |
| 327 Gem Ln San Antonio, TX | 2.0 | 1.0 | 786 | $1,600 | $2.04 | 13d | 1 | 0.53mi |
| 131 Klein St #1 San Antonio, TX | 2.0 | 1.0 | 653 | $1,395 | $2.14 | 46d | 1 | 0.54mi |
| 142 Helena St San Antonio, TX | 2.0 | 1.0 | 840 | $1,350 | $1.61 | 6d | 1 | 0.55mi |
| 114 Teresa San Antonio, TX | 3.0 | 1.0 | 984 | $1,450 | $1.47 | 26d | 1 | 0.61mi |
| 125 Forrest Ave San Antonio, TX | 2.0 | 1.0 | 616 | $1,275 | $2.07 | 18d | 1 | 0.63mi |
| 205 W Lambert St San Antonio, TX | 2.0 | 1.0 | 550 | $995 | $1.81 | 20d | 1 | 0.63mi |
| 128 Saint Francis Ave Unit 3 San Antonio, TX | 1.0 | 1.0 | 528 | $775 | $1.47 | 26d | 1 | 0.64mi |
| 205 Mockert San Antonio, TX | 2.0 | 1.0 | 864 | $1,050 | $1.22 | 26d | 1 | 0.65mi |
| 110 Dowdy St San Antonio, TX | 3.0 | 1.0 | 1120 | $1,395 | $1.25 | 26d | 1 | 0.67mi |
| 520 Prado St Unit 1 San Antonio, TX | 2.0 | 1.0 | 620 | $799 | $1.29 | 46d | 1 | 0.68mi |
| 222 Glass Ave San Antonio, TX | 2.0 | 2.0 | 1007 | $2,400 | $2.38 | 46d | 1 | 0.68mi |
| 253 Felisa St San Antonio, TX | 1.0 | 1.0 | 799 | $1,213 | $1.52 | 46d | 1 | 0.71mi |
| 222 E Mitchell St San Antonio, TX | 1.0–2.0 | 1.0–2.0 | 954 | $1,825 | $1.91 | 1d | 17 | 0.75mi |
| 815 Ripford St San Antonio, TX | 2.0 | 1.0 | 728 | $1,300 | $1.79 | 6d | 1 | 0.76mi |
| 413 Probandt San Antonio, TX | 2.0 | 1.0 | 996 | $1,400 | $1.41 | 22d | 1 | 0.76mi |
| 411 E Lachapelle San Antonio, TX | 2.0 | 2.0 | 770 | $975 | $1.27 | 24d | 1 | 0.77mi |
| 310 Finton Unit A San Antonio, TX | 1.0 | 1.0 | 960 | $850 | $0.89 | 46d | 1 | 0.87mi |
| 331 Simon San Antonio, TX | 1.0 | 1.5 | 840 | $2,100 | $2.50 | 26d | 1 | 0.88mi |
| 161 Kaine St San Antonio, TX | 3.0 | 1.0 | 1000 | $1,450 | $1.45 | 20d | 1 | 0.89mi |
| 414 Clay St San Antonio, TX | 1.0 | 1.0 | 800 | $1,600 | $2.00 | 6d | 1 | 0.94mi |
| 165 Division Ave San Antonio, TX | 1.0 | 1.0 | 617 | $700 | $1.13 | 1d | 1 | 0.98mi |
| 165 Division Ave Unit 2 San Antonio, TX | 1.0 | 1.0 | 617 | $700 | $1.13 | 24d | 1 | 0.98mi |
| 165 Division Ave Unit 2 San Antonio, TX | 1.0 | 1.0 | 617 | $725 | $1.18 | 46d | 1 | 0.98mi |
| 127 Clay #2 San Antonio, TX | 1.0 | 1.0 | 936 | $1,250 | $1.34 | 46d | 1 | 0.98mi |
| 301 E Cevallos San Antonio, TX | 2.0 | 1.0–2.5 | 983 | $1,819 | $1.85 | 1d | 13 | 1.00mi |
| 1901 S San Marcos Unit 710 San Antonio, TX | 2.0 | 2.0 | 985 | $1,139 | $1.16 | 1d | 1 | 1.00mi |
| 1901 S San Marcos Unit 610 San Antonio, TX | 1.0 | 1.0 | 750 | $954 | $1.27 | 1d | 1 | 1.00mi |
| 107 Stanley Ct Apt 3 San Antonio, TX | 2.0 | 1.0 | 575 | $950 | $1.65 | 22d | 1 | 1.01mi |
| 827 Steves Ave #3 San Antonio, TX | 2.0 | 1.0 | 579 | $795 | $1.37 | 26d | 1 | 1.02mi |
Listing history 20 events
-
2026-06-22days on market $49,900 Active 68 DOM
-
2026-06-21days on market $49,900 Active 67 DOM
-
2026-06-18days on market $49,900 Active 64 DOM
-
2026-06-17days on market $49,900 Active 63 DOM
-
2026-06-16days on market $49,900 Active 62 DOM
-
2026-06-15days on market $49,900 Active 61 DOM
-
2026-06-13days on market $49,900 Active 59 DOM
-
2026-06-09days on market $49,900 Active 55 DOM
-
2026-06-08days on market $49,900 Active 54 DOM
-
2026-06-07days on market $49,900 Active 53 DOM
-
2026-06-04days on market $49,900 Active 50 DOM
-
2026-06-03days on market $49,900 Active 49 DOM
-
2026-06-02days on market $49,900 Active 48 DOM
-
2026-06-01days on market $49,900 Active 47 DOM
-
2026-05-31days on market $49,900 Active 46 DOM
-
2026-05-05price $49,900 669-char remark
Show marketing remark (669 chars)
Investor special with endless potential! This property has been fully stripped down and is ready for a complete transformation, making it an ideal opportunity for investors, builders, or those looking to create something from the ground up. Situated on a lot with large, mature trees, the setting offers natural shade, character, and a great foundation for future improvements. With strong upside potential and priced to sell, this is your chance to bring your vision to life and maximize value. Conveniently located in San Antonio with easy access to major roads, shopping, and dining. Opportunities like this don't come around often-secure your next project today!
-
2026-04-29price $55,000 669-char remark
Show marketing remark (669 chars)
Investor special with endless potential! This property has been fully stripped down and is ready for a complete transformation, making it an ideal opportunity for investors, builders, or those looking to create something from the ground up. Situated on a lot with large, mature trees, the setting offers natural shade, character, and a great foundation for future improvements. With strong upside potential and priced to sell, this is your chance to bring your vision to life and maximize value. Conveniently located in San Antonio with easy access to major roads, shopping, and dining. Opportunities like this don't come around often-secure your next project today!
-
2026-04-15$59,900 New 669-char remark
Show marketing remark (669 chars)
Investor special with endless potential! This property has been fully stripped down and is ready for a complete transformation, making it an ideal opportunity for investors, builders, or those looking to create something from the ground up. Situated on a lot with large, mature trees, the setting offers natural shade, character, and a great foundation for future improvements. With strong upside potential and priced to sell, this is your chance to bring your vision to life and maximize value. Conveniently located in San Antonio with easy access to major roads, shopping, and dining. Opportunities like this don't come around often-secure your next project today!
-
2024-01-29soldstatus
-
1984-12-01soldstatus
ⓘ Source: listings_history table (triggers on properties + properties_extension) + one-shot
backfill from property_details.listing_events for pre-trigger history.
Tax reassessment forecast TX · Resets to sale price
- Current annual tax
- $2,308 · $192/mo
- Projected year-2 tax
- $2,308 · $192/mo
- Expected delta
- $0/yr ($0/mo · 0.0%)
ⓘ Screening estimate from a state-policy table — verify with the county assessor before closing.
Climate risk First Street
- Flood 1/10 Low FEMA zone X (unshaded) · 0% chance over 30 yrs
- Wildfire 1/10 Low
- Heat 8/10 Severe 7 d/yr ≥109°F today · 22 d/yr by 30 yrs out
- Wind 8/10 Severe 80% chance of damaging wind over 30 yrs
- Air quality 2/10 Low 1 unhealthy d/yr today · 2 by 30 yrs out
Nearby sold comps map
Loading sold comps map…
Walkable amenities ~0.75 mi
Loading nearby amenities…
Taxation est. · year 1
- Rental income
- $14,795
- − Mortgage interest
- −$2,795
- − Property taxes
- −$2,308
- − Insurance
- −$250
- − Repairs & maintenance
- −$1,184
- − Management
- −$1,184
- − Depreciation
- −$1,452
- Taxable income
- $5,624
- Est. tax owed @ 24.0%
- −$1,350
- After-tax cash flow
- $4,641/yr
For passive investors: Depreciation is non-cash, so a rental often shows a tax loss while cash-flowing — sheltering income. Rental losses are passive: they offset passive income freely, and up to $25,000/yr can offset ordinary (W-2) income if you actively participate and your MAGI is under $100k (phasing out to $0 by $150k); unused losses carry forward. On sale, claimed depreciation is recaptured at up to 25%, and gains may owe capital-gains tax (a 1031 exchange can defer both). Figures are a year-1 estimate at your 24.0% rate — not tax advice; consult a CPA.
Schools (NCES district)
- District
- San Antonio ISD
- NCES district ID
- 4838730
- Math proficiency
- 12% ▼ -21.00%
- Reading proficiency
- 22% ▼ -7.00%
- Median HH income
- $30,952
- Composite
- 13.57/100
- National rank
- #9512
- State rank
- #805 of 826 in TX
Livability — San Antonio
- Score
- 80/100
- State rank
- #31
- US rank
- #1616
Category grades
Schools grade is shown separately in the Schools card above.
Census & demographics
- Census place
- San Antonio, TX
- County
- Bexar County · 1,990,555 people
- City population
- 1,806,925
- Metro
- San Antonio-New Braunfels, TX
- Population (ZIP)
- 11,983
- Household income
- $60,255
- Rent vs Own
- Severe rent burden
- 545.0
Population outlook (Bexar County) Hauer SSP2
- Today (2025)
- 2,336,851 people
- By 2030
- 2,560,728 · +9.6%
- By 2040
- 3,020,569 · +29.3%
- By 2050
- 3,493,522 · +49.5%
- By 2075
- 4,668,459 · +99.8%
- By 2100
- 5,533,242 · +136.8%
Race, ethnicity, and origin ACS 2023
- Neighborhood character
- Predominantly Hispanic (82%)
- Race & ethnicity
- Hispanic / Latino 82% Two or more races 37% White 15% Black 2% Native American 2%
- Hispanic origin (detail)
- Mexican 74%
- Common ancestry
- Romanian 3% Italian 2% Lithuanian 1%
- Foreign-born
- 15% · Canada
- Languages at home
- 50% English-only · Spanish 49%
Political lean MEDSL · Bexar
- 2024 margin
- Lean D (+9.8) · D 54.3% · R 44.6% · Other 1.1%
- 2008→2024 swing
- +4.2pp toward D · 2008: 5.6pp · 2024: 9.8pp
- All cycles
- 2024: D+9.8 2020: D+18.2 2016: D+13.5 2012: D+4.6 2008: D+5.6
Not yet ingested
- Civics
- —
Market trends
- HPI YoY
- ▲ 14.91%
- Current HPI
- 249.0597
- Rent YoY
- ▼ -1.44%
- Metro
- San Antonio-New Braunfels, TX
- State GDP YoY
- ▲ 3.95%
- F500 in state
- 110
Industry mix (Fortune 500 HQ in TX)
| Industry | F500 HQs | Revenue |
|---|---|---|
| Energy | 16 | $1,198B |
|
||
| Technology | 5 | $198B |
|
||
| Engineering / Construction | 4 | $72B |
|
||
| Energy Services | 3 | $60B |
|
||
| Utilities | 3 | $41B |
|
||
| Healthcare | 2 | $330B |
|
||
Price history
-16.7% since first listed5 events — show timeline
- 2026-05-05 Price Changed $49,900 LERA
- 2026-04-29 Price Changed $55,000 LERA
- 2026-04-15 Listed $59,900 LERA
- 2024-01-29 Sold (Public Records) — Public Records
- 1984-12-01 Sold (Public Records) — Public Records
Property tax history
+8.0%/yrLatest (2025): $2,308 · -21.5% YoY. Source: county tax records.
Cash-flow waterfall
monthlySold comps — $/sqft
last 12 mo · ≤1 miLoading sold comps…