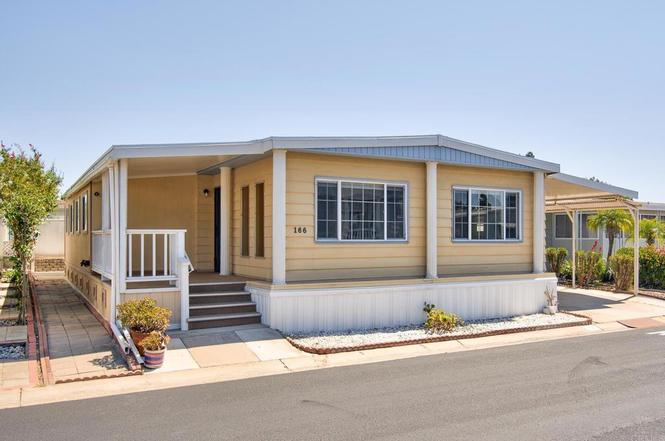
10770 Black Mountain Rd Unit 166 · San Diego, CA
Flood risk 1/10 · Minimal
- FEMA flood zone
- X (unshaded)
- Chance of flooding over 30 yrs
- 0.0%
- Est. flood insurance / yr
- $507 – $1,088
Fire risk 1/10 · Minimal
- Est. fire insurance / yr
- $659 – $1,223
Heat risk 4/10 · Minor
- Hot days now (above 93°F)
- 7 days/yr
- Hot days in 30 yrs
- 20 days/yr
Wind risk 1/10 · Minimal
- Chance of severe wind over 30 yrs
- —
Air-quality risk 3/10 · Minor
- Unhealthy air days now
- 3 days/yr
- Unhealthy air days in 30 yrs
- 4 days/yr
Risk factors via First Street. Map © Google.
Why this score? — see what drove the B grade
The composite is a weighted blend of 9 inputs, each scored 0–100. Each bar is that input's sub-score; the figure is the points it added to the 100-point composite (weight × sub-score).
- Cash flow +29.2/30.0
- ARV discount +15.0/15.0
- DSCR +10.0/10.0
- 1% rule +8.2/10.0
- Livability +3.8/5.0
- Rent growth +2.8/5.0
- Condition / age +2.5/5.0
- Schools +2.2/10.0
- Appreciation +0.0/10.0
$249,900
🖨 Deal sheet (PDF) 📄 Offer letter ✓ Due diligence
Listing remarks
Location matters, and this home has it. Situated in The Woods, one of the area's most desirable manufactured home communities, you'll be just minutes from Home Depot, Edwards Mira Mesa Cinemas, H Mart, restaurants, shopping, and everyday conveniences. This 2-bedroom, 2-bath home has been well cared for over the years and features an expanded side room of approximately 230 square feet, a separate laundry room, widened covered carport, and a large storage shed/workshop. The big-ticket items have already been addressed with a newer three-layer torch-down roof, upgraded and leveled foundation system, and updates to the plumbing and electrical systems. The Woods offers residents an exceptional a
Key facts
- Expanded side room
- Large storage shed
- 2 parking spots
Tags
Property features AI
Finance
- Other: Lot size source and living area source listed as public records; Parcel number on record
- Financial info: Land lease of $1,234 per month
- HOA & community: Senior community; Suburban neighborhood
Exterior
- Parking: Two parking spaces; Two carport spaces
- Utilities: Water source: see remarks
- Home design: Mobile home (24' x 60') remains on site; Single-story; Located in The Woods park
- Construction: Mobile home construction
- Exterior features: Front porch, enclosed; Patio present; Community pool; Rectangular, level/flat lot; One shed on the property; Has a view
Interior
- Bathrooms: One full bathroom; One 3/4 bathroom
- Heating & cooling: Central cooling
- Interior features: One-level home; Entry at ground level; Some room details available in remarks
- Laundry & utility: Laundry inside the home
Neighborhood map
What this means for you Summary
Snapshot
- This is a 2-bed/2.0-bath manufactured listed at $250k.
Deal economics
- At list price, monthly cash flow is $873 ($10k/yr) — positive.
- The deal already cash-flows at list — no discount required.
- Meets the 1% rule at list price ($3k rent vs $250k).
- Cap rate 10.5% vs local median 2.0% in San Diego — top-decile yield for the area; either an underpriced asset or a hidden risk that comps aren't pricing in. Stress-test before assuming the spread holds.
Location & tenants
- Location reads 75/100 on livability (#123 in CA, #4,206 nationally) — a middle-class / working-renter tenant base. Strengths: amenities A+, commute A+, employment A+; Watch: health & safety C-, crime D+, cost of living F.
- San Diego Unified (urban): math 19% / reading 29% proficiency, ranked #393 of 517 in CA (top 76%) — low school quality limits family demand, transient renter base, plan for 1-2y turnover.
- Market conditions: Rents rising (+1.0%/yr); 158 active listings in the ZIP; 40 comparable units currently listed for rent nearby; rentals at typical pace (median 15d on market — plan ~3-4 weeks tenant-placement turnaround); high-income renter base; 11,759 units permitted in San Diego County in 2024 (7,244 in 5+ unit buildings).
- This rent runs 31% of the median local income ($127k/yr) — at the standard rent-burdened threshold; future hikes will face affordability resistance.
Forward outlook
- Local home prices are declining (-3.0%/yr); year-one equity from $2k of loan paydown is wiped out by about $7k of value loss. Plan a longer hold.
- San Diego County population projected at +20% by 2050 — long-run rental-demand tailwind backs the buy-and-hold thesis.
- At projected returns (-3.0% appreciation + 1.0% rent growth), your $70k cash investment doubles in ~10 years — after that, you're playing with house money.
Negotiation context
- Only 4 days on market — expect competitive offers; lowballing is unlikely to land.
- 8 sale attempts since 10y ago; this cycle's ask has dropped $25k (9%) from the opening price — seller is motivated, your offer sets the floor, not the list.
- Current owner paid $150k; list at $250k implies a 67% gain — meaningful room to come down on a strong offer.
Questions for the listing agent
- Built in 1971 — when were the roof, HVAC, electrical panel, plumbing, and water heater last replaced?
- Is there a deadline driving the sale (1031 exchange, divorce, estate, relocation)? That informs how much negotiation room exists.
- Schools are B-rated — typically a magnet for longer-tenancy family renters. What's the average tenant stay here, and is there a school-zone premium baked into asking?
- Crime grade is D in this area — have there been break-ins, vandalism, or insurance claims at this property in the last 3 years? What carrier currently insures it and at what premium?
- What's the average days-on-market for RENTAL listings here right now (not sales)? A rising rental-DOM trend means longer vacancies and softer asking-rent achievability than the comps imply.
- What's the recent tenant-quality profile in this submarket — average credit score on applications, eviction rate, late-payment / NSF rate, and stable-employment percentage? A property-management company in the area should have these aggregated.
- How much new for-sale + rental construction is in the pipeline within 1–3 miles? Heavy new supply typically softens prices + rents 12–24 months out; constrained supply supports both.
Investment metrics
- 1% rule
- 1.32% ✓
- Cap rate
- 10.48%
- Cash-on-cash
- 14.97%
- DSCR
- 1.67
- GRM
- 6.3
CMA / ARV
- ARV (on-the-fly)
- $336,960
- Comps found
- 7
Show comp detail 7 sales within ~0.75 mi
| Address | Dist | Beds/Ba | Sqft | Sold | Price | $/sf | Match |
|---|---|---|---|---|---|---|---|
| 10771 Black Mountain Dr #58 | 0.11mi | 2/2.0 | 1,440 (0%) | 6mo | $390,000 | $271 | 90 |
| 10770 Black Mountain Rd #141 | 0.00mi | 2/2.0 | 1,368 (-5%) | 15mo | $165,000 | $121 | 79 |
| 10771 Black Mountain Rd #122 | 0.11mi | 2/2.0 | 1,392 (-3%) | 17mo | $256,000 | $184 | 75 |
| 10771 Black Mountain Rd #43 | 0.11mi | 2/2.0 | 1,368 (-5%) | 13mo | $320,000 | $234 | 75 |
| 10770 Black Mountain Rd Spc 179 | 0.00mi | 3/2.0 (+1) | 1,535 (+7%) | 14mo | $408,000 | $266 | 73 |
| 10771 Black Mountain Rd #15 | 0.11mi | 2/1.5 | 1,392 (-3%) | 19mo | $150,000 | $108 | 71 |
| 10770 Black Mountain Rd #200 | 0.02mi | 3/2.0 (+1) | 1,344 (-7%) | 23mo | $365,000 | $272 | 63 |
Match score weights: distance 35% · size 25% · config 20% · recency 20%. Top-matched comps best support the ARV.
Projected returns pro-forma
-3.0% appreciation · 1.03% rent growth · sell at horizon
- IRR
- 3.3%
- Equity multiple
- 1.12×
- Total profit
- $8,742
- Equity at exit
- $37,261
- IRR
- 10.9%
- Equity multiple
- 1.77×
- Total profit
- $54,155
- Equity at exit
- $21,607
Cash invested: $69,972 (down + closing). Projections, not guarantees.
Landlord ↔ Tenant lean methodology
- Overall (STATE)
- 18 Strongly Tenant-Friendly
- State California
- 18 Strongly Tenant-Friendly · D+13
- County
- — inherits STATE
- City
- — inherits STATE
ZIP-level market 92126
- Rents YoY
- 1.0%
- Active inventory
- 158
- Price-to-rent
- 6.3×
Monthly cashflow live
- Estimated rent
- $3,291 high interval (Pro) →
- Mortgage (P&I)
- −$1,311
- Tax est. 1.5%
- −$312 /mo · $3,748/yr
- Insurance
- −$104
- HOA
- −$0
- Vacancy / Maint / Mgmt
- −$691
- Net cashflow
- $873
Break-even live
Sensitivity live
| Price | -10% $1,045 | -5% $959 | +0% $873 | +5% $786 | +10% $700 |
|---|---|---|---|---|---|
| Rent | -10% $613 | -5% $743 | +0% $873 | +5% $1,003 | +10% $1,133 |
| Rate | -1.0pp $999 | -0.5pp $936 | base $873 | +0.5pp $808 | +1.0pp $742 |
UW: 25.0% down · 7.5% · 30yr · 1.5% tax · 5.0% vac · 8.0% maint · 8.0% mgmt
Financing live
Cash to close
- Down payment
- $62,475
- Closing costs
- $7,497
- Reserves months
- —
- Total cash needed
- —
Loan-product check · same deal, 3 products live
Conventional
25% down · 7.5% · 30yr
- Down + closing
- —
- Monthly P&I
- —
- Monthly cashflow
- —
- DSCR
- —
- Eligible?
- —
Personal DTI + credit; lowest rate.
DSCR
20% down · 8.5% · 30yr
- Down + closing
- —
- Monthly P&I
- —
- Monthly cashflow
- —
- DSCR
- —
- Eligible?
- —
No personal income docs; deal must DSCR.
Hard money
10% down · 12.0% · 12mo
- Down + closing
- —
- Monthly P&I
- —
- Monthly cashflow
- —
- DSCR
- —
- Eligible?
- —
Short-term bridge; refi at stabilization.
Rent comps 40 comps
| Address | Beds | Baths | Sqft | Rent | $/sqft | DOM | Units | Dist |
|---|---|---|---|---|---|---|---|---|
| 8957 Bogata Cir San Diego, CA | 2.0 | 2.0 | 1008 | $3,295 | $3.27 | 19d | 1 | 0.35mi |
| 10921 Polaris Dr Unit 1292587P San Diego, CA | 2.0 | 1.0 | 914 | $5,701 | $6.24 | 0d | 1 | 0.38mi |
| 9469 Karma Dr San Diego, CA | 2.0–3.0 | 1.0–2.0 | 1164 | $3,579 | $3.07 | 25d | 1 | 0.40mi |
| 9320 Hillery Dr San Diego, CA | 1.0–3.0 | 1.0–2.0 | 1009 | $3,332 | $3.30 | 0d | 20 | 0.41mi |
| 10443 Westchester Ave San Diego, CA | 3.0 | 2.0 | 1000 | $3,350 | $3.35 | 4d | 1 | 0.50mi |
| 9020 Penticton Way San Diego, CA | 3.0 | 2.0 | 1179 | $3,900 | $3.31 | 25d | 1 | 0.58mi |
| 9800 Mira Lee Way San Diego, CA | 1.0–3.0 | 1.0–2.0 | 1223 | $3,662 | $2.99 | 0d | 53 | 0.68mi |
| 8644 New Salem St #2 San Diego, CA | 2.0 | 2.0 | 924 | $3,100 | $3.35 | 25d | 1 | 0.69mi |
| 9405 Gold Coast Dr Unit A8 San Diego, CA | 2.0 | 1.5 | 1104 | $3,000 | $2.72 | 25d | 1 | 0.70mi |
| 9447 Gold Coast Dr Unit G5 San Diego, CA | 2.0 | 1.5 | 1104 | $2,695 | $2.44 | 15d | 1 | 0.71mi |
| 10258 Black Mountain Rd #146 San Diego, CA | 2.0 | 2.0 | 913 | $2,595 | $2.84 | 21d | 1 | 0.75mi |
| 10258 Black Mountain Rd #146 San Diego, CA | 2.0 | 2.0 | 913 | $2,795 | $3.06 | 25d | 1 | 0.75mi |
| 9865 Erma Rd San Diego, CA | 1.0–2.0 | 1.0–2.0 | 896 | $3,795 | $4.24 | 3d | 7 | 0.77mi |
| 10360 Maya Linda Rd San Diego, CA | 2.0 | 1.0–2.0 | 652 | $2,887 | $4.42 | 0d | 15 | 0.77mi |
| 8690 Friant St San Diego, CA | 2.0 | 2.0 | 1008 | $3,700 | $3.67 | 25d | 1 | 0.80mi |
| 10952 Scripps Ranch Blvd San Diego, CA | 2.0 | 2.0 | 980 | $2,595 | $2.65 | 5d | 1 | 0.80mi |
| 10952 Scripps Ranch Blvd San Diego, CA | 2.0 | 2.0 | 980 | $2,595 | $2.65 | 0d | 1 | 0.80mi |
| 9585 Gold Coast Dr San Diego, CA | 1.0–2.0 | 1.0–2.0 | 842 | $2,900 | $3.44 | 6d | 6 | 0.80mi |
| 8550 Summerdale Rd #123 San Diego, CA | 2.0 | 2.0 | 920 | $2,900 | $3.15 | 14d | 1 | 0.80mi |
| 9459 Compass Point Dr S San Diego, CA | 3.0 | 2.5 | 1594 | $4,150 | $2.60 | 15d | 1 | 0.81mi |
| 8545 Summerdale Rd San Diego, CA | 2.0 | 2.0 | 920 | $2,850 | $3.10 | 6d | 1 | 0.81mi |
| 10776 Scripps Ranch Blvd San Diego, CA | 1.0–2.0 | 1.0–2.0 | 1002 | $3,787 | $3.78 | 0d | 6 | 0.83mi |
| 9970 Erma Rd San Diego, CA | 1.0–2.0 | 1.0–2.0 | 775 | $3,295 | $4.25 | 0d | 8 | 0.86mi |
| 10945 Summerdale Way #271 San Diego, CA | 2.0 | 2.0 | 1000 | $3,268 | $3.27 | 25d | 1 | 0.87mi |
| 9955 Scripps Westview Way #11 San Diego, CA | 2.0 | 2.0 | 1086 | $3,600 | $3.31 | 25d | 1 | 0.87mi |
| 9975 Scripps Westview Way #27 San Diego, CA | 2.0 | 2.0 | 1195 | $3,395 | $2.84 | 6d | 1 | 0.88mi |
| 10264 Maya Linda Rd #44 San Diego, CA | 2.0 | 1.5 | 884 | $3,000 | $3.39 | 25d | 1 | 0.89mi |
| 10224 Maya Linda Rd San Diego, CA | 2.0 | 1.5 | 884 | $2,600 | $2.94 | 25d | 1 | 0.89mi |
| 8502 Summerdale Rd #3 San Diego, CA | 2.0 | 2.0 | 907 | $2,695 | $2.97 | 5d | 1 | 0.96mi |
| 8369 Summerdale Rd Unit A San Diego, CA | 2.0 | 2.5 | 1146 | $3,245 | $2.83 | 11d | 1 | 0.97mi |
| 8458 Summerdale Rd Unit C San Diego, CA | 2.0 | 2.0 | 981 | $2,645 | $2.70 | 25d | 1 | 0.98mi |
| 11135 Affinity Ct #12 San Diego, CA | 2.0 | 2.0 | 1032 | $3,100 | $3.00 | 25d | 1 | 0.99mi |
| 9929 Maya Linda Rd #7 San Diego, CA | 2.0 | 3.0 | 1335 | $4,200 | $3.15 | 25d | 1 | 1.00mi |
| 10885 Scripps Ranch Blvd San Diego, CA | 2.0 | 2.0 | 1093 | $3,350 | $3.06 | 21d | 1 | 1.01mi |
| 14158 Angelite Way San Diego, CA | 2.0 | 2.0 | 1600 | $4,500 | $2.81 | 25d | 1 | 1.02mi |
| 10805 Camino Ruiz #47 San Diego, CA | 2.0 | 2.0 | 912 | $2,699 | $2.96 | 25d | 1 | 1.02mi |
| 10802 Camino Ruiz San Diego, CA | 1.0–2.0 | 1.0–2.0 | 807 | $3,112 | $3.85 | 0d | 26 | 1.08mi |
| 10895 Scripps Ranch Blvd #6 San Diego, CA | 2.0 | 2.0 | 985 | $3,300 | $3.35 | 15d | 1 | 1.09mi |
| 11459 Elbert Way San Diego, CA | 2.0 | 2.0 | 1008 | $3,400 | $3.37 | 25d | 1 | 1.16mi |
| 11760 Westview Pkwy San Diego, CA | 2.0–3.0 | 2.0 | 1202 | $3,385 | $2.82 | 0d | 5 | 1.17mi |
Listing history 5 events
-
2026-06-21days on market $249,900 Active 4 DOM
-
2026-06-17statusdays on market $249,900 Active 1 DOM
-
2026-06-17days on market $249,900 Coming Soon 2 DOM
-
2026-06-16remarks 699-char remark
-
2026-06-16$249,900 Coming Soon 1 DOM
ⓘ Source: listings_history table (triggers on properties + properties_extension) + one-shot
backfill from property_details.listing_events for pre-trigger history.
Climate risk First Street
- Flood 1/10 Low FEMA zone X (unshaded) · 0% chance over 30 yrs
- Wildfire 1/10 Low
- Heat 4/10 Moderate 7 d/yr ≥93°F today · 20 d/yr by 30 yrs out
- Wind 1/10 Low
- Air quality 3/10 Moderate 3 unhealthy d/yr today · 4 by 30 yrs out
Nearby sold comps map
Loading sold comps map…
Walkable amenities ~0.75 mi
Loading nearby amenities…
Taxation est. · year 1
- Rental income
- $39,490
- − Mortgage interest
- −$13,998
- − Property taxes
- −$3,748
- − Insurance
- −$1,250
- − Repairs & maintenance
- −$3,159
- − Management
- −$3,159
- − Depreciation
- −$7,270
- Taxable income
- $6,905
- Est. tax owed @ 24.0%
- −$1,657
- After-tax cash flow
- $8,816/yr
For passive investors: Depreciation is non-cash, so a rental often shows a tax loss while cash-flowing — sheltering income. Rental losses are passive: they offset passive income freely, and up to $25,000/yr can offset ordinary (W-2) income if you actively participate and your MAGI is under $100k (phasing out to $0 by $150k); unused losses carry forward. On sale, claimed depreciation is recaptured at up to 25%, and gains may owe capital-gains tax (a 1031 exchange can defer both). Figures are a year-1 estimate at your 24.0% rate — not tax advice; consult a CPA.
Schools (NCES district)
- District
- San Diego Unified
- NCES district ID
- 0634320
- Math proficiency
- 19% ▼ -29.00%
- Reading proficiency
- 29% ▼ -28.00%
- Median HH income
- $61,673
- Composite
- 22.31/100
- National rank
- #8135
- State rank
- #393 of 517 in CA
Livability — San Diego
- Score
- 75/100
- State rank
- #123
- US rank
- #4206
Category grades
Schools grade is shown separately in the Schools card above.
Census & demographics
- Census place
- San Diego, CA
- County
- San Diego County · 3,178,799 people
- City population
- 1,397,612
- Metro
- San Diego-Chula Vista-Carlsbad, CA
- Population (ZIP)
- 76,059
- Household income
- $126,913
- Rent vs Own
- Severe rent burden
- 2688.0
Population outlook (San Diego County) Hauer SSP2
- Today (2025)
- 3,678,185 people
- By 2030
- 3,856,546 · +4.8%
- By 2040
- 4,171,407 · +13.4%
- By 2050
- 4,421,607 · +20.2%
- By 2075
- 4,831,599 · +31.4%
- By 2100
- 4,832,502 · +31.4%
Race, ethnicity, and origin ACS 2023
- Neighborhood character
- Diverse neighborhood (Simpson 0.67)
- Race & ethnicity
- Asian 49% White 24% Hispanic / Latino 16% Two or more races 11% Black 3%
- Hispanic origin (detail)
- Mexican 12%
- Common ancestry
- Italian 2% Lithuanian 1% Romanian 1%
- Foreign-born
- 41% · Vietnam, Canada, China
- Languages at home
- 49% English-only · Tagalog/Filipino 14% Spanish 9% Vietnamese 8%
Political lean MEDSL · San Diego
- 2024 margin
- D (+16.8) · D 56.9% · R 40.1% · Other 2.9%
- 2008→2024 swing
- +6.6pp toward D · 2008: 10.2pp · 2024: 16.8pp
- All cycles
- 2024: D+16.8 2020: D+22.8 2016: D+17.8 2012: D+5.1 2008: D+10.2
Not yet ingested
- Civics
- —
Market trends
- HPI YoY
- ▼ -790.06%
- Current HPI
- 452.3165
- Rent YoY
- ▲ 1.03%
- Metro
- San Diego-Chula Vista-Carlsbad, CA
- State GDP YoY
- ▲ 3.21%
- F500 in state
- 116
Industry mix (Fortune 500 HQ in CA)
| Industry | F500 HQs | Revenue |
|---|---|---|
| Technology | 27 | $1,492B |
|
||
| Financial Services | 3 | $174B |
|
||
| Retail | 3 | $44B |
|
||
| Insurance | 3 | $26B |
|
||
| Media / Entertainment | 2 | $115B |
|
||
| Pharmaceuticals / Biotech | 2 | $62B |
|
||
Price history
+187.2% since first listed23 events — show timeline
- 2026-06-15 Coming Soon $249,900 CRMLS
- 2024-09-30 Listing Removed — SDMLS
- 2024-09-21 Listed $275,000 SDMLS
- 2024-09-21 Listing Removed — SDMLS
- 2024-09-01 Price Changed $275,000 SDMLS
- 2024-08-29 Relisted — SDMLS
- 2024-08-26 Pending — SDMLS
- 2024-08-22 Relisted — SDMLS
- 2024-08-16 Pending — SDMLS
- 2024-07-15 Relisted — SDMLS
- 2024-07-08 Pending — SDMLS
- 2024-06-22 Price Changed $295,000 SDMLS
- 2024-05-23 Listed $315,000 SDMLS
- 2021-06-11 Sold (MLS) $150,000 CRMLS
- 2021-05-27 Pending — CRMLS
- 2021-05-27 Relisted — CRMLS
- 2021-05-17 Pending — CRMLS
- 2021-04-22 Price Changed $149,000 CRMLS
- 2021-04-05 Price Changed $157,000 CRMLS
- 2021-04-01 Listed $164,000 CRMLS
- 2016-05-09 Listing Removed — SDMLS
- 2016-04-05 Price Changed $78,900 SDMLS
- 2016-03-17 Listed $87,000 SDMLS
Property tax history
-15.0%/yrLatest (2014): $165 · -0.1% YoY. Source: county tax records.
Cash-flow waterfall
monthlySold comps — $/sqft
last 12 mo · ≤1 miLoading sold comps…