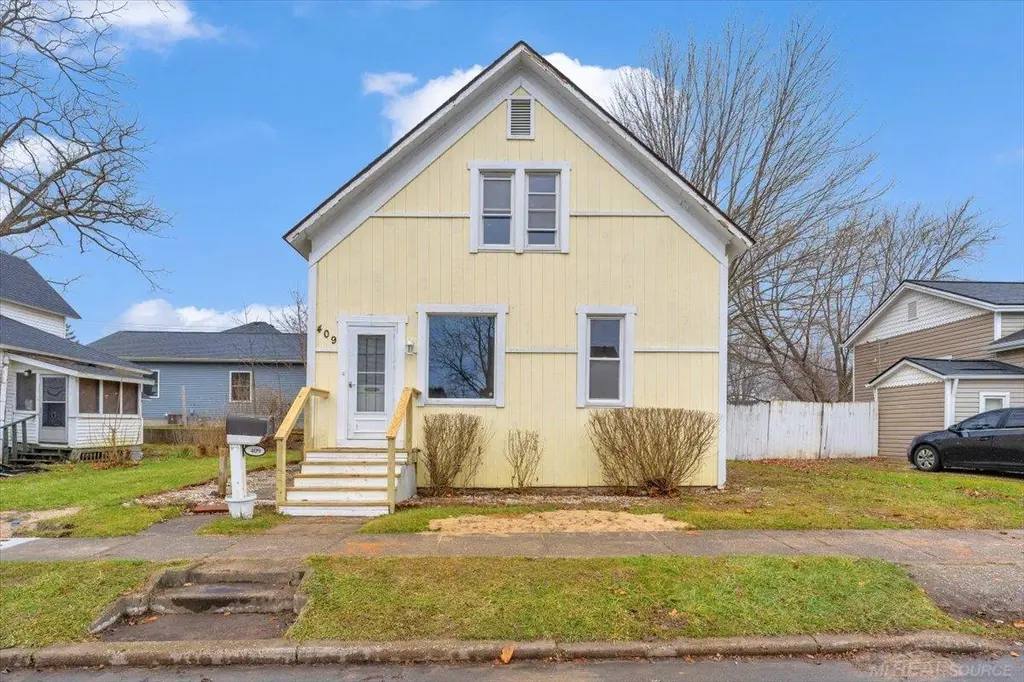
409 N Fifth St · St. Clair, MI
Flood risk 1/10 · Minimal
- FEMA flood zone
- X (unshaded)
- Chance of flooding over 30 yrs
- 0.0%
- Est. flood insurance / yr
- $507 – $1,088
Fire risk 1/10 · Minimal
- Est. fire insurance / yr
- $784 – $1,456
Heat risk 3/10 · Minor
- Hot days now (above 97°F)
- 7 days/yr
- Hot days in 30 yrs
- 14 days/yr
Wind risk 1/10 · Minimal
- Chance of severe wind over 30 yrs
- —
Air-quality risk 2/10 · Minimal
- Unhealthy air days now
- 1 days/yr
- Unhealthy air days in 30 yrs
- 2 days/yr
Risk factors via First Street. Map © Google.
Why this score? — see what drove the D grade
The composite is a weighted blend of 9 inputs, each scored 0–100. Each bar is that input's sub-score; the figure is the points it added to the 100-point composite (weight × sub-score).
- ARV discount +15.0/15.0
- Cash flow +10.4/30.0
- Schools +3.4/10.0
- 1% rule +3.3/10.0
- DSCR +3.0/10.0
- Rent growth +2.5/5.0
- Livability +2.5/5.0
- Condition / age +2.5/5.0
- Appreciation +0.0/10.0
$165,000
🖨 Deal sheet (PDF) 📄 Offer letter ✓ Due diligence
Listing remarks MLS
Completely renovated throughout, new kitchen, flooring, bath. Nice home walking distance to downtown St. Clair.
Key facts
- New kitchen
- 3,049 sq ft lot
- Built 1950
Tags
Neighborhood map
What this means for you Summary
Snapshot
- This is a 3-bed/1.0-bath single-family listed at $165k.
Deal economics
- At list price, monthly cash flow is $-88 ($-1k/yr) — negative.
- To cash-flow at today's rent, offer at most $149k (9.4% below list).
- To meet the 1% rule (rent ≥ 1% of price), the offer needs to be $138k (16.6% below list).
- Recommended offer: $138k (16.6% below list) — sets the bar for 1% rule.
- Cap rate 5.7% vs local median 1.9% in St. Clair — top-decile yield for the area; either an underpriced asset or a hidden risk that comps aren't pricing in. Stress-test before assuming the spread holds.
Location & tenants
- Location reads: area grade D — affects rentability + tenant quality, not the cash-flow math above.
- East China School District (suburban): math 32% / reading 46% proficiency, ranked #208 of 540 in MI (top 38%) — families likely to look elsewhere, expect single-tenant / working-renter base with shorter leases.
- Market conditions: 93 active listings in the ZIP; 2 comparable units currently listed for rent nearby; 232 units permitted in St. Clair County in 2024 (0 in 5+ unit buildings).
Forward outlook
- Local home prices are declining (-3.0%/yr); year-one equity from $1k of loan paydown is wiped out by about $5k of value loss. Plan a longer hold.
- St. Clair County population projected at -20% by 2050 — secular population decline; favor cash flow + early exit over multi-decade hold.
Negotiation context
- It's been on market 117 days — a 9% lower offer ($150k) is reasonable based on typical stale-listing flexibility.
- 4 sale attempts since 3y ago; this cycle's ask has dropped $45k (21%) from the opening price — seller is motivated, your offer sets the floor, not the list.
- Current owner paid $75k; list at $165k implies a 120% gain — meaningful room to come down on a strong offer.
Risks & watch-outs
- Watch-outs: built in 1950 — expect roof / HVAC / electrical / plumbing capex.
Questions for the listing agent
- What do current leases actually rent for vs. the listed asking? Can we see a recent rent roll and the last 12 months of T-12 income?
- It's been on market 117 days. Have you received any prior offers? Is the seller open to a 17% concession, seller financing, or rate buy-down credit?
- Built in 1950 — when were the roof, HVAC, electrical panel, plumbing, and water heater last replaced?
- Why hasn't it sold? Are there any deal-killer items the seller is aware of (foundation, flood, title, zoning, code violations)?
- Is there a deadline driving the sale (1031 exchange, divorce, estate, relocation)? That informs how much negotiation room exists.
- The area grade is low — what's the realistic commute time and amenity access for the typical tenant pool here? Any planned neighborhood developments (good or bad) we should know about?
- What's the average days-on-market for RENTAL listings here right now (not sales)? A rising rental-DOM trend means longer vacancies and softer asking-rent achievability than the comps imply.
- What's the recent tenant-quality profile in this submarket — average credit score on applications, eviction rate, late-payment / NSF rate, and stable-employment percentage? A property-management company in the area should have these aggregated.
- How much new for-sale + rental construction is in the pipeline within 1–3 miles? Heavy new supply typically softens prices + rents 12–24 months out; constrained supply supports both.
Investment metrics
- 1% rule
- 0.83% ✗
- Cap rate
- 5.65%
- Cash-on-cash
- -2.29%
- DSCR
- 0.90
- GRM
- 10.0
CMA / ARV
- ARV (median comp)
- $206,149
- List price
- $165,000
- Delta
- -19.96%
- Verdict
- UNDERPRICED
- Comps
- 20 within 1.0 mi
Show comp detail 12 sales within ~0.75 mi
| Address | Dist | Beds/Ba | Sqft | Sold | Price | $/sf | Match |
|---|---|---|---|---|---|---|---|
| 606 N Sixth St | 0.12mi | 3/2.0 | 1,517 (+6%) | 2mo | $220,000 | $145 | 79 |
| 718 N Ninth St | 0.24mi | 2/1.5 (-1) | 1,468 (+2%) | 1mo | $248,000 | $169 | 77 |
| 402 S 5th St | 0.32mi | 3/1.0 | 1,354 (-6%) | 3mo | $95,000 | $70 | 73 |
| 112 S Tenth St | 0.34mi | 4/1.5 (+1) | 1,375 (-4%) | 7mo | $200,000 | $145 | 65 |
| 310 S 6th St | 0.28mi | 3/2.5 | 1,550 (+8%) | 4mo | $370,000 | $239 | 64 |
| 715 S 9th St | 0.53mi | 2/2.0 (-1) | 1,400 (-2%) | 0mo | $127,000 | $91 | 62 |
| 615 S 8th St | 0.47mi | 4/1.0 (+1) | 1,354 (-6%) | 6mo | $168,000 | $124 | 59 |
| 209 S 7th St | 0.25mi | 4/1.5 (+1) | 1,240 (-14%) | 1mo | $195,000 | $157 | 58 |
| 517 Cedar St | 0.52mi | 3/1.0 | 1,548 (+8%) | 8mo | $175,200 | $113 | 56 |
| 635 N 3rd St | 0.24mi | 2/1.0 (-1) | 1,246 (-13%) | 8mo | $215,000 | $173 | 55 |
| 841 S 12th St | 0.66mi | 3/1.5 | 1,570 (+10%) | 2mo | $250,000 | $159 | 50 |
| 814 S 7th St | 0.55mi | 3/2.0 | 1,585 (+11%) | 5mo | $235,000 | $148 | 48 |
Match score weights: distance 35% · size 25% · config 20% · recency 20%. Top-matched comps best support the ARV.
Projected returns pro-forma
-3.0% appreciation · 3.0% rent growth · sell at horizon
- IRR
- -20.1%
- Equity multiple
- 0.30×
- Total profit
- $-32,308
- Equity at exit
- $24,602
- IRR
- -13.0%
- Equity multiple
- 0.24×
- Total profit
- $-35,189
- Equity at exit
- $14,266
Cash invested: $46,200 (down + closing). Projections, not guarantees.
Landlord ↔ Tenant lean methodology
- Overall (STATE)
- 62 Landlord-Friendly
- State Michigan
- 62 Landlord-Friendly · EVEN
- County
- — inherits STATE
- City
- — inherits STATE
ZIP-level market 48079
- Active inventory
- 93
- Price-to-rent
- 10.0×
Monthly cashflow live
- Estimated rent
- $1,376 medium interval (Pro) →
- Mortgage (P&I)
- −$865
- Tax from tax record
- −$241 /mo · $2,890/yr
- Insurance
- −$69
- HOA
- −$0
- Vacancy / Maint / Mgmt
- −$289
- Net cashflow
- $-88
Break-even live
Sensitivity live
| Price | -10% $5 | -5% $-41 | +0% $-88 | +5% $-135 | +10% $-182 |
|---|---|---|---|---|---|
| Rent | -10% $-197 | -5% $-142 | +0% $-88 | +5% $-34 | +10% $21 |
| Rate | -1.0pp $-5 | -0.5pp $-46 | base $-88 | +0.5pp $-131 | +1.0pp $-174 |
UW: 25.0% down · 7.5% · 30yr · 1.5% tax · 5.0% vac · 8.0% maint · 8.0% mgmt
Financing live
Cash to close
- Down payment
- $41,250
- Closing costs
- $4,950
- Reserves months
- —
- Total cash needed
- —
Loan-product check · same deal, 3 products live
Conventional
25% down · 7.5% · 30yr
- Down + closing
- —
- Monthly P&I
- —
- Monthly cashflow
- —
- DSCR
- —
- Eligible?
- —
Personal DTI + credit; lowest rate.
DSCR
20% down · 8.5% · 30yr
- Down + closing
- —
- Monthly P&I
- —
- Monthly cashflow
- —
- DSCR
- —
- Eligible?
- —
No personal income docs; deal must DSCR.
Hard money
10% down · 12.0% · 12mo
- Down + closing
- —
- Monthly P&I
- —
- Monthly cashflow
- —
- DSCR
- —
- Eligible?
- —
Short-term bridge; refi at stabilization.
Rent comps 2 comps
| Address | Beds | Baths | Sqft | Rent | $/sqft | DOM | Units | Dist |
|---|---|---|---|---|---|---|---|---|
| 2700 Cox Rd St Clair, MI | 3.0 | 2.0 | 1152 | $1,099 | $0.95 | 0d | 1 | 1.22mi |
| 322 Hathaway St East China, MI | 2.0 | 1.0 | 875 | $1,800 | $2.06 | 45d | 1 | 1.42mi |
Listing history 34 events
-
2026-06-15statusdays on market $165,000 Pending 117 DOM
-
2026-06-13days on market $165,000 Active 116 DOM
-
2026-06-12days on market $165,000 Active 115 DOM
-
2026-06-09days on market $165,000 Active 112 DOM
-
2026-06-08days on market $165,000 Active 111 DOM
-
2026-06-07days on market $165,000 Active 110 DOM
-
2026-06-07days on market $165,000 Active 109 DOM
-
2026-06-04days on market $165,000 Active 106 DOM
-
2026-06-02days on market $165,000 Active 105 DOM
-
2026-06-01days on market $165,000 Active 104 DOM
-
2026-05-31days on market $165,000 Active 103 DOM
-
2026-05-31days on market $165,000 Active 102 DOM
-
2026-04-24price $179,000 111-char remark
Show marketing remark (111 chars)
Completely renovated throughout, new kitchen, flooring, bath. Nice home walking distance to downtown St. Clair.
-
2026-04-24price $179,000 111-char remark
Show marketing remark (111 chars)
Completely renovated throughout, new kitchen, flooring, bath. Nice home walking distance to downtown St. Clair.
-
2026-04-08price $189,000 111-char remark
Show marketing remark (111 chars)
Completely renovated throughout, new kitchen, flooring, bath. Nice home walking distance to downtown St. Clair.
-
2026-04-08price $189,000 111-char remark
Show marketing remark (111 chars)
Completely renovated throughout, new kitchen, flooring, bath. Nice home walking distance to downtown St. Clair.
-
2026-03-11price $199,000 111-char remark
Show marketing remark (111 chars)
Completely renovated throughout, new kitchen, flooring, bath. Nice home walking distance to downtown St. Clair.
-
2026-03-11price $199,000 111-char remark
Show marketing remark (111 chars)
Completely renovated throughout, new kitchen, flooring, bath. Nice home walking distance to downtown St. Clair.
-
2026-02-17$210,000 Active 111-char remark
Show marketing remark (111 chars)
Completely renovated throughout, new kitchen, flooring, bath. Nice home walking distance to downtown St. Clair.
-
2026-02-17$210,000 Active 111-char remark
Show marketing remark (111 chars)
Completely renovated throughout, new kitchen, flooring, bath. Nice home walking distance to downtown St. Clair.
-
2024-03-07soldstatus $75,000 Sold
-
2024-03-07soldstatus $75,000 Closed
-
2024-02-20status Pending
-
2024-02-20status Pending
-
2024-02-03price $90,000
-
2024-02-02price $90,000
-
2024-01-18price $123,250
-
2024-01-17price $123,250
-
2023-11-15price $130,500
-
2023-11-15price $130,500
-
2023-10-17price $137,750
-
2023-10-17price $137,750
-
2023-09-13$145,000 Active
-
2023-09-13$145,000 Active
ⓘ Source: listings_history table (triggers on properties + properties_extension) + one-shot
backfill from property_details.listing_events for pre-trigger history.
Tax reassessment forecast MI · Partial reset (capped growth)
- Current annual tax
- $2,890 · $241/mo
- Projected year-2 tax
- $2,890 · $241/mo
- Expected delta
- $0/yr ($0/mo · 0.0%)
ⓘ Screening estimate from a state-policy table — verify with the county assessor before closing.
Climate risk First Street
- Flood 1/10 Low FEMA zone X (unshaded) · 0% chance over 30 yrs
- Wildfire 1/10 Low
- Heat 3/10 Moderate 7 d/yr ≥97°F today · 14 d/yr by 30 yrs out
- Wind 1/10 Low
- Air quality 2/10 Low 1 unhealthy d/yr today · 2 by 30 yrs out
Nearby sold comps map
Loading sold comps map…
Walkable amenities ~0.75 mi
Loading nearby amenities…
Taxation est. · year 1
- Rental income
- $16,507
- − Mortgage interest
- −$9,243
- − Property taxes
- −$2,890
- − Insurance
- −$825
- − Repairs & maintenance
- −$1,321
- − Management
- −$1,321
- − Depreciation
- −$4,800
- Taxable loss
- −$3,891
- Est. tax savings @ 24.0%
- +$934
- After-tax cash flow
- $-124/yr
For passive investors: Depreciation is non-cash, so a rental often shows a tax loss while cash-flowing — sheltering income. Rental losses are passive: they offset passive income freely, and up to $25,000/yr can offset ordinary (W-2) income if you actively participate and your MAGI is under $100k (phasing out to $0 by $150k); unused losses carry forward. On sale, claimed depreciation is recaptured at up to 25%, and gains may owe capital-gains tax (a 1031 exchange can defer both). Figures are a year-1 estimate at your 24.0% rate — not tax advice; consult a CPA.
Schools (NCES district)
- District
- East China School District
- NCES district ID
- 2612420
- Math proficiency
- 32% ▼ -9.00%
- Reading proficiency
- 46% ▼ -8.00%
- Median HH income
- $56,455
- Composite
- 34.23/100
- National rank
- #5260
- State rank
- #208 of 540 in MI
Livability — St. Clair
No livability data for this city. (Only ~50 U.S. cities are tracked.)
Census & demographics
- Census place
- St. Clair, MI
- Population (ZIP)
- 12,683
Population outlook (St. Clair County) Hauer SSP2
- Today (2025)
- 154,587 people
- By 2030
- 150,031 · -2.9%
- By 2040
- 138,177 · -10.6%
- By 2050
- 124,390 · -19.5%
- By 2075
- 95,825 · -38.0%
- By 2100
- 68,672 · -55.6%
Race, ethnicity, and origin ACS 2023
- Neighborhood character
- Predominantly White (94%)
- Race & ethnicity
- White 94% Two or more races 4% Hispanic / Latino 2%
- Common ancestry
- Romanian 12% Lithuanian 7% Slovak 2%
- Foreign-born
- 3% · Canada
- Languages at home
- 97% English-only · Other Indo-European 1% Spanish 1%
Political lean MEDSL · St. Clair
- 2024 margin
- Solid R (+34.6) · D 32.0% · R 66.6% · Other 1.4%
- 2008→2024 swing
- -37.3pp toward R · 2008: 2.6pp · 2024: -34.6pp
- All cycles
- 2024: R+34.6 2020: R+30.2 2016: R+31.4 2012: R+7.1 2008: D+2.6
Not yet ingested
- Civics
- —
Market trends
- HPI YoY
- ▼ -127.23%
- Current HPI
- 195.2392
- Rent YoY
- —
- Metro
- —
- State GDP YoY
- ▲ 1.37%
- F500 in state
- 28
Industry mix (Fortune 500 HQ in MI)
| Industry | F500 HQs | Revenue |
|---|---|---|
| Automotive Parts | 3 | $48B |
|
||
| Automotive | 2 | $372B |
|
||
| Chemicals | 1 | $45B |
|
||
| Automotive Retail | 1 | $29B |
|
||
| Healthcare / Medical Devices | 1 | $23B |
|
||
| Automotive Technology | 1 | $20B |
|
||
Price history
+23.4% since first listed22 events — show timeline
- 2026-04-24 Price Changed $179,000 MiRealSource-MiMLS
- 2026-04-24 Price Changed $179,000 REALCOMP
- 2026-04-08 Price Changed $189,000 MiRealSource-MiMLS
- 2026-04-08 Price Changed $189,000 REALCOMP
- 2026-03-11 Price Changed $199,000 MiRealSource-MiMLS
- 2026-03-11 Price Changed $199,000 REALCOMP
- 2026-02-17 Listed $210,000 REALCOMP
- 2026-02-17 Listed $210,000 MiRealSource-MiMLS
- 2024-03-07 Sold (MLS) $75,000 MiRealSource-MiMLS
- 2024-03-07 Sold (MLS) $75,000 REALCOMP
- 2024-02-20 Pending — MiRealSource-MiMLS
- 2024-02-20 Pending — REALCOMP
- 2024-02-03 Price Changed $90,000 MiRealSource-MiMLS
- 2024-02-02 Price Changed $90,000 REALCOMP
- 2024-01-18 Price Changed $123,250 MiRealSource-MiMLS
- 2024-01-17 Price Changed $123,250 REALCOMP
- 2023-11-15 Price Changed $130,500 MiRealSource-MiMLS
- 2023-11-15 Price Changed $130,500 REALCOMP
- 2023-10-17 Price Changed $137,750 MiRealSource-MiMLS
- 2023-10-17 Price Changed $137,750 REALCOMP
- 2023-09-13 Listed $145,000 MiRealSource-MiMLS
- 2023-09-13 Listed $145,000 REALCOMP
Property tax history
+10.2%/yrLatest (2025): $2,890 · +72.3% YoY. Source: county tax records.
Cash-flow waterfall
monthlySold comps — $/sqft
last 12 mo · ≤1 miLoading sold comps…