 🏗️ New Construction
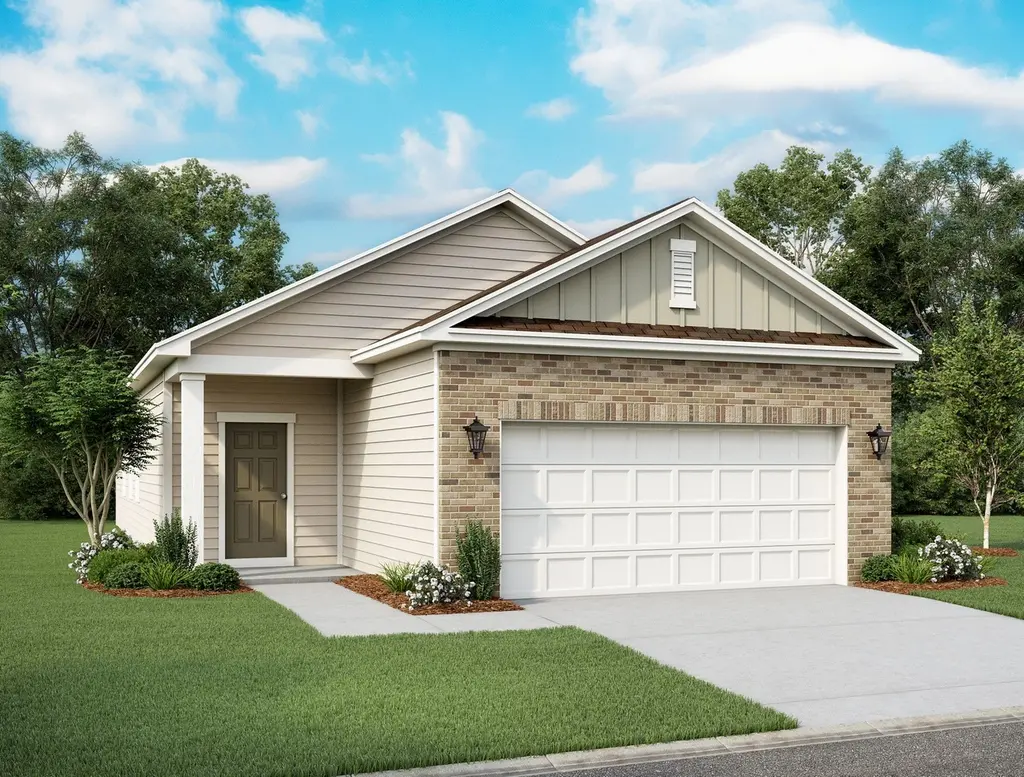
Odyssey Plan · Sonterra, TX
Flood risk 1/10 · Minimal
- FEMA flood zone
- X (unshaded)
- Chance of flooding over 30 yrs
- 0.0%
- Est. flood insurance / yr
- $507 – $1,088
Fire risk 4/10 · Minor
- Est. fire insurance / yr
- $1,222 – $2,270
Heat risk 8/10 · Major
- Hot days now (above 107°F)
- 7 days/yr
- Hot days in 30 yrs
- 26 days/yr
Wind risk 8/10 · Major
- Chance of severe wind over 30 yrs
- 80.0%
Air-quality risk 2/10 · Minimal
- Unhealthy air days now
- 1 days/yr
- Unhealthy air days in 30 yrs
- 1 days/yr
Risk factors via First Street. Map © Google.
Why this score? — see what drove the F grade
The composite is a weighted blend of 9 inputs, each scored 0–100. Each bar is that input's sub-score; the figure is the points it added to the 100-point composite (weight × sub-score).
- ARV discount +7.5/15.0
- Cash flow +6.8/30.0
- Condition / age +4.0/5.0
- Livability +2.5/5.0
- Rent growth +2.1/5.0
- Schools +2.1/10.0
- 1% rule +1.8/10.0
- DSCR +1.0/10.0
- Appreciation +0.0/10.0
$224,990
🖨 Deal sheet 📄 Offer letter ✓ Due diligence
Listing remarks MLS
The Odyssey is a great place for any couple or family looking for a 3 bedroom, 2 bath home. The kitchen features brand new stainless steel appliances, granite countertops and a spacious island. There's room to spread out with a 2-car garage and a covered patio.
Key facts
- Spacious island
- Covered patio
- Granite countertops
Tags
Neighborhood map
What this means for you Summary
Snapshot
- This is a 3-bed/2.0-bath single-family listed at $225k. Condition is rated good.
Deal economics
- At list price, monthly cash flow is $-430 ($-5k/yr) — negative.
- To cash-flow at today's rent, offer at most $210k (6.5% below list).
- To meet the 1% rule (rent ≥ 1% of price), the offer needs to be $184k (18.2% below list).
- Recommended offer: $184k (18.2% below list) — sets the bar for 1% rule.
Location & tenants
- Location reads: area grade F — affects rentability + tenant quality, not the cash-flow math above.
- Jarrell ISD (rural): math 19% / reading 28% proficiency, ranked #713 of 826 in TX (top 86%) — low school quality limits family demand, transient renter base, plan for 1-2y turnover.
- Market conditions: Rents soft (-1.7%/yr); 761 active listings in the ZIP; 34 comparable units currently listed for rent nearby; rentals at typical pace (median 20d on market — plan ~3-4 weeks tenant-placement turnaround); solid renter incomes; 7,543 units permitted in Williamson County in 2024 (1,425 in 5+ unit buildings).
Forward outlook
- Local home prices are declining (-3.0%/yr); year-one equity from $2k of loan paydown is wiped out by about $8k of value loss. Plan a longer hold.
- Williamson County population projected at +69% by 2050 — long-run rental-demand tailwind backs the buy-and-hold thesis.
Negotiation context
- It's been on market 266 days — a 12% lower offer ($198k) is reasonable based on typical stale-listing flexibility.
Risks & watch-outs
- Climate carrying-cost: severe wind risk, 80% chance of damaging wind over 30y; extreme-heat days projected 7→26/yr by 2055 (HVAC capex compounding) — expect insurance premiums to compound above CPI over the hold.
Questions for the listing agent
- What do current leases actually rent for vs. the listed asking? Can we see a recent rent roll and the last 12 months of T-12 income?
- It's been on market 266 days. Have you received any prior offers? Is the seller open to a 18% concession, seller financing, or rate buy-down credit?
- Why hasn't it sold? Are there any deal-killer items the seller is aware of (foundation, flood, title, zoning, code violations)?
- Is there a deadline driving the sale (1031 exchange, divorce, estate, relocation)? That informs how much negotiation room exists.
- The area grade is low — what's the realistic commute time and amenity access for the typical tenant pool here? Any planned neighborhood developments (good or bad) we should know about?
- What's the average days-on-market for RENTAL listings here right now (not sales)? A rising rental-DOM trend means longer vacancies and softer asking-rent achievability than the comps imply.
- What's the recent tenant-quality profile in this submarket — average credit score on applications, eviction rate, late-payment / NSF rate, and stable-employment percentage? A property-management company in the area should have these aggregated.
- How much new for-sale + rental construction is in the pipeline within 1–3 miles? Heavy new supply typically softens prices + rents 12–24 months out; constrained supply supports both.
Investment metrics
- 1% rule
- 0.68% ✗
- Cap rate
- 4.40%
- Cash-on-cash
- -6.76%
- DSCR
- 0.70
- GRM
- 12.3
CMA / ARV
- ARV (median comp)
- $272,434
- List price
- $224,990
- Delta
- -17.41%
- Verdict
- UNDERPRICED
- Comps
- 20 within 1.0 mi
Show comp detail 12 sales within ~0.75 mi
| Address | Dist | Beds/Ba | Sqft | Sold | Price | $/sf | Match |
|---|---|---|---|---|---|---|---|
| 101 Dirty Harry Dr | 0.01mi | 3/2.0 | 1,412 (0%) | 0mo | $257,044 | $182 | 99 |
| 124 Perfect World Loop | 0.36mi | 3/2.0 | 1,422 (+1%) | 2mo | $229,000 | $161 | 80 |
| 360 Enforcer Loop | 0.14mi | 3/2.0 | 1,522 (+8%) | 3mo | $234,891 | $154 | 78 |
| 329 Enforcer Loop | 0.21mi | 3/2.0 | 1,522 (+8%) | 1mo | $268,190 | $176 | 76 |
| 240 Line Of Fire Way | 0.42mi | 3/2.0 | 1,367 (-3%) | 5mo | $234,900 | $172 | 71 |
| 381 Enforcer Loop | 0.13mi | 3/2.5 | 1,605 (+14%) | 6mo | $259,741 | $162 | 64 |
| 335 Enforcer Loop | 0.20mi | 3/2.5 | 1,605 (+14%) | 4mo | $268,020 | $167 | 62 |
| 312 The Bad Way | 0.49mi | 3/2.0 | 1,276 (-10%) | 2mo | $199,999 | $157 | 59 |
| 265 Escape Way | 0.42mi | 4/2.0 (+1) | 1,531 (+8%) | 3mo | $268,990 | $176 | 59 |
| 200 Escape Way | 0.42mi | 4/2.0 (+1) | 1,531 (+8%) | 3mo | $274,990 | $180 | 59 |
| 225 Firefox Way | 0.45mi | 4/2.0 (+1) | 1,531 (+8%) | 3mo | $259,990 | $170 | 58 |
| 240 Alcatraz Loop | 0.37mi | 4/2.0 (+1) | 1,606 (+14%) | 6mo | $265,105 | $165 | 50 |
Match score weights: distance 35% · size 25% · config 20% · recency 20%. Top-matched comps best support the ARV.
Projected returns pro-forma
-3.0% appreciation · 0.0% rent growth · sell at horizon
- IRR
- -31.4%
- Equity multiple
- -0.01×
- Total profit
- $-76,872
- Equity at exit
- $40,621
- IRR
- -55.6%
- Equity multiple
- -0.61×
- Total profit
- $-122,892
- Equity at exit
- $23,555
Cash invested: $76,282 (down + closing). Projections, not guarantees.
Landlord ↔ Tenant lean methodology
- Overall (STATE)
- 87 Strongly Landlord-Friendly
- State Texas
- 87 Strongly Landlord-Friendly · R+5
- County
- — inherits STATE
- City
- — inherits STATE
ZIP-level market 76537
- Home prices YoY
- -14.4%
- Rents YoY
- -1.7%
- Active inventory
- 761
- Price-to-rent
- 10.2×
Monthly cashflow live
- Estimated rent
- $1,839 high interval (Pro) →
- Mortgage (P&I)
- −$1,429
- Tax est. 1.5%
- −$341 /mo · $4,087/yr
- Insurance
- −$114
- HOA
- −$0
- Vacancy / Maint / Mgmt
- −$386
- Net cashflow
- $-430
Break-even live
UW: 25.0% down · 7.5% · 30yr · 1.5% tax · 5.0% vac · 8.0% maint · 8.0% mgmt
Financing live
Cash to close
- Down payment
- $68,109
- Closing costs
- $8,173
- Reserves months
- —
- Total cash needed
- —
Loan-product check · same deal, 3 products live
Conventional
25% down · 7.5% · 30yr
- Down + closing
- —
- Monthly P&I
- —
- Monthly cashflow
- —
- DSCR
- —
- Eligible?
- —
Personal DTI + credit; lowest rate.
DSCR
20% down · 8.5% · 30yr
- Down + closing
- —
- Monthly P&I
- —
- Monthly cashflow
- —
- DSCR
- —
- Eligible?
- —
No personal income docs; deal must DSCR.
Hard money
10% down · 12.0% · 12mo
- Down + closing
- —
- Monthly P&I
- —
- Monthly cashflow
- —
- DSCR
- —
- Eligible?
- —
Short-term bridge; refi at stabilization.
Rent comps 34 comps
| Address | Beds | Baths | Sqft | Rent | $/sqft | DOM | Units | Dist |
|---|---|---|---|---|---|---|---|---|
| 125 Kellys Heroes Way Jarrell, TX | 3.0 | 2.0 | 1641 | $1,650 | $1.01 | 44d | 1 | 0.21mi |
| 137 Kellys Heroes Way Jarrell, TX | 3.0 | 2.0 | 1214 | $1,695 | $1.40 | 44d | 1 | 0.21mi |
| 104 Perfect World Loop Jarrell, TX | 4.0 | 2.0 | 1751 | $1,885 | $1.08 | 3d | 1 | 0.31mi |
| 104 Perfect World Loop Jarrell, TX | 4.0 | 2.0 | 1751 | $1,885 | $1.08 | 4d | 1 | 0.31mi |
| 376 Rae Ln Unit A Jarrell, TX | 3.0 | 2.0 | 1200 | $1,695 | $1.41 | 22d | 1 | 0.33mi |
| 241 Alcatraz Loop Jarrell, TX | 3.0 | 2.0 | 1288 | $1,895 | $1.47 | 18d | 1 | 0.33mi |
| 420 Perfect World Loop Jarrell, TX | 3.0 | 2.0 | 1242 | $1,500 | $1.21 | 4d | 1 | 0.41mi |
| 340 The Bad Way Jarrell, TX | 4.0 | 2.0 | 1616 | $1,695 | $1.05 | 44d | 1 | 0.44mi |
| 340 The Bad Way Jarrell, TX | 4.0 | 2.0 | 1616 | $1,695 | $1.05 | 24d | 1 | 0.44mi |
| 125 Unforgiven Ln Jarrell, TX | 4.0 | 2.0 | 1600 | $1,700 | $1.06 | 3d | 1 | 0.55mi |
| 637 The Ugly Way Jarrell, TX | 4.0 | 2.0 | 1688 | $1,795 | $1.06 | 44d | 1 | 0.59mi |
| 125 Drifter Ln Jarrell, TX | 3.0 | 2.0 | 1753 | $1,845 | $1.05 | 4d | 1 | 0.60mi |
| 465 Unforgiven Ln Jarrell, TX | 4.0 | 2.0 | 1531 | $1,750 | $1.14 | 18d | 1 | 0.64mi |
| 195 Outlaw Dr Jarrell, TX | 3.0 | 2.0 | 1573 | $1,799 | $1.14 | 44d | 1 | 0.69mi |
| 149 Vulcan Dr Jarrell, TX | 3.0 | 2.0 | 1450 | $1,799 | $1.24 | 24d | 1 | 0.75mi |
| 873 Circle Way Jarrell, TX | 3.0 | 2.0 | 1450 | $1,650 | $1.14 | 15d | 1 | 0.77mi |
| 117 Galaxy Way Jarrell, TX | 3.0 | 2.0 | 1276 | $1,650 | $1.29 | 20d | 1 | 0.81mi |
| 621 Xanadu Dr Jarrell, TX | 3.0 | 2.0 | 1586 | $1,750 | $1.10 | 4d | 1 | 0.90mi |
| 600 Shimek St Unit 19A Jarrell, TX | 3.0 | 2.0 | 1357 | $1,650 | $1.22 | 18d | 1 | 1.04mi |
| 108 Igneous Ln Jarrell, TX | 3.0 | 2.0 | 1534 | $1,800 | $1.17 | 13d | 1 | 1.04mi |
| 324 Circle Way Jarrell, TX | 3.0 | 2.5 | 1661 | $1,650 | $0.99 | 11d | 1 | 1.05mi |
| 1100 Jackson Ln Jarrell, TX | 4.0 | 2.5 | 1839 | $1,745 | $0.95 | 4d | 1 | 1.11mi |
| 244 Circle Way Jarrell, TX | 3.0 | 2.0 | 1242 | $1,545 | $1.24 | 20d | 1 | 1.11mi |
| 224 Amber Ln Jarrell, TX | 3.0 | 2.0 | 1133 | $1,475 | $1.30 | 20d | 1 | 1.21mi |
| 140 Amber Ln Jarrell, TX | 3.0 | 2.0 | 1584 | $1,749 | $1.10 | 18d | 1 | 1.22mi |
| 104 Hellfighters Way Jarrell, TX | 3.0 | 2.5 | 1619 | $2,000 | $1.24 | 44d | 1 | 1.27mi |
| 449 Stone Water Ln Jarrell, TX | 3.0 | 2.5 | 1674 | $1,900 | $1.14 | 44d | 1 | 1.30mi |
| 417 Sapphire Ln Jarrell, TX | 3.0 | 2.0 | 1537 | $1,499 | $0.98 | 24d | 1 | 1.30mi |
| 140 Calcite Ln Jarrell, TX | 3.0 | 2.0 | 1401 | $1,650 | $1.18 | 24d | 1 | 1.33mi |
| 121 Old Stagecoach Rd Jarrell, TX | 4.0 | 2.0 | 1531 | $1,800 | $1.18 | 44d | 1 | 1.42mi |
| 400 Captain Grumbles Dr Jarrell, TX | 3.0 | 2.0 | 1463 | $1,550 | $1.06 | 24d | 1 | 1.46mi |
| 105 McLintock Rd Jarrell, TX | 3.0–5.0 | 2.0–3.5 | 1773 | $2,055 | $1.16 | 2d | 1 | 1.50mi |
| 5033 Cressler Ln Jarrell, TX | 3.0 | 2.5 | 1339 | $1,595 | $1.19 | 4d | 1 | 1.50mi |
| 104 Fighting Seabees Run Unit NA Jarrell, TX | 2.0 | 1.0 | 900 | $1,500 | $1.67 | 2d | 1 | 1.50mi |
Listing history 17 events
-
2026-06-18days on market $224,990 Active 266 DOM
-
2026-06-17days on market $224,990 Active 265 DOM
-
2026-06-16days on market $224,990 Active 264 DOM
-
2026-06-15days on market $224,990 Active 263 DOM
-
2026-06-13days on market $224,990 Active 261 DOM
-
2026-06-09days on market $224,990 Active 257 DOM
-
2026-06-08days on market $224,990 Active 256 DOM
-
2026-06-07days on market $224,990 Active 255 DOM
-
2026-06-04pricedays on market $224,990 Active 252 DOM
-
2026-06-03days on market $250,990 Active 251 DOM
-
2026-06-02days on market $250,990 Active 250 DOM
-
2026-06-01days on market $250,990 Active 249 DOM
-
2026-05-31days on market $250,990 Active 248 DOM
-
2025-12-03price $250,990 261-char remark
Show marketing remark (261 chars)
The Odyssey is a great place for any couple or family looking for a 3 bedroom, 2 bath home. The kitchen features brand new stainless steel appliances, granite countertops and a spacious island. There's room to spread out with a 2-car garage and a covered patio.
-
2025-10-16price $249,990 261-char remark
Show marketing remark (261 chars)
The Odyssey is a great place for any couple or family looking for a 3 bedroom, 2 bath home. The kitchen features brand new stainless steel appliances, granite countertops and a spacious island. There's room to spread out with a 2-car garage and a covered patio.
-
2025-10-02price $266,990 261-char remark
Show marketing remark (261 chars)
The Odyssey is a great place for any couple or family looking for a 3 bedroom, 2 bath home. The kitchen features brand new stainless steel appliances, granite countertops and a spacious island. There's room to spread out with a 2-car garage and a covered patio.
-
2025-09-26$265,990 Active 261-char remark
Show marketing remark (261 chars)
The Odyssey is a great place for any couple or family looking for a 3 bedroom, 2 bath home. The kitchen features brand new stainless steel appliances, granite countertops and a spacious island. There's room to spread out with a 2-car garage and a covered patio.
ⓘ Source: listings_history table (triggers on properties + properties_extension) + one-shot
backfill from property_details.listing_events for pre-trigger history.
Climate risk First Street
- Flood 1/10 Low FEMA zone X (unshaded) · 0% chance over 30 yrs
- Wildfire 4/10 Moderate
- Heat 8/10 Severe 7 d/yr ≥107°F today · 26 d/yr by 30 yrs out
- Wind 8/10 Severe 80% chance of damaging wind over 30 yrs
- Air quality 2/10 Low 1 unhealthy d/yr today · 1 by 30 yrs out
Nearby sold comps map
Loading sold comps map…
Walkable amenities ~0.75 mi
Loading nearby amenities…
Taxation est. · year 1
- Rental income
- $22,073
- − Mortgage interest
- −$15,261
- − Property taxes
- −$4,087
- − Insurance
- −$1,362
- − Repairs & maintenance
- −$1,766
- − Management
- −$1,766
- − Depreciation
- −$7,925
- Taxable loss
- −$10,094
- Est. tax savings @ 24.0%
- +$2,422
- After-tax cash flow
- $-2,733/yr
For passive investors: Depreciation is non-cash, so a rental often shows a tax loss while cash-flowing — sheltering income. Rental losses are passive: they offset passive income freely, and up to $25,000/yr can offset ordinary (W-2) income if you actively participate and your MAGI is under $100k (phasing out to $0 by $150k); unused losses carry forward. On sale, claimed depreciation is recaptured at up to 25%, and gains may owe capital-gains tax (a 1031 exchange can defer both). Figures are a year-1 estimate at your 24.0% rate — not tax advice; consult a CPA.
Condition & rehab AI · 12 photos
This home is in excellent condition with no major repairs needed. It offers a great value for both resale and rental due to its well-maintained appearance and modern features.
Value-add opportunities
- Both Painting exterior and interior walls — Enhances curb appeal and interior aesthetics
- Both Landscaping improvements — Enhances curb appeal and adds value
- Both New flooring in bathrooms — Improves functionality and aesthetics
- Both New countertops in bathrooms — Improves functionality and aesthetics
Renovation cost estimate screening
Value-add ROI direction
- Both Painting exterior and interior walls — Enhances curb appeal and interior aesthetics ↑
- Both Landscaping improvements — Enhances curb appeal and adds value ↑
- Both New flooring in bathrooms — Improves functionality and aesthetics ↑
- Both New countertops in bathrooms — Improves functionality and aesthetics ↑
ⓘ Cost ranges are severity-bucket heuristics (US national rule-of-thumb). Get contractor quotes + a written scope before underwriting a rehab budget.
Schools (NCES district)
- District
- Jarrell ISD
- NCES district ID
- 4824600
- Math proficiency
- 19% ▼ -18.00%
- Reading proficiency
- 28% ▼ -5.00%
- Median HH income
- $57,132
- Composite
- 21.47/100
- National rank
- #8335
- State rank
- #713 of 826 in TX
Livability — Sonterra
No livability data for this city. (Only ~50 U.S. cities are tracked.)
Census & demographics
- County
- Williamson County · 680,029 people
- City population
- 12,526
- Metro
- Austin-Round Rock-Georgetown, TX
- Population (ZIP)
- 16,272
- Household income
- $98,199
- Rent vs Own
- Severe rent burden
- 225.0
Population outlook (Williamson County) Hauer SSP2
- Today (2025)
- 699,027 people
- By 2030
- 795,537 · +13.8%
- By 2040
- 990,683 · +41.7%
- By 2050
- 1,184,292 · +69.4%
- By 2075
- 1,623,825 · +132.3%
- By 2100
- 1,924,153 · +175.3%
Race, ethnicity, and origin ACS 2023
- Neighborhood character
- Diverse neighborhood (Simpson 0.63)
- Race & ethnicity
- White 48% Hispanic / Latino 36% Two or more races 14% Black 7% Asian 4%
- Hispanic origin (detail)
- Mexican 30% Puerto Rican 5%
- Common ancestry
- Romanian 3% Italian 2% Slovak 1%
- Foreign-born
- 13% · Canada, Vietnam
- Languages at home
- 69% English-only · Spanish 26% Chinese 2% French/Haitian/Cajun 1%
Political lean MEDSL · Williamson
- 2024 margin
- Toss-up / Even · D 48.0% · R 50.4% · Other 1.6%
- 2008→2024 swing
- +10.6pp toward D · 2008: -13.0pp · 2024: -2.5pp
- All cycles
- 2024: R+2.5 2020: D+1.4 2016: R+9.9 2012: R+21.5 2008: R+13.0
Not yet ingested
- Civics
- —
Market trends
- HPI YoY
- ▼ -31.03%
- Current HPI
- 184.8935
- Rent YoY
- ▼ -1.73%
- Metro
- Austin-Round Rock-Georgetown, TX
- State GDP YoY
- ▲ 3.95%
- F500 in state
- 110
Industry mix (Fortune 500 HQ in TX)
| Industry | F500 HQs | Revenue |
|---|---|---|
| Energy | 16 | $1,198B |
|
||
| Technology | 5 | $198B |
|
||
| Engineering / Construction | 4 | $72B |
|
||
| Energy Services | 3 | $60B |
|
||
| Utilities | 3 | $41B |
|
||
| Healthcare | 2 | $330B |
|
||
Price history
-5.6% since first listed4 events — show timeline
- 2025-12-03 Price Changed $250,990 Zillow
- 2025-10-16 Price Changed $249,990 Zillow
- 2025-10-02 Price Changed $266,990 Zillow
- 2025-09-26 Listed $265,990 Zillow
Cash-flow waterfall
monthlySold comps — $/sqft
last 12 mo · ≤1 miLoading sold comps…