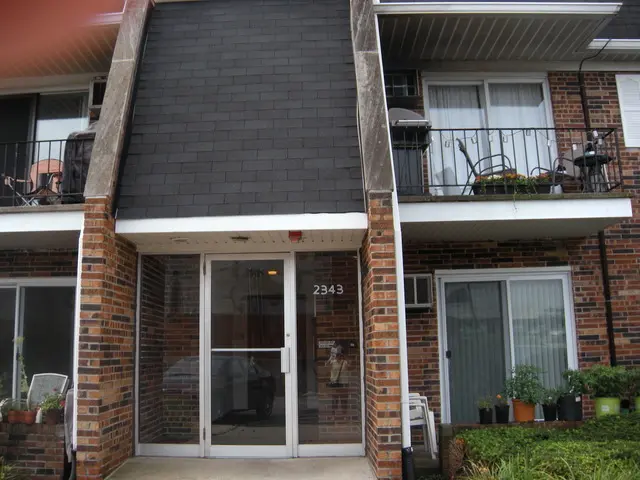
2343 Ogden Ave #11 · Downers Grove, IL
Flood risk 1/10 · Minimal
- FEMA flood zone
- X (unshaded)
- Chance of flooding over 30 yrs
- 0.0%
- Est. flood insurance / yr
- $507 – $1,088
Fire risk 3/10 · Minor
- Est. fire insurance / yr
- $804 – $1,492
Heat risk 3/10 · Minor
- Hot days now (above 104°F)
- 7 days/yr
- Hot days in 30 yrs
- 14 days/yr
Wind risk 2/10 · Minimal
- Chance of severe wind over 30 yrs
- 0.0%
Air-quality risk 3/10 · Minor
- Unhealthy air days now
- 3 days/yr
- Unhealthy air days in 30 yrs
- 4 days/yr
Risk factors via First Street. Map © Google.
Why this score? — see what drove the D grade
The composite is a weighted blend of 9 inputs, each scored 0–100. Each bar is that input's sub-score; the figure is the points it added to the 100-point composite (weight × sub-score).
- Cash flow +10.1/30.0
- ARV discount +7.5/15.0
- 1% rule +5.5/10.0
- Rent growth +4.4/5.0
- Schools +4.3/10.0
- Livability +4.3/5.0
- DSCR +2.9/10.0
- Condition / age +2.5/5.0
- Appreciation +0.0/10.0
$175,000
🖨 Deal sheet 📄 Offer letter ✓ Due diligence
Listing remarks MLS
Just move in and enjoy. Freshly painted, new laminated flooring & carpeting. Fully applianced eat in kitchen w/stove dishwasher & new refrigerator. Pantry cabinet. Sliding door to balcony overlooking pool and tennis courts. Updated bathroom. Linen closet. New air conditioner. Entry w/guest closet. Basment laundry & storage. Security entry. Assigned parking #46.
Key facts
- Separate dining room
- Linen closet
- Updated bathroom
Tags
Property features AI
Finance
- Other: Not currently leased; Possession at closing or immediate
- Financial info: Special Service Area: No
- HOA & community: Monthly association fee of $358; Association fee includes heat, water, insurance, pool, exterior maintenance, lawn care, and snow removal; Community amenities: coin laundry, storage, pool, tennis courts; Manager off-site; Pets allowed with limits (maximum pet weight 30 lbs)
Exterior
- Parking: 1 parking space
- Security: Security door lock(s) available through association
- Utilities: Water source: Lake Michigan; Public sewer
- Home design: Attached single condo; Entry level: 2; Condo ownership; Part of an 8-unit building; Brick construction; Built before 1978 (51–60 years old)
- Construction: Brick exterior
- Exterior features: Common lot dimensions
Interior
- Kitchen: Range; Dishwasher; Refrigerator; Kitchen on second level — 12 x 11
- Bedrooms: Master bedroom (second level) — 14 x 11; Additional bedrooms (two listed)
- Flooring: Wood laminate in living room and dining room
- Bathrooms: 1 full bathroom
- Heating & cooling: Steam and baseboard heating; Wall unit(s) for cooling
- Interior features: Unfinished full basement; 4 total rooms; Ceiling fan(s)
- Laundry & utility: Laundry room in basement — 15 x 20
Neighborhood map
What this means for you Summary
Snapshot
- This is a 1-bed/1.0-bath condo listed at $175k.
Deal economics
- At list price, monthly cash flow is $-103 ($-1k/yr) — negative.
- To cash-flow at today's rent, offer at most $157k (10.4% below list).
- Meets the 1% rule at list price ($2k rent vs $175k).
- Recommended offer: $157k (10.4% below list) — sets the bar for cash-flow.
- Cap rate 5.6% vs local median 2.9% in Downers Grove — top-decile yield for the area; either an underpriced asset or a hidden risk that comps aren't pricing in. Stress-test before assuming the spread holds.
Location & tenants
- Location reads 86/100 on livability (#24 in IL, #452 nationally) — a professional / high-income tenant draw. Strengths: crime A+, commute A+, employment A+; Watch: cost of living F.
- Chsd 99 (suburban): math 46% / reading 46% proficiency, ranked #66 of 620 in IL (top 11%) — families likely to look elsewhere, expect single-tenant / working-renter base with shorter leases.
- Market conditions: Rents rising fast (+7.6%/yr); 72 active listings in the ZIP; 13 comparable units currently listed for rent nearby; rentals leasing fast (median 3d on market — plan ~1-2 weeks tenant-placement turnaround); high-income renter base; 1,378 units permitted in DuPage County in 2024 (594 in 5+ unit buildings).
- This rent is only 18% of the median local income ($123k/yr) — well below the 30% rent-burden line; pricing power to push rent on renewal without tenant pushback.
Forward outlook
- Local home prices are declining (-3.0%/yr); year-one equity from $1k of loan paydown is wiped out by about $5k of value loss. Plan a longer hold.
Negotiation context
- Only 10 days on market — expect competitive offers; lowballing is unlikely to land.
- 4 sale attempts since 12y ago with the ask held roughly flat each time — persistent listings suggest the price (not the market) is what's stuck; bring a comps-based counter.
- Current owner paid $65k; list at $175k implies a 169% gain — meaningful room to come down on a strong offer.
Questions for the listing agent
- What do current leases actually rent for vs. the listed asking? Can we see a recent rent roll and the last 12 months of T-12 income?
- Built in 1968 — when were the roof, HVAC, electrical panel, plumbing, and water heater last replaced?
- What does the HOA fee cover, when was the last increase, and are there any pending special assessments or reserve-fund shortfalls?
- Any open or pending special assessments — roof, HVAC, plumbing, elevator, façade? What's the per-unit balance and payoff schedule, and is the seller paying it off at close or rolling it to the buyer?
- Is there a deadline driving the sale (1031 exchange, divorce, estate, relocation)? That informs how much negotiation room exists.
- Schools are B-rated — typically a magnet for longer-tenancy family renters. What's the average tenant stay here, and is there a school-zone premium baked into asking?
- The area grade is low — what's the realistic commute time and amenity access for the typical tenant pool here? Any planned neighborhood developments (good or bad) we should know about?
- What's the average days-on-market for RENTAL listings here right now (not sales)? A rising rental-DOM trend means longer vacancies and softer asking-rent achievability than the comps imply.
- What's the recent tenant-quality profile in this submarket — average credit score on applications, eviction rate, late-payment / NSF rate, and stable-employment percentage? A property-management company in the area should have these aggregated.
- How much new apartment / multifamily construction is in the pipeline within 1–3 miles? Heavy new supply (>2% of stock underway) typically softens rents 12–24 months out; light construction supports rent growth.
Investment metrics
- 1% rule
- 1.05% ✓
- Cap rate
- 5.58%
- Cash-on-cash
- -2.53%
- DSCR
- 0.89
- GRM
- 8.0
CMA / ARV
No comps found within radius.
Projected returns pro-forma
-3.0% appreciation · 7.64% rent growth · sell at horizon
- IRR
- -13.9%
- Equity multiple
- 0.47×
- Total profit
- $-25,758
- Equity at exit
- $26,093
- IRR
- 2.4%
- Equity multiple
- 1.21×
- Total profit
- $10,441
- Equity at exit
- $15,131
Cash invested: $49,000 (down + closing). Projections, not guarantees.
Landlord ↔ Tenant lean methodology
- Overall (STATE)
- 43 Moderately Tenant-Leaning
- State Illinois
- 43 Moderately Tenant-Leaning · D+7
- County
- — inherits STATE
- City
- — inherits STATE
ZIP-level market 60515
- Rents YoY
- 7.6%
- Active inventory
- 72
- Price-to-rent
- 8.0×
Monthly cashflow live
- Estimated rent
- $1,829 high interval (Pro) →
- Mortgage (P&I)
- −$918
- Tax from tax record
- −$200 /mo · $2,398/yr
- Insurance
- −$73
- HOA
- −$358
- Vacancy / Maint / Mgmt
- −$384
- Net cashflow
- $-103
Break-even live
UW: 25.0% down · 7.5% · 30yr · 1.5% tax · 5.0% vac · 8.0% maint · 8.0% mgmt
Financing live
Cash to close
- Down payment
- $43,750
- Closing costs
- $5,250
- Reserves months
- —
- Total cash needed
- —
Loan-product check · same deal, 3 products live
Conventional
25% down · 7.5% · 30yr
- Down + closing
- —
- Monthly P&I
- —
- Monthly cashflow
- —
- DSCR
- —
- Eligible?
- —
Personal DTI + credit; lowest rate.
DSCR
20% down · 8.5% · 30yr
- Down + closing
- —
- Monthly P&I
- —
- Monthly cashflow
- —
- DSCR
- —
- Eligible?
- —
No personal income docs; deal must DSCR.
Hard money
10% down · 12.0% · 12mo
- Down + closing
- —
- Monthly P&I
- —
- Monthly cashflow
- —
- DSCR
- —
- Eligible?
- —
Short-term bridge; refi at stabilization.
Rent comps 13 comps
| Address | Beds | Baths | Sqft | Rent | $/sqft | DOM | Units | Dist |
|---|---|---|---|---|---|---|---|---|
| 2343 Ogden Ave #10 Downers Grove, IL | 2.0 | 2.0 | 1114 | $1,750 | $1.57 | 15d | 1 | 0.03mi |
| 2419 Ogden Ave #6 Downers Grove, IL | 1.0 | 1.0 | 900 | $1,650 | $1.83 | 11d | 1 | 0.03mi |
| 4532 Pershing Ave Downers Grove, IL | 2.0 | 2.5 | 974 | $3,500 | $3.59 | 1d | 1 | 0.35mi |
| 4340 Wilson Ave Unit 4 Downers Grove, IL | 2.0 | 1.0 | 850 | $1,325 | $1.56 | 1d | 1 | 0.40mi |
| 4340 Wilson Ave Downers Grove, IL | 1.0 | 1.0 | 800 | $1,595 | $1.99 | 1d | 1 | 0.40mi |
| 4905 Belmont Rd Downers Grove, IL | 1.0 | 1.0 | 710 | $1,400 | $1.97 | 1d | 1 | 0.63mi |
| 420 Walnut Creek Rd Unit 3507 Lisle, IL | 1.0 | 1.0 | 860 | $1,500 | $1.74 | 24d | 1 | 0.67mi |
| 420 Walnut Creek Ln Lisle, IL | 1.0 | 1.0 | 804 | $1,480 | $1.84 | 43d | 2 | 0.67mi |
| 430 Walnut Creek Rd Unit 2308 Lisle, IL | 1.0 | 1.0 | 770 | $1,575 | $2.05 | 17d | 1 | 0.69mi |
| 430 Walnut Creek Ln Lisle, IL | 1.0 | 1.0 | 759 | $1,562 | $2.06 | 18d | 2 | 0.69mi |
| 450 Warrenville Rd Lisle, IL | 1.0–2.0 | 1.0–2.0 | 1110 | $1,985 | $1.79 | 1d | 34 | 0.97mi |
| 4758 St Joseph Creek Rd Lisle, IL | 1.0 | 1.0 | 657 | $1,713 | $2.61 | 3d | 12 | 1.30mi |
| 4342 Linscott Ave Downers Grove, IL | 2.0 | 1.0 | 900 | $2,095 | $2.33 | 1d | 1 | 1.38mi |
HOA detail condo
- Monthly dues
- $358 · $4,296/yr
- Likely covers
- poolsecurityparking
- Assessments
- None detected in remarks — confirm with the listing agent.
Listing history 9 events
-
2026-06-18days on market $175,000 Active 10 DOM
-
2026-06-17days on market $175,000 Active 9 DOM
-
2026-06-16days on market $175,000 Active 8 DOM
-
2026-06-15days on market $175,000 Active 7 DOM
-
2026-06-13days on market $175,000 Active 5 DOM
-
2026-06-13days on market $175,000 Active 4 DOM
-
2026-06-10remarks 424-char remark
-
2026-06-08remarks 406-char remark
-
2026-06-08$175,000 Active 1 DOM
ⓘ Source: listings_history table (triggers on properties + properties_extension) + one-shot
backfill from property_details.listing_events for pre-trigger history.
Tax reassessment forecast IL · Partial reset (capped growth)
- Current annual tax
- $2,398 · $200/mo
- Projected year-2 tax
- $3,185 · $265/mo
- Expected delta
- +$787/yr (+$66/mo · 32.8%)
ⓘ Screening estimate from a state-policy table — verify with the county assessor before closing.
Climate risk First Street
- Flood 1/10 Low FEMA zone X (unshaded) · 0% chance over 30 yrs
- Wildfire 3/10 Moderate
- Heat 3/10 Moderate 7 d/yr ≥104°F today · 14 d/yr by 30 yrs out
- Wind 2/10 Low 0% chance of damaging wind over 30 yrs
- Air quality 3/10 Moderate 3 unhealthy d/yr today · 4 by 30 yrs out
Nearby sold comps map
Loading sold comps map…
Walkable amenities ~0.75 mi
Loading nearby amenities…
Taxation est. · year 1
- Rental income
- $21,952
- − Mortgage interest
- −$9,803
- − Property taxes
- −$2,398
- − Insurance
- −$875
- − Repairs & maintenance
- −$1,756
- − Management
- −$1,756
- − HOA
- −$4,296
- − Depreciation
- −$5,091
- Taxable loss
- −$4,022
- Est. tax savings @ 24.0%
- +$965
- After-tax cash flow
- $-274/yr
For passive investors: Depreciation is non-cash, so a rental often shows a tax loss while cash-flowing — sheltering income. Rental losses are passive: they offset passive income freely, and up to $25,000/yr can offset ordinary (W-2) income if you actively participate and your MAGI is under $100k (phasing out to $0 by $150k); unused losses carry forward. On sale, claimed depreciation is recaptured at up to 25%, and gains may owe capital-gains tax (a 1031 exchange can defer both). Figures are a year-1 estimate at your 24.0% rate — not tax advice; consult a CPA.
Schools (NCES district)
- District
- Chsd 99
- NCES district ID
- 1712570
- Math proficiency
- 46% ▼ -8.00%
- Reading proficiency
- 46% ▼ -2.00%
- Median HH income
- $83,473
- Composite
- 42.68/100
- National rank
- #3174
- State rank
- #66 of 620 in IL
Livability — Downers Grove
- Score
- 86/100
- State rank
- #24
- US rank
- #452
Category grades
Schools grade is shown separately in the Schools card above.
Census & demographics
- Census place
- Downers Grove, IL
- County
- DuPage County · 904,569 people
- City population
- 57,824
- Metro
- Chicago-Naperville-Elgin, IL-IN-WI
- Population (ZIP)
- 29,762
- Household income
- $123,197
- Rent vs Own
- Severe rent burden
- 697.0
Population outlook (DuPage County) Hauer SSP2
- Today (2025)
- 960,187 people
- By 2030
- 965,850 · +0.6%
- By 2040
- 965,812 · +0.6%
- By 2050
- 954,890 · -0.6%
- By 2075
- 910,185 · -5.2%
- By 2100
- 816,255 · -15.0%
Race, ethnicity, and origin ACS 2023
- Neighborhood character
- Predominantly White (84%)
- Race & ethnicity
- White 84% Asian 6% Two or more races 5% Hispanic / Latino 4% Black 2%
- Common ancestry
- Romanian 15% Lithuanian 3% Iranian 2%
- Foreign-born
- 8% · China, Canada, South Korea
- Languages at home
- 89% English-only · Other Indo-European 3% Russian/Polish/Slavic 2% Spanish 2%
Political lean MEDSL · DuPage
- 2024 margin
- D (+13.3) · D 55.9% · R 42.5% · Other 1.6%
- 2008→2024 swing
- +2.5pp toward D · 2008: 10.8pp · 2024: 13.3pp
- All cycles
- 2024: D+13.3 2020: D+18.1 2016: D+14.1 2012: D+1.0 2008: D+10.8
Not yet ingested
- Civics
- —
Market trends
- HPI YoY
- ▼ -361.64%
- Current HPI
- 222.0126
- Rent YoY
- ▲ 7.64%
- Metro
- Chicago-Naperville-Elgin, IL-IN-WI
- State GDP YoY
- ▲ 1.59%
- F500 in state
- 60
Industry mix (Fortune 500 HQ in IL)
| Industry | F500 HQs | Revenue |
|---|---|---|
| Insurance | 4 | $201B |
|
||
| Consumer Goods | 4 | $87B |
|
||
| Industrial Machinery | 3 | $64B |
|
||
| Healthcare | 2 | $55B |
|
||
| Retail / Pharmacy | 1 | $148B |
|
||
| Agriculture / Food | 1 | $86B |
|
||
Price history
+360.5% since first listed15 events — show timeline
- 2026-06-07 Listed $175,000 MRED as Distributed by MLS Grid
- 2020-11-26 Listing Removed — MRED as Distributed by MLS Grid
- 2020-10-05 Price Changed — MRED as Distributed by MLS Grid
- 2020-09-25 Listed — MRED as Distributed by MLS Grid
- 2015-02-19 Sold (Public Records) $65,000 Public Records
- 2015-02-06 Sold (MLS) $65,000 MRED as Distributed by MLS Grid
- 2015-01-10 Contingent — MRED as Distributed by MLS Grid
- 2015-01-03 Price Changed $68,500 MRED as Distributed by MLS Grid
- 2014-11-17 Relisted — MRED as Distributed by MLS Grid
- 2014-10-23 Contingent — MRED as Distributed by MLS Grid
- 2014-07-30 Listed $69,500 MRED as Distributed by MLS Grid
- 2006-01-19 Sold (Public Records) $115,000 Public Records
- 2000-03-02 Sold (Public Records) $63,000 Public Records
- 1991-10-08 Sold (Public Records) $38,000 Public Records
- 1988-07-26 Sold (Public Records) $38,000 Public Records
Property tax history
+3.3%/yrLatest (2024): $2,398 · +5.2% YoY. Source: county tax records.
Cash-flow waterfall
monthlySold comps — $/sqft
last 12 mo · ≤1 miLoading sold comps…