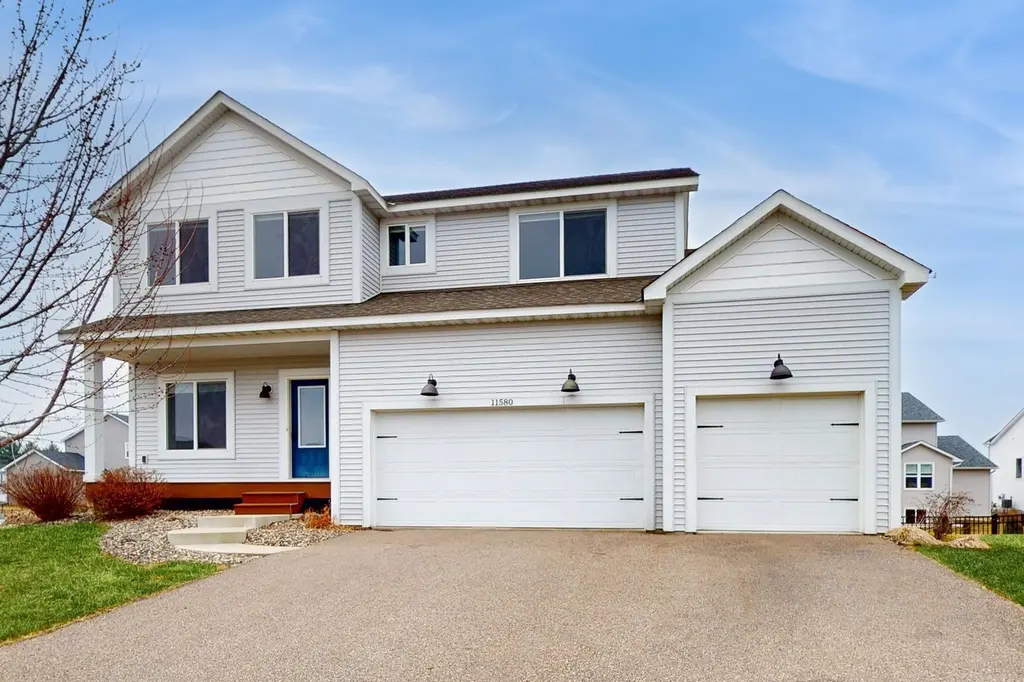
11580 33rd St N · Lake Elmo, MN
Flood risk 1/10 · Minimal
- FEMA flood zone
- X (unshaded)
- Chance of flooding over 30 yrs
- 0.0%
- Est. flood insurance / yr
- $473 – $860
Fire risk 1/10 · Minimal
- Est. fire insurance / yr
- $888 – $1,650
Heat risk 2/10 · Minimal
- Hot days now (above 101°F)
- 7 days/yr
- Hot days in 30 yrs
- 14 days/yr
Wind risk 2/10 · Minimal
- Chance of severe wind over 30 yrs
- —
Air-quality risk 3/10 · Minor
- Unhealthy air days now
- 3 days/yr
- Unhealthy air days in 30 yrs
- 3 days/yr
Risk factors via First Street. Map © Google.
Why this score? — see what drove the D- grade
The composite is a weighted blend of 9 inputs, each scored 0–100. Each bar is that input's sub-score; the figure is the points it added to the 100-point composite (weight × sub-score).
- ARV discount +15.0/15.0
- Cash flow +7.3/30.0
- Schools +5.0/10.0
- Livability +3.6/5.0
- Rent growth +2.5/5.0
- Condition / age +2.5/5.0
- 1% rule +1.5/10.0
- DSCR +1.5/10.0
- Appreciation +0.0/10.0
$614,900
🖨 Deal sheet (PDF) 📄 Offer letter ✓ Due diligence
Listing remarks
Beautiful move-in ready 5-bedroom, 4-bath home with a 3-car garage—better than new! This well-maintained property features brand new carpet in the basement and updated paint. Enjoy the convenience of four bedrooms on one level, along with an upper-level laundry room. The open-concept kitchen, dining, and living areas offer an ideal layout for both everyday living and entertaining, with a deck just off the dining room for easy outdoor access. The finished basement provides additional living space, and window treatments are already in place, features that add value and convenience compared to new construction. All of this at an exceptional value for the area. Located in a desirable neig
Key facts
- Open concept kitchen
- Window treatments
- New carpet
Tags
Property features AI
Finance
- Other: Living area reported as 3,012 sq ft; above-grade finished area 2,212
- HOA & community: Has HOA managed by Cities Management; Annual association fee of $228.36 (includes professional management)
Exterior
- Parking: Attached garage with 3 garage spaces
- Utilities: City water (connected); City sewer (connected); Natural gas
- Home design: Residential property; Two levels; Entry level: Main
- Construction: Roof age 8 years or less; Foundation: Other; Below-grade finished area and daylight basement
- Exterior features: Vinyl exterior; Deck; Lot approximately 65 x 125
Interior
- Kitchen: Kitchen on main level
- Bedrooms: 5 bedrooms (primary suite with private 3/4 bath); Four upstairs bedrooms; One main-level bedroom/office-size room
- Bathrooms: One full bathroom (upper level); Two 3/4 bathrooms (one in basement, one in primary); One half bath on the main floor
- Heating & cooling: Forced air heating; Central air conditioning
- Interior features: Finished basement with daylight/lookout windows; Deck
Neighborhood map
What this means for you Summary
Snapshot
- This is a 5-bed/4.0-bath single-family listed at $615k.
Deal economics
- At list price, monthly cash flow is $-816 ($-10k/yr) — negative.
- To cash-flow at today's rent, offer at most $471k (23.5% below list).
- To meet the 1% rule (rent ≥ 1% of price), the offer needs to be $400k (34.9% below list).
- Recommended offer: $400k (34.9% below list) — sets the bar for 1% rule.
- Cap rate 4.7% vs local median 2.6% in Lake Elmo — top-decile yield for the area; either an underpriced asset or a hidden risk that comps aren't pricing in. Stress-test before assuming the spread holds.
Location & tenants
- Location reads 72/100 on livability (#271 in MN) — a middle-class / working-renter tenant base. Strengths: crime A+, commute A+, employment A+; Watch: amenities F, cost of living F, health & safety F.
- Stillwater Area Public School District (suburban): math 53% / reading 56% proficiency, ranked #54 of 301 in MN (top 18%) — acceptable for families but not a draw, mixed tenant base, ~2y average lease; only 12% free/reduced lunch — higher-income household profile.
- Zoned schools: Lake Elmo Elementary (math 54% / reading 48%, grade C-, #406 of 857 statewide, top 48%, 653 students, 28% FRL); Oak-Land Middle School (math 50% / reading 52%, grade C, #69 of 258 statewide, top 27%, 933 students, 28% FRL); Stillwater Area High School (math 57% / reading 66%, grade B-, #39 of 471 statewide, top 9%, 2,647 students, 20% FRL).
- Market conditions: 135 active listings in the ZIP; 2 comparable units currently listed for rent nearby; 1,405 units permitted in Washington County in 2024 (121 in 5+ unit buildings).
Forward outlook
- Local home prices are declining (-3.0%/yr); year-one equity from $4k of loan paydown is wiped out by about $18k of value loss. Plan a longer hold.
- Washington County population projected at +16% by 2050 — long-run rental-demand tailwind backs the buy-and-hold thesis.
Negotiation context
- It's been on market 28 days — a 2% lower offer ($606k) is reasonable based on typical stale-listing flexibility.
- 5 sale attempts since 8y ago with the ask held roughly flat each time — persistent listings suggest the price (not the market) is what's stuck; bring a comps-based counter.
- Current owner paid $406k; list at $615k implies a 52% gain — meaningful room to come down on a strong offer.
Questions for the listing agent
- What do current leases actually rent for vs. the listed asking? Can we see a recent rent roll and the last 12 months of T-12 income?
- What does the HOA fee cover, when was the last increase, and are there any pending special assessments or reserve-fund shortfalls?
- Is there a deadline driving the sale (1031 exchange, divorce, estate, relocation)? That informs how much negotiation room exists.
- The area grade is low — what's the realistic commute time and amenity access for the typical tenant pool here? Any planned neighborhood developments (good or bad) we should know about?
- What's the average days-on-market for RENTAL listings here right now (not sales)? A rising rental-DOM trend means longer vacancies and softer asking-rent achievability than the comps imply.
- What's the recent tenant-quality profile in this submarket — average credit score on applications, eviction rate, late-payment / NSF rate, and stable-employment percentage? A property-management company in the area should have these aggregated.
- How much new for-sale + rental construction is in the pipeline within 1–3 miles? Heavy new supply typically softens prices + rents 12–24 months out; constrained supply supports both.
Investment metrics
- 1% rule
- 0.65% ✗
- Cap rate
- 4.70%
- Cash-on-cash
- -5.69%
- DSCR
- 0.75
- GRM
- 12.8
CMA / ARV
- ARV (median comp)
- $845,765
- List price
- $614,900
- Delta
- -27.30%
- Verdict
- UNDERPRICED
- Comps
- 3 within 1.0 mi
Show comp detail 1 sale within ~0.75 mi
| Address | Dist | Beds/Ba | Sqft | Sold | Price | $/sf | Match |
|---|---|---|---|---|---|---|---|
| 11592 Sunflower Ln N | 0.68mi | 4/3.0 (-1) | 2,850 (-1%) | 19mo | $825,980 | $290 | 42 |
Match score weights: distance 35% · size 25% · config 20% · recency 20%. Top-matched comps best support the ARV.
Projected returns pro-forma
-3.0% appreciation · 3.0% rent growth · sell at horizon
- IRR
- -26.1%
- Equity multiple
- 0.12×
- Total profit
- $-151,739
- Equity at exit
- $91,684
- IRR
- -23.0%
- Equity multiple
- -0.16×
- Total profit
- $-199,515
- Equity at exit
- $53,165
Cash invested: $172,172 (down + closing). Projections, not guarantees.
Landlord ↔ Tenant lean methodology
- Overall (STATE)
- 46 Balanced
- State Minnesota
- 46 Balanced · D+2
- County
- — inherits STATE
- City
- — inherits STATE
ZIP-level market 55042
- Active inventory
- 135
- Price-to-rent
- 12.8×
Monthly cashflow live
- Estimated rent
- $4,000 medium interval (Pro) →
- Mortgage (P&I)
- −$3,225
- Tax from tax record
- −$476 /mo · $5,718/yr
- Insurance
- −$256
- HOA
- −$19
- Vacancy / Maint / Mgmt
- −$840
- Net cashflow
- $-816
Break-even live
Sensitivity live
| Price | -10% $-468 | -5% $-642 | +0% $-816 | +5% $-990 | +10% $-1,164 |
|---|---|---|---|---|---|
| Rent | -10% $-1,132 | -5% $-974 | +0% $-816 | +5% $-658 | +10% $-500 |
| Rate | -1.0pp $-507 | -0.5pp $-660 | base $-816 | +0.5pp $-976 | +1.0pp $-1,138 |
UW: 25.0% down · 7.5% · 30yr · 1.5% tax · 5.0% vac · 8.0% maint · 8.0% mgmt
Financing live
Cash to close
- Down payment
- $153,725
- Closing costs
- $18,447
- Reserves months
- —
- Total cash needed
- —
Loan-product check · same deal, 3 products live
Conventional
25% down · 7.5% · 30yr
- Down + closing
- —
- Monthly P&I
- —
- Monthly cashflow
- —
- DSCR
- —
- Eligible?
- —
Personal DTI + credit; lowest rate.
DSCR
20% down · 8.5% · 30yr
- Down + closing
- —
- Monthly P&I
- —
- Monthly cashflow
- —
- DSCR
- —
- Eligible?
- —
No personal income docs; deal must DSCR.
Hard money
10% down · 12.0% · 12mo
- Down + closing
- —
- Monthly P&I
- —
- Monthly cashflow
- —
- DSCR
- —
- Eligible?
- —
Short-term bridge; refi at stabilization.
Rent comps 2 comps
| Address | Beds | Baths | Sqft | Rent | $/sqft | DOM | Units | Dist |
|---|---|---|---|---|---|---|---|---|
| 3472 Knightsbridge Trl N Lake Elmo, MN | 4.0 | 2.5 | 2022 | $4,000 | $1.98 | 45d | 1 | 0.76mi |
| 10974 37th St N Lake Elmo, MN | 4.0 | 3.0 | 2299 | $4,000 | $1.74 | 45d | 1 | 0.80mi |
HOA detail
- Monthly dues
- $19 · $228/yr
Listing history 26 events
-
2026-06-07statusdays on market $614,900 Pending 28 DOM
-
2026-06-04days on market $614,900 Contingent - Inspection 27 DOM
-
2026-06-03days on market $614,900 Contingent - Inspection 26 DOM
-
2026-06-02days on market $614,900 Contingent - Inspection 25 DOM
-
2026-06-01days on market $614,900 Contingent - Inspection 24 DOM
-
2026-06-01status $614,900 Contingent - Inspection 23 DOM
-
2026-05-31days on market $614,900 Active 23 DOM
-
2026-05-15price $619,900 863-char remark
-
2026-05-08$629,900 Active 863-char remark
-
2025-05-29historical
-
2025-05-12price $589,000
-
2025-04-24price $599,000
-
2025-04-11$619,000 Active
-
2019-02-28historical
-
2019-01-25price $2,995
-
2018-12-27price $3,250
-
2018-10-27$3,295 Active
-
2018-10-26soldstatus $405,500 Sold
-
2018-09-23status Pending
-
2018-09-13price $398,000
-
2018-08-20price $395,000
-
2018-07-31$396,000 Active
-
2018-07-29historical
-
2018-07-02price $389,000
-
2018-06-05price $400,000
-
2018-05-23$411,900 Active
ⓘ Source: listings_history table (triggers on properties + properties_extension) + one-shot
backfill from property_details.listing_events for pre-trigger history.
Tax reassessment forecast MN · Partial reset (capped growth)
- Current annual tax
- $5,718 · $476/mo
- Projected year-2 tax
- $6,302 · $525/mo
- Expected delta
- +$584/yr (+$49/mo · 10.2%)
ⓘ Screening estimate from a state-policy table — verify with the county assessor before closing.
Climate risk First Street
- Flood 1/10 Low FEMA zone X (unshaded) · 0% chance over 30 yrs
- Wildfire 1/10 Low
- Heat 2/10 Low 7 d/yr ≥101°F today · 14 d/yr by 30 yrs out
- Wind 2/10 Low
- Air quality 3/10 Moderate 3 unhealthy d/yr today · 3 by 30 yrs out
Nearby sold comps map
Loading sold comps map…
Walkable amenities ~0.75 mi
Loading nearby amenities…
Taxation est. · year 1
- Rental income
- $48,000
- − Mortgage interest
- −$34,444
- − Property taxes
- −$5,718
- − Insurance
- −$3,074
- − Repairs & maintenance
- −$3,840
- − Management
- −$3,840
- − HOA
- −$228
- − Depreciation
- −$17,888
- Taxable loss
- −$21,032
- Est. tax savings @ 24.0%
- +$5,048
- After-tax cash flow
- $-4,748/yr
For passive investors: Depreciation is non-cash, so a rental often shows a tax loss while cash-flowing — sheltering income. Rental losses are passive: they offset passive income freely, and up to $25,000/yr can offset ordinary (W-2) income if you actively participate and your MAGI is under $100k (phasing out to $0 by $150k); unused losses carry forward. On sale, claimed depreciation is recaptured at up to 25%, and gains may owe capital-gains tax (a 1031 exchange can defer both). Figures are a year-1 estimate at your 24.0% rate — not tax advice; consult a CPA.
Schools (NCES district)
- District
- Stillwater Area Public School District
- NCES district ID
- 2738190
- Math proficiency
- 53% ▼ -11.00%
- Reading proficiency
- 56% ▼ -12.00%
- Median HH income
- $84,438
- Composite
- 49.8/100
- National rank
- #1954
- State rank
- #54 of 301 in MN
Livability — Lake Elmo
- Score
- 72/100
- State rank
- #271
- US rank
- #5860
Category grades
Schools grade is shown separately in the Schools card above.
Census & demographics
- Census place
- Lake Elmo, MN
- City population
- 13,156
- Population (ZIP)
- 13,156
Population outlook (Washington County) Hauer SSP2
- Today (2025)
- 278,554 people
- By 2030
- 290,465 · +4.3%
- By 2040
- 310,014 · +11.3%
- By 2050
- 324,118 · +16.4%
- By 2075
- 362,697 · +30.2%
- By 2100
- 381,491 · +37.0%
Race, ethnicity, and origin ACS 2023
- Neighborhood character
- Predominantly White (86%)
- Race & ethnicity
- White 86% Two or more races 4% Hispanic / Latino 4% Asian 4% Black 1%
- Common ancestry
- Portuguese 7% Lithuanian 5% Romanian 3%
- Foreign-born
- 5% · Canada, China
- Languages at home
- 93% English-only · Spanish 2% Other Asian/Pacific 2% German/W. Germanic 1%
Political lean MEDSL · Washington
- 2024 margin
- Lean D (+8.9) · D 53.5% · R 44.6% · Other 1.9%
- 2008→2024 swing
- +4.6pp toward D · 2008: 4.3pp · 2024: 8.9pp
- All cycles
- 2024: D+8.9 2020: D+9.2 2016: D+1.9 2012: D+0.8 2008: D+4.3
Not yet ingested
- Civics
- —
Market trends
- HPI YoY
- ▼ -155.91%
- Current HPI
- 224.0264
- Rent YoY
- —
- Metro
- —
- State GDP YoY
- ▲ 2.41%
- F500 in state
- 34
Industry mix (Fortune 500 HQ in MN)
| Industry | F500 HQs | Revenue |
|---|---|---|
| Healthcare | 2 | $407B |
|
||
| Retail | 2 | $150B |
|
||
| Consumer Goods | 2 | $32B |
|
||
| Industrial Machinery | 2 | $6B |
|
||
| Agriculture | 1 | $40B |
|
||
| Healthcare / Medical Devices | 1 | $32B |
|
||
Price history
+49.3% since first listed22 events — show timeline
- 2026-06-05 Pending — NORTHSTARMLS as Distributed by MLS Grid
- 2026-05-31 Contingent — NORTHSTARMLS as Distributed by MLS Grid
- 2026-05-29 Price Changed $614,900 NORTHSTARMLS as Distributed by MLS Grid
- 2026-05-15 Price Changed $619,900 NORTHSTARMLS as Distributed by MLS Grid
- 2026-05-08 Listed $629,900 NORTHSTARMLS as Distributed by MLS Grid
- 2025-05-29 Listing Removed — NORTHSTARMLS as Distributed by MLS Grid
- 2025-05-12 Price Changed $589,000 NORTHSTARMLS as Distributed by MLS Grid
- 2025-04-24 Price Changed $599,000 NORTHSTARMLS as Distributed by MLS Grid
- 2025-04-11 Listed $619,000 NORTHSTARMLS as Distributed by MLS Grid
- 2019-02-28 Listing Removed — NORTHSTARMLS as Distributed by MLS Grid
- 2019-01-25 Price Changed $2,995 NORTHSTARMLS as Distributed by MLS Grid
- 2018-12-27 Price Changed $3,250 NORTHSTARMLS as Distributed by MLS Grid
- 2018-10-27 Listed $3,295 NORTHSTARMLS as Distributed by MLS Grid
- 2018-10-26 Sold (MLS) $405,500 NORTHSTARMLS as Distributed by MLS Grid
- 2018-09-23 Pending — NORTHSTARMLS as Distributed by MLS Grid
- 2018-09-13 Price Changed $398,000 NORTHSTARMLS as Distributed by MLS Grid
- 2018-08-20 Price Changed $395,000 NORTHSTARMLS as Distributed by MLS Grid
- 2018-07-31 Listed $396,000 NORTHSTARMLS as Distributed by MLS Grid
- 2018-07-29 Listing Removed — NORTHSTARMLS as Distributed by MLS Grid
- 2018-07-02 Price Changed $389,000 NORTHSTARMLS as Distributed by MLS Grid
- 2018-06-05 Price Changed $400,000 NORTHSTARMLS as Distributed by MLS Grid
- 2018-05-23 Listed $411,900 NORTHSTARMLS as Distributed by MLS Grid
Property tax history
+82.7%/yrLatest (2025): $5,718 · +12.1% YoY. Source: county tax records.
Cash-flow waterfall
monthlySold comps — $/sqft
last 12 mo · ≤1 miLoading sold comps…