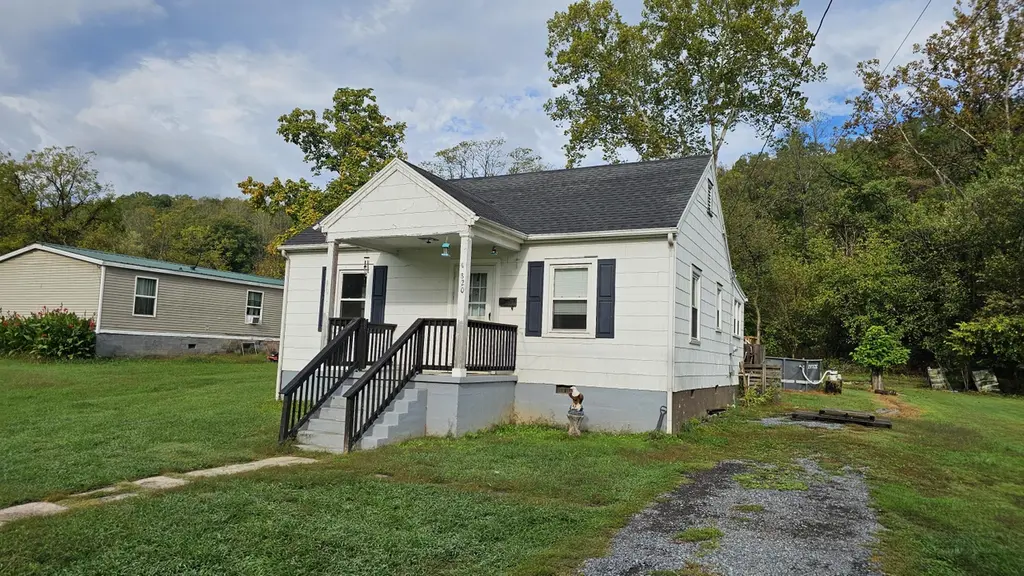
320 Catawba St · Glasgow, VA
Flood risk No data
- FEMA flood zone
- —
- Chance of flooding over 30 yrs
- —
- Est. flood insurance / yr
- —
Fire risk No data
- Est. fire insurance / yr
- —
Heat risk No data
- Hot days now (above threshold)
- —
- Hot days in 30 yrs
- —
Wind risk No data
- Chance of severe wind over 30 yrs
- —
Air-quality risk No data
- Unhealthy air days now
- —
- Unhealthy air days in 30 yrs
- —
Risk factors via First Street. Map © Google.
Why this score? — see what drove the A- grade
The composite is a weighted blend of 9 inputs, each scored 0–100. Each bar is that input's sub-score; the figure is the points it added to the 100-point composite (weight × sub-score).
- Cash flow +30.0/30.0
- ARV discount +15.0/15.0
- 1% rule +10.0/10.0
- DSCR +10.0/10.0
- Appreciation +6.0/10.0
- Schools +4.7/10.0
- Livability +3.0/5.0
- Rent growth +2.5/5.0
- Condition / age +2.5/5.0
$79,700
🖨 Deal sheet (PDF) 📄 Offer letter ✓ Due diligence
Listing remarks
This 2-bedroom, 1-bath cottage-style home features a newly replaced roof, windows and appliances. . Situated on a 2 lots with an outbuilding for storage . It's offered at a great price, making it an excellent option for a starter home or an investment property. Add your own remodeling touches to this charming home.
Key facts
- Newly replaced roof
- 7,841 sq ft lot
- Built 1948
Tags
Property features AI
Exterior
- Utilities: Public water; Public sewer
- Home design: Residential single-family home
- Construction: Asbestos construction material
- Exterior features: Shingle roof; State road frontage
Interior
- Flooring: Laminate flooring; Wood flooring
- Bathrooms: 1 full bathroom
- Heating & cooling: Has cooling (no central/ac specified)
- Interior features: Electric water heater; Crawl space basement
Neighborhood map
What this means for you Summary
Snapshot
- This is a 2-bed/1.0-bath single-family listed at $80k.
Deal economics
- At list price, monthly cash flow is $935 ($11k/yr) — positive.
- The deal already cash-flows at list — no discount required.
- Meets the 1% rule at list price ($2k rent vs $80k).
Location & tenants
- Location reads 59/100 on livability (#471 in VA) — a working-class tenant base; expect higher turnover. Strengths: crime A+, cost of living A+, housing A+; Watch: health & safety C-, amenities F, commute F.
- Rockbridge County Public School District (town): math 43% / reading 67% proficiency, ranked #80 of 131 in VA (top 61%) — acceptable for families but not a draw, mixed tenant base, ~2y average lease.
- Zoned schools: Natural Bridge Elementary (math 52% / reading 57%, grade C, #650 of 1,108 statewide, top 62%, 221 students, 68% FRL); Maury River Middle (math 38% / reading 63%, grade C, #226 of 342 statewide, top 67%, 502 students, 70% FRL); Rockbridge County High (math 52% / reading 82%, grade B, #185 of 319 statewide, top 61%, 994 students, 66% FRL) — zoned schools average 68% FRL vs 37% district-wide (31 pts higher); higher-poverty schools than district average — tighter screening recommended.
- Market conditions: 14 active listings in the ZIP; 85 units permitted in Rockbridge County in 2024 (0 in 5+ unit buildings).
Forward outlook
- In year one you build about $2k of equity ($551 loan paydown + $2k appreciation (1.9% local appreciation)).
- Rockbridge County population projected at -11% by 2050 — secular population decline; favor cash flow + early exit over multi-decade hold.
- At projected returns (1.9% appreciation + 3.0% rent growth), your $22k cash investment doubles in ~2 years — after that, you're playing with house money.
Negotiation context
- Only 1 days on market — expect competitive offers; lowballing is unlikely to land.
- Current owner paid $56k; 44% above their basis — modest negotiation headroom, anchor on the comps not their cost.
Risks & watch-outs
- Watch-outs: built in 1948 — expect roof / HVAC / electrical / plumbing capex.
Questions for the listing agent
- Built in 1948 — when were the roof, HVAC, electrical panel, plumbing, and water heater last replaced?
- Is there a deadline driving the sale (1031 exchange, divorce, estate, relocation)? That informs how much negotiation room exists.
- Schools are F-rated, which usually means shorter tenancies and higher turnover. Who's the typical renter profile here, and what's been the actual vacancy rate?
- What's the average days-on-market for RENTAL listings here right now (not sales)? A rising rental-DOM trend means longer vacancies and softer asking-rent achievability than the comps imply.
- What's the recent tenant-quality profile in this submarket — average credit score on applications, eviction rate, late-payment / NSF rate, and stable-employment percentage? A property-management company in the area should have these aggregated.
- How much new for-sale + rental construction is in the pipeline within 1–3 miles? Heavy new supply typically softens prices + rents 12–24 months out; constrained supply supports both.
Investment metrics
- 1% rule
- 2.25% ✓
- Cap rate
- 20.37%
- Cash-on-cash
- 50.28%
- DSCR
- 3.24
- GRM
- 3.7
CMA / ARV
- ARV (on-the-fly)
- $111,104
- Comps found
- 3
Show comp detail 3 sales within ~0.75 mi
| Address | Dist | Beds/Ba | Sqft | Sold | Price | $/sf | Match |
|---|---|---|---|---|---|---|---|
| 1611 Blue Ridge Rd | 0.50mi | 2/1.0 | 884 (+2%) | 7mo | $159,900 | $181 | 68 |
| 619 Catawba St | 0.37mi | 2/1.0 | 816 (-6%) | 13mo | $104,410 | $128 | 62 |
| 612 Gordon St | 0.57mi | 2/1.0 | 840 (-3%) | 12mo | $86,000 | $102 | 58 |
Match score weights: distance 35% · size 25% · config 20% · recency 20%. Top-matched comps best support the ARV.
Projected returns pro-forma
1.9% appreciation · 3.0% rent growth · sell at horizon
- IRR
- 54.1%
- Equity multiple
- 3.90×
- Total profit
- $64,625
- Equity at exit
- $31,028
- IRR
- 54.7%
- Equity multiple
- 7.83×
- Total profit
- $152,466
- Equity at exit
- $44,370
Cash invested: $22,316 (down + closing). Projections, not guarantees.
Landlord ↔ Tenant lean methodology
- Overall (STATE)
- 55 Moderately Landlord-Leaning
- State Virginia
- 55 Moderately Landlord-Leaning · D+2
- County
- — inherits STATE
- City
- — inherits STATE
ZIP-level market 24555
- Home prices YoY
- 1.1%
- Active inventory
- 14
- Price-to-rent
- 3.7×
Monthly cashflow live
- Estimated rent
- $1,795 medium interval (Pro) →
- Mortgage (P&I)
- −$418
- Tax from tax record
- −$32 /mo · $380/yr
- Insurance
- −$33
- HOA
- −$0
- Vacancy / Maint / Mgmt
- −$377
- Net cashflow
- $935
Break-even live
Sensitivity live
| Price | -10% $980 | -5% $958 | +0% $935 | +5% $913 | +10% $890 |
|---|---|---|---|---|---|
| Rent | -10% $793 | -5% $864 | +0% $935 | +5% $1,006 | +10% $1,077 |
| Rate | -1.0pp $975 | -0.5pp $955 | base $935 | +0.5pp $914 | +1.0pp $893 |
UW: 25.0% down · 7.5% · 30yr · 1.5% tax · 5.0% vac · 8.0% maint · 8.0% mgmt
Financing live
Cash to close
- Down payment
- $19,925
- Closing costs
- $2,391
- Reserves months
- —
- Total cash needed
- —
Loan-product check · same deal, 3 products live
Conventional
25% down · 7.5% · 30yr
- Down + closing
- —
- Monthly P&I
- —
- Monthly cashflow
- —
- DSCR
- —
- Eligible?
- —
Personal DTI + credit; lowest rate.
DSCR
20% down · 8.5% · 30yr
- Down + closing
- —
- Monthly P&I
- —
- Monthly cashflow
- —
- DSCR
- —
- Eligible?
- —
No personal income docs; deal must DSCR.
Hard money
10% down · 12.0% · 12mo
- Down + closing
- —
- Monthly P&I
- —
- Monthly cashflow
- —
- DSCR
- —
- Eligible?
- —
Short-term bridge; refi at stabilization.
Listing history 3 events
-
2026-05-28$79,700 Active
-
2025-10-27price $85,000
-
2008-12-19soldstatus $55,500
ⓘ Source: listings_history table (triggers on properties + properties_extension) + one-shot
backfill from property_details.listing_events for pre-trigger history.
Tax reassessment forecast VA · Resets to sale price
- Current annual tax
- $380 · $32/mo
- Projected year-2 tax
- $654 · $54/mo
- Expected delta
- +$273/yr (+$23/mo · 71.9%)
ⓘ Screening estimate from a state-policy table — verify with the county assessor before closing.
Nearby sold comps map
Loading sold comps map…
Walkable amenities ~0.75 mi
Loading nearby amenities…
Taxation est. · year 1
- Rental income
- $21,539
- − Mortgage interest
- −$4,464
- − Property taxes
- −$380
- − Insurance
- −$398
- − Repairs & maintenance
- −$1,723
- − Management
- −$1,723
- − Depreciation
- −$2,319
- Taxable income
- $10,531
- Est. tax owed @ 24.0%
- −$2,527
- After-tax cash flow
- $8,694/yr
For passive investors: Depreciation is non-cash, so a rental often shows a tax loss while cash-flowing — sheltering income. Rental losses are passive: they offset passive income freely, and up to $25,000/yr can offset ordinary (W-2) income if you actively participate and your MAGI is under $100k (phasing out to $0 by $150k); unused losses carry forward. On sale, claimed depreciation is recaptured at up to 25%, and gains may owe capital-gains tax (a 1031 exchange can defer both). Figures are a year-1 estimate at your 24.0% rate — not tax advice; consult a CPA.
Schools (NCES district)
- District
- Rockbridge County Public School District
- NCES district ID
- 5103370
- Math proficiency
- 43% ▼ -41.00%
- Reading proficiency
- 67% ▼ -12.00%
- Median HH income
- $48,021
- Composite
- 46.65/100
- National rank
- #2408
- State rank
- #80 of 131 in VA
Livability — Glasgow
- Score
- 59/100
- State rank
- #471
- US rank
- #20232
Category grades
Schools grade is shown separately in the Schools card above.
Census & demographics
- Census place
- Glasgow, VA
- Population (ZIP)
- 2,220
Population outlook (Rockbridge County) Hauer SSP2
- Today (2025)
- 22,549 people
- By 2030
- 22,381 · -0.7%
- By 2040
- 21,488 · -4.7%
- By 2050
- 20,054 · -11.1%
- By 2075
- 16,228 · -28.0%
- By 2100
- 11,598 · -48.6%
Race, ethnicity, and origin ACS 2023
- Neighborhood character
- Predominantly White (80%)
- Race & ethnicity
- White 80% Black 13% Two or more races 7%
- Common ancestry
- Serbian 5% Lithuanian 4% Italian 2%
- Foreign-born
- 0% · Canada
- Languages at home
- 96% English-only · Spanish 4%
Political lean MEDSL · Rockbridge
- 2024 margin
- Solid R (+33.8) · D 32.6% · R 66.4%
- 2008→2024 swing
- -20.2pp toward R · 2008: -13.6pp · 2024: -33.8pp
- All cycles
- 2024: R+33.8 2020: R+32.4 2016: R+29.6 2012: R+17.8 2008: R+13.6
Not yet ingested
- Civics
- —
Market trends
- HPI YoY
- ▲ 1.90%
- Current HPI
- 176.4084
- Rent YoY
- —
- Metro
- —
- State GDP YoY
- ▲ 2.40%
- F500 in state
- 50
Industry mix (Fortune 500 HQ in VA)
| Industry | F500 HQs | Revenue |
|---|---|---|
| Aerospace / Defense | 4 | $236B |
|
||
| Technology / Defense | 3 | $32B |
|
||
| Financial Services | 2 | $176B |
|
||
| Utilities | 2 | $27B |
|
||
| Insurance | 2 | $25B |
|
||
| Technology | 2 | $15B |
|
||
Price history
+43.6% since first listed3 events — show timeline
- 2026-05-28 Listed $79,700 RHR
- 2025-10-27 Price Changed $85,000 RHR
- 2008-12-19 Sold (Public Records) $55,500 Public Records
Property tax history
+1.5%/yrLatest (2017): $380 · -5.9% YoY. Source: county tax records.
Cash-flow waterfall
monthlySold comps — $/sqft
last 12 mo · ≤1 miLoading sold comps…