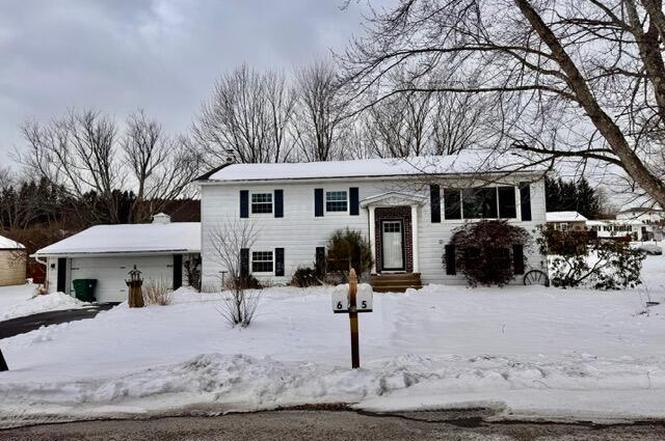
5 Karin Dr · Mehoopany, PA
Flood risk 8/10 · Major
- FEMA flood zone
- X (unshaded)
- Chance of flooding over 30 yrs
- 0.99%
- Est. flood insurance / yr
- $473 – $860
Fire risk 2/10 · Minimal
- Est. fire insurance / yr
- $511 – $949
Heat risk 3/10 · Minor
- Hot days now (above 94°F)
- 7 days/yr
- Hot days in 30 yrs
- 15 days/yr
Wind risk 3/10 · Minor
- Chance of severe wind over 30 yrs
- 4.0%
Air-quality risk 2/10 · Minimal
- Unhealthy air days now
- 0 days/yr
- Unhealthy air days in 30 yrs
- 1 days/yr
Risk factors via First Street. Map © Google.
Why this score? — see what drove the C- grade
The composite is a weighted blend of 9 inputs, each scored 0–100. Each bar is that input's sub-score; the figure is the points it added to the 100-point composite (weight × sub-score).
- ARV discount +14.8/15.0
- Cash flow +14.4/30.0
- DSCR +4.4/10.0
- Appreciation +3.7/10.0
- Schools +3.1/10.0
- 1% rule +2.9/10.0
- Rent growth +2.5/5.0
- Livability +2.5/5.0
- Condition / age +2.5/5.0
$218,900
🖨 Deal sheet 📄 Offer letter ✓ Due diligence
Listing remarks MLS
2LOT SIZE C, SUBDIVISION/DEV WASHINGTON PARK, INSULATION STD, ACI, SWI, 1OTHER RM NAME REC ROOM, 1OTHER RM LEVEL L, 1OTHER RM SIZE 16X20, LOT DESCRIPTION CL, 1EXTERIOR DIMEN 0, SCREENED PORCH/FENCED BACK YARD/ROOF NEW IN 96/, ATTIC PULL DOWN STORAGE SPACE/SPACIOUS, WELL KEPT HOME, IN GREAT LOCATION.
Key facts
- Flexible space
- Bright living area
- Bi-level residence
Tags
Neighborhood map
What this means for you Summary
Snapshot
- This is a 4-bed/1.5-bath single-family listed at $219k.
Deal economics
- At list price, monthly cash flow is $-11 ($-137/yr) — negative.
- To cash-flow at today's rent, offer at most $217k (0.9% below list).
- To meet the 1% rule (rent ≥ 1% of price), the offer needs to be $173k (20.7% below list).
- Recommended offer: $173k (20.7% below list) — sets the bar for 1% rule.
Location & tenants
- Location reads: area grade C — affects rentability + tenant quality, not the cash-flow math above.
- Tunkhannock Area SD (town): math 29% / reading 43% proficiency, ranked #397 of 539 in PA (top 74%) — families likely to look elsewhere, expect single-tenant / working-renter base with shorter leases.
- Market conditions: 58 active listings in the ZIP; 33 units permitted in Wyoming County in 2024 (0 in 5+ unit buildings).
Forward outlook
- Local home prices are declining (-2.6%/yr); year-one equity from $2k of loan paydown is wiped out by about $6k of value loss. Plan a longer hold.
- Wyoming County population projected at -23% by 2050 — secular population decline; favor cash flow + early exit over multi-decade hold.
Negotiation context
- It's been on market 59 days — a 3% lower offer ($212k) is reasonable based on typical stale-listing flexibility.
- 4 sale attempts with the ask held roughly flat each time — persistent listings suggest the price (not the market) is what's stuck; bring a comps-based counter.
- Current owner paid $88k; list at $219k implies a 149% gain — meaningful room to come down on a strong offer.
Risks & watch-outs
- Watch-outs: flood insurance adds $56/mo.
- Climate carrying-cost: severe flood risk — expect insurance premiums to compound above CPI over the hold.
Questions for the listing agent
- What do current leases actually rent for vs. the listed asking? Can we see a recent rent roll and the last 12 months of T-12 income?
- It's been on market 59 days. Have you received any prior offers? Is the seller open to a 21% concession, seller financing, or rate buy-down credit?
- Built in 1975 — when were the roof, HVAC, electrical panel, plumbing, and water heater last replaced?
- What's the actual annual flood-insurance premium (NFIP or private), and is the property in a SFHA with mandatory coverage?
- Is there a deadline driving the sale (1031 exchange, divorce, estate, relocation)? That informs how much negotiation room exists.
- What's the average days-on-market for RENTAL listings here right now (not sales)? A rising rental-DOM trend means longer vacancies and softer asking-rent achievability than the comps imply.
- What's the recent tenant-quality profile in this submarket — average credit score on applications, eviction rate, late-payment / NSF rate, and stable-employment percentage? A property-management company in the area should have these aggregated.
- How much new for-sale + rental construction is in the pipeline within 1–3 miles? Heavy new supply typically softens prices + rents 12–24 months out; constrained supply supports both.
Investment metrics
- 1% rule
- 0.79% ✗
- Cap rate
- 6.54%
- Cash-on-cash
- 0.86%
- DSCR
- 1.04
- GRM
- 10.5
CMA / ARV
- ARV (on-the-fly)
- $261,280
- Comps found
- 3
Show comp detail 3 sales within ~0.75 mi
| Address | Dist | Beds/Ba | Sqft | Sold | Price | $/sf | Match |
|---|---|---|---|---|---|---|---|
| 5 Karin Dr | 0.00mi | 4/1.5 | 1,840 (0%) | 1mo | $215,900 | $117 | 100 |
| 14 Karin Dr | 0.07mi | 3/2.5 (-1) | 1,787 (-3%) | 2mo | $285,000 | $159 | 81 |
| 17 Vosburg Rd | 0.67mi | 3/1.5 (-1) | 2,073 (+13%) | 21mo | $294,000 | $142 | 25 |
Match score weights: distance 35% · size 25% · config 20% · recency 20%. Top-matched comps best support the ARV.
Projected returns pro-forma
-2.57% appreciation · 3.0% rent growth · sell at horizon
- IRR
- -14.1%
- Equity multiple
- 0.47×
- Total profit
- $-32,284
- Equity at exit
- $36,858
- IRR
- -6.0%
- Equity multiple
- 0.58×
- Total profit
- $-25,831
- Equity at exit
- $26,254
Cash invested: $61,292 (down + closing). Projections, not guarantees.
Landlord ↔ Tenant lean methodology
- Overall (STATE)
- 62 Landlord-Friendly
- State Pennsylvania
- 62 Landlord-Friendly · EVEN
- County
- — inherits STATE
- City
- — inherits STATE
ZIP-level market 18657
- Home prices YoY
- -1.0%
- Active inventory
- 58
- Price-to-rent
- 10.5×
Monthly cashflow live
- Estimated rent
- $1,735 medium interval (Pro) →
- Mortgage (P&I)
- −$1,148
- Tax from tax record
- −$87 /mo · $1,047/yr
- Insurance
- −$91
- Flood insurance flood zone
- −$56 /mo · $666/yr
- HOA
- −$0
- Vacancy / Maint / Mgmt
- −$364
- Net cashflow
- $-11
Break-even live
UW: 25.0% down · 7.5% · 30yr · 1.5% tax · 5.0% vac · 8.0% maint · 8.0% mgmt
Financing live
Cash to close
- Down payment
- $54,725
- Closing costs
- $6,567
- Reserves months
- —
- Total cash needed
- —
Loan-product check · same deal, 3 products live
Conventional
25% down · 7.5% · 30yr
- Down + closing
- —
- Monthly P&I
- —
- Monthly cashflow
- —
- DSCR
- —
- Eligible?
- —
Personal DTI + credit; lowest rate.
DSCR
20% down · 8.5% · 30yr
- Down + closing
- —
- Monthly P&I
- —
- Monthly cashflow
- —
- DSCR
- —
- Eligible?
- —
No personal income docs; deal must DSCR.
Hard money
10% down · 12.0% · 12mo
- Down + closing
- —
- Monthly P&I
- —
- Monthly cashflow
- —
- DSCR
- —
- Eligible?
- —
Short-term bridge; refi at stabilization.
Listing history 9 events
-
2026-04-27status Pending
-
2026-03-05status Active
-
2026-02-26status Pending
-
2026-02-16$218,900 Active
-
2025-12-19status Active
-
2025-09-15price $233,000
-
2025-08-08$240,000 Active
-
1999-06-01soldstatus $88,000 300-char remark
Show marketing remark (300 chars)
2LOT SIZE C, SUBDIVISION/DEV WASHINGTON PARK, INSULATION STD, ACI, SWI, 1OTHER RM NAME REC ROOM, 1OTHER RM LEVEL L, 1OTHER RM SIZE 16X20, LOT DESCRIPTION CL, 1EXTERIOR DIMEN 0, SCREENED PORCH/FENCED BACK YARD/ROOF NEW IN 96/, ATTIC PULL DOWN STORAGE SPACE/SPACIOUS, WELL KEPT HOME, IN GREAT LOCATION.
-
1999-05-26soldstatus $88,000
ⓘ Source: listings_history table (triggers on properties + properties_extension) + one-shot
backfill from property_details.listing_events for pre-trigger history.
Tax reassessment forecast PA · Partial reset (capped growth)
- Current annual tax
- $1,047 · $87/mo
- Projected year-2 tax
- $2,253 · $188/mo
- Expected delta
- +$1,206/yr (+$100/mo · 115.1%)
ⓘ Screening estimate from a state-policy table — verify with the county assessor before closing.
Climate risk First Street
- Flood 8/10 Severe FEMA zone X (unshaded) · 99% chance over 30 yrs
- Wildfire 2/10 Low
- Heat 3/10 Moderate 7 d/yr ≥94°F today · 15 d/yr by 30 yrs out
- Wind 3/10 Moderate 4% chance of damaging wind over 30 yrs
- Air quality 2/10 Low 0 unhealthy d/yr today · 1 by 30 yrs out
Nearby sold comps map
Loading sold comps map…
Walkable amenities ~0.75 mi
Loading nearby amenities…
Taxation est. · year 1
- Rental income
- $20,819
- − Mortgage interest
- −$12,262
- − Property taxes
- −$1,047
- − Insurance
- −$1,761
- − Repairs & maintenance
- −$1,666
- − Management
- −$1,666
- − Depreciation
- −$6,368
- Taxable loss
- −$3,950
- Est. tax savings @ 24.0%
- +$948
- After-tax cash flow
- $812/yr
For passive investors: Depreciation is non-cash, so a rental often shows a tax loss while cash-flowing — sheltering income. Rental losses are passive: they offset passive income freely, and up to $25,000/yr can offset ordinary (W-2) income if you actively participate and your MAGI is under $100k (phasing out to $0 by $150k); unused losses carry forward. On sale, claimed depreciation is recaptured at up to 25%, and gains may owe capital-gains tax (a 1031 exchange can defer both). Figures are a year-1 estimate at your 24.0% rate — not tax advice; consult a CPA.
Schools (NCES district)
- District
- Tunkhannock Area SD
- NCES district ID
- 4223850
- Math proficiency
- 29% ▼ -9.00%
- Reading proficiency
- 43% ▼ -18.00%
- Median HH income
- $51,545
- Composite
- 31.27/100
- National rank
- #6022
- State rank
- #397 of 539 in PA
Livability — Mehoopany
No livability data for this city. (Only ~50 U.S. cities are tracked.)
Census & demographics
- Population (ZIP)
- 11,043
Population outlook (Wyoming County) Hauer SSP2
- Today (2025)
- 26,334 people
- By 2030
- 25,225 · -4.2%
- By 2040
- 22,707 · -13.8%
- By 2050
- 20,250 · -23.1%
- By 2075
- 15,192 · -42.3%
- By 2100
- 10,961 · -58.4%
Race, ethnicity, and origin ACS 2023
- Neighborhood character
- Predominantly White (95%)
- Race & ethnicity
- White 95% Two or more races 3% Hispanic / Latino 2%
- Common ancestry
- Romanian 9% Lithuanian 2% Iranian 2%
- Foreign-born
- 1% · Canada
- Languages at home
- 97% English-only · Spanish 1%
Political lean MEDSL · Wyoming
- 2024 margin
- Solid R (+36.8) · D 31.1% · R 67.9% · Other 1.0%
- 2008→2024 swing
- -29.2pp toward R · 2008: -7.6pp · 2024: -36.8pp
- All cycles
- 2024: R+36.8 2020: R+35.2 2016: R+38.7 2012: R+12.3 2008: R+7.6
Not yet ingested
- Civics
- —
Market trends
- HPI YoY
- ▼ -2.57%
- Current HPI
- 250.1268
- Rent YoY
- —
- Metro
- —
- State GDP YoY
- ▲ 1.68%
- F500 in state
- 34
Industry mix (Fortune 500 HQ in PA)
| Industry | F500 HQs | Revenue |
|---|---|---|
| Healthcare | 2 | $309B |
|
||
| Insurance | 2 | $27B |
|
||
| Telecommunications / Media | 1 | $124B |
|
||
| Industrial Distribution | 1 | $22B |
|
||
| Financial Services | 1 | $20B |
|
||
| Chemicals / Materials | 1 | $18B |
|
||
Price history
+148.8% since first listed9 events — show timeline
- 2026-04-27 Pending — GSBR as distributed by MLS GRID
- 2026-03-05 Relisted — GSBR as distributed by MLS GRID
- 2026-02-26 Pending — GSBR as distributed by MLS GRID
- 2026-02-16 Listed $218,900 GSBR as distributed by MLS GRID
- 2025-12-19 Relisted — GSBR as distributed by MLS GRID
- 2025-09-15 Price Changed $233,000 GSBR as distributed by MLS GRID
- 2025-08-08 Listed $240,000 GSBR as distributed by MLS GRID
- 1999-06-01 Sold (MLS) $88,000 GSBR as distributed by MLS GRID
- 1999-05-26 Sold (Public Records) $88,000 Public Records
Property tax history
-8.2%/yrLatest (2026): $1,047 · -67.0% YoY. Source: county tax records.
Cash-flow waterfall
monthlySold comps — $/sqft
last 12 mo · ≤1 miLoading sold comps…