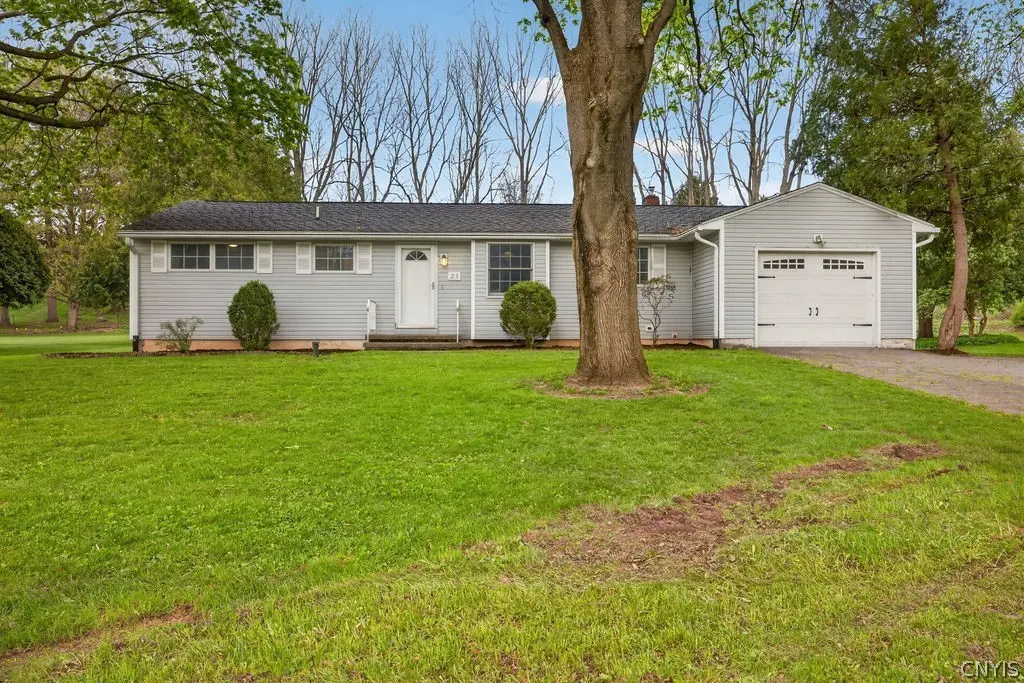
213 Dawley Rd · Fayetteville, NY
Flood risk 1/10 · Minimal
- FEMA flood zone
- X (unshaded)
- Chance of flooding over 30 yrs
- 0.0%
- Est. flood insurance / yr
- $473 – $860
Fire risk 1/10 · Minimal
- Est. fire insurance / yr
- $691 – $1,283
Heat risk 3/10 · Minor
- Hot days now (above 94°F)
- 7 days/yr
- Hot days in 30 yrs
- 16 days/yr
Wind risk 1/10 · Minimal
- Chance of severe wind over 30 yrs
- 1.0%
Air-quality risk 2/10 · Minimal
- Unhealthy air days now
- 0 days/yr
- Unhealthy air days in 30 yrs
- 1 days/yr
Risk factors via First Street. Map © Google.
Why this score? — see what drove the C- grade
The composite is a weighted blend of 9 inputs, each scored 0–100. Each bar is that input's sub-score; the figure is the points it added to the 100-point composite (weight × sub-score).
- ARV discount +15.0/15.0
- Cash flow +11.7/30.0
- Schools +7.1/10.0
- 1% rule +4.4/10.0
- Livability +4.1/5.0
- DSCR +3.4/10.0
- Rent growth +2.5/5.0
- Condition / age +2.5/5.0
- Appreciation +0.0/10.0
$320,000
🖨 Deal sheet (PDF) 📄 Offer letter ✓ Due diligence
Listing remarks
Welcome to this charming and beautifully maintained ranch located in the highly desirable Fayetteville-Manlius School District, offering effortless one-level living with a warm and inviting atmosphere throughout. Featuring 3 bedrooms and 2 full bathrooms, this home showcases hardwood floors and a spacious living room filled with natural light from oversized windows. A cozy wood-burning fireplace serves as the perfect focal point, creating an inviting space for relaxing or entertaining. Just off the main living area, a dedicated office or study provides an ideal work-from-home setup and flows seamlessly into a heated sunroom—complete with a wood stove—offering a versatile, year-r
Key facts
- Heated sunroom
- One-level living
- Dedicated office
Tags
Property features AI
Exterior
- Parking: Attached garage; 1 garage space; Paver block parking
- Utilities: Public water connected; Sewer connected
- Home design: Single-story home; Vinyl siding; Resale property; Block foundation; Existing construction
- Construction: Vinyl siding construction; Block foundation; Built as existing (year built details: existing)
- Exterior features: Rectangular residential lot; City street frontage
Interior
- Kitchen: Electric oven; Electric range; Refrigerator; Galley kitchen
- Bedrooms: 3 main-level bedrooms
- Flooring: Ceramic tile; Hardwood; Varies
- Bathrooms: 2 full bathrooms (both on main level)
- Heating & cooling: Gas forced-air heat; Central air conditioning; Has heating and cooling
- Interior features: Den; Entrance foyer; Galley kitchen; Bath in primary bedroom; Main level primary suite; Recreation room; Sunroom; Florida room; Entry foyer
- Laundry & utility: Laundry on main level; Laundry in basement; Gas water heater
Neighborhood map
What this means for you Summary
Snapshot
- This is a 4-bed/1.0-bath single-family listed at $320k.
Deal economics
- At list price, monthly cash flow is $-93 ($-1k/yr) — negative.
- To cash-flow at today's rent, offer at most $304k (5.1% below list).
- To meet the 1% rule (rent ≥ 1% of price), the offer needs to be $300k (6.2% below list).
- Recommended offer: $300k (6.2% below list) — sets the bar for 1% rule.
- Cap rate 5.9% vs local median 3.1% in Fayetteville — top-decile yield for the area; either an underpriced asset or a hidden risk that comps aren't pricing in. Stress-test before assuming the spread holds.
Location & tenants
- Location reads 82/100 on livability (#71 in NY, #1,067 nationally) — a professional / high-income tenant draw. Strengths: employment A+, housing A+, health & safety A+; Watch: amenities D, commute F.
- Fayetteville-Manlius Central School District (suburban): math 79% / reading 81% proficiency, ranked #49 of 590 in NY (top 8%) — strong family-tenant draw, lease renewals of 3-5y typical; only 7% free/reduced lunch — higher-income household profile.
- Zoned schools: Fayetteville Elementary School (math 77% / reading 82%, grade A, #188 of 2,108 statewide, top 11%, 464 students, 23% FRL); Wellwood Middle School (math 68% / reading 78%, grade A, #72 of 729 statewide, top 10%, 652 students, 0% FRL); Fayetteville-Manlius Senior High School (math 98% / reading 84%, grade A+, #201 of 1,100 statewide, top 18%, 1,416 students, 0% FRL) — zoned schools at 8% FRL track the district average.
- Market conditions: 68 active listings in the ZIP; 1 comparable units currently listed for rent nearby; 616 units permitted in Onondaga County in 2024 (256 in 5+ unit buildings).
Forward outlook
- Local home prices are declining (-3.0%/yr); year-one equity from $2k of loan paydown is wiped out by about $10k of value loss. Plan a longer hold.
- Onondaga County population projected to shrink 9% by 2050 — rents likely to lag national; underwrite the cash flow, not the appreciation.
Negotiation context
- It's been on market 35 days — a 3% lower offer ($310k) is reasonable based on typical stale-listing flexibility.
Risks & watch-outs
- Watch-outs: built in 1956 — expect roof / HVAC / electrical / plumbing capex.
Questions for the listing agent
- What do current leases actually rent for vs. the listed asking? Can we see a recent rent roll and the last 12 months of T-12 income?
- It's been on market 35 days. Have you received any prior offers? Is the seller open to a 6% concession, seller financing, or rate buy-down credit?
- Built in 1956 — when were the roof, HVAC, electrical panel, plumbing, and water heater last replaced?
- Is there a deadline driving the sale (1031 exchange, divorce, estate, relocation)? That informs how much negotiation room exists.
- Schools are A-rated — typically a magnet for longer-tenancy family renters. What's the average tenant stay here, and is there a school-zone premium baked into asking?
- What's the average days-on-market for RENTAL listings here right now (not sales)? A rising rental-DOM trend means longer vacancies and softer asking-rent achievability than the comps imply.
- What's the recent tenant-quality profile in this submarket — average credit score on applications, eviction rate, late-payment / NSF rate, and stable-employment percentage? A property-management company in the area should have these aggregated.
- How much new for-sale + rental construction is in the pipeline within 1–3 miles? Heavy new supply typically softens prices + rents 12–24 months out; constrained supply supports both.
Investment metrics
- 1% rule
- 0.94% ✗
- Cap rate
- 5.94%
- Cash-on-cash
- -1.25%
- DSCR
- 0.94
- GRM
- 8.9
CMA / ARV
- ARV (median comp)
- $425,921
- List price
- $320,000
- Delta
- -24.87%
- Verdict
- UNDERPRICED
- Comps
- 20 within 1.0 mi
Show comp detail 12 sales within ~0.75 mi
| Address | Dist | Beds/Ba | Sqft | Sold | Price | $/sf | Match |
|---|---|---|---|---|---|---|---|
| 220 Redfield Ave | 0.46mi | 4/1.5 | 1,554 (-2%) | 5mo | $358,000 | $230 | 68 |
| 310 Dawley Rd | 0.22mi | 4/1.5 | 1,707 (+7%) | 14mo | $391,000 | $229 | 64 |
| 104 Clark Rd | 0.58mi | 4/2.0 | 1,683 (+6%) | 6mo | $340,000 | $202 | 54 |
| 7884 Salt Springs Rd | 0.42mi | 3/2.0 (-1) | 1,650 (+4%) | 14mo | $375,000 | $227 | 54 |
| 319 Southfield Dr | 0.57mi | 4/2.0 | 1,664 (+4%) | 11mo | $350,000 | $210 | 53 |
| 803 Oakwood St | 0.55mi | 3/2.0 (-1) | 1,463 (-8%) | 2mo | $320,000 | $219 | 50 |
| 221 Redfield Ave | 0.45mi | 4/2.5 | 1,810 (+14%) | 1mo | $517,500 | $286 | 50 |
| 605 Churchill Ct | 0.60mi | 3/2.0 (-1) | 1,591 (-0%) | 18mo | $395,000 | $248 | 48 |
| 304 Southfield Dr | 0.52mi | 3/2.0 (-1) | 1,748 (+10%) | 6mo | $336,400 | $192 | 45 |
| 104 Vollmer Rd | 0.59mi | 4/2.0 | 1,678 (+5%) | 19mo | $290,000 | $173 | 44 |
| 208 Concord Pl | 0.51mi | 3/2.5 (-1) | 1,362 (-14%) | 0mo | $335,000 | $246 | 41 |
| 200 Burlington Dr | 0.68mi | 3/2.0 (-1) | 1,512 (-5%) | 16mo | $275,000 | $182 | 37 |
Match score weights: distance 35% · size 25% · config 20% · recency 20%. Top-matched comps best support the ARV.
Projected returns pro-forma
-3.0% appreciation · 3.0% rent growth · sell at horizon
- IRR
- -18.3%
- Equity multiple
- 0.36×
- Total profit
- $-57,585
- Equity at exit
- $47,713
- IRR
- -10.4%
- Equity multiple
- 0.36×
- Total profit
- $-56,969
- Equity at exit
- $27,668
Cash invested: $89,600 (down + closing). Projections, not guarantees.
Landlord ↔ Tenant lean methodology
- Overall (STATE)
- 15 Strongly Tenant-Friendly
- State New York
- 15 Strongly Tenant-Friendly · D+10
- County
- — inherits STATE
- City
- — inherits STATE
ZIP-level market 13066
- Home prices YoY
- -28.0%
- Active inventory
- 68
- Price-to-rent
- 8.9×
Monthly cashflow live
- Estimated rent
- $3,000 medium interval (Pro) →
- Mortgage (P&I)
- −$1,678
- Tax from tax record
- −$652 /mo · $7,820/yr
- Insurance
- −$133
- HOA
- −$0
- Lot rent
- −$0
- Vacancy / Maint / Mgmt
- −$630
- Net cashflow
- $-93
Break-even live
Sensitivity live
| Price | -10% $88 | -5% $-3 | +0% $-93 | +5% $-184 | +10% $-274 |
|---|---|---|---|---|---|
| Rent | -10% $-330 | -5% $-212 | +0% $-93 | +5% $25 | +10% $144 |
| Rate | -1.0pp $68 | -0.5pp $-12 | base $-93 | +0.5pp $-176 | +1.0pp $-260 |
UW: 25.0% down · 7.5% · 30yr · 1.5% tax · 5.0% vac · 8.0% maint · 8.0% mgmt
Financing live
Cash to close
- Down payment
- $80,000
- Closing costs
- $9,600
- Reserves months
- —
- Total cash needed
- —
Loan-product check · same deal, 3 products live
Conventional
25% down · 7.5% · 30yr
- Down + closing
- —
- Monthly P&I
- —
- Monthly cashflow
- —
- DSCR
- —
- Eligible?
- —
Personal DTI + credit; lowest rate.
DSCR
20% down · 8.5% · 30yr
- Down + closing
- —
- Monthly P&I
- —
- Monthly cashflow
- —
- DSCR
- —
- Eligible?
- —
No personal income docs; deal must DSCR.
Hard money
10% down · 12.0% · 12mo
- Down + closing
- —
- Monthly P&I
- —
- Monthly cashflow
- —
- DSCR
- —
- Eligible?
- —
Short-term bridge; refi at stabilization.
Rent comps 1 comps
| Address | Beds | Baths | Sqft | Rent | $/sqft | DOM | Units | Dist |
|---|---|---|---|---|---|---|---|---|
| 206 E Genesee St Fayetteville, NY | 3.0 | 2.0 | 2000 | $3,000 | $1.50 | 46d | 1 | 1.13mi |
Listing history 7 events
-
2026-06-05statusdays on market $320,000 Pending 35 DOM
-
2026-06-02days on market $320,000 Active Under Contract 34 DOM
-
2026-06-01days on market $320,000 Active Under Contract 33 DOM
-
2026-05-31days on market $320,000 Active Under Contract 32 DOM
-
2026-05-30days on market $320,000 Active Under Contract 31 DOM
-
2026-05-03historical Active Under Contract 1197-char remark
-
2026-04-29$320,000 Active 1197-char remark
ⓘ Source: listings_history table (triggers on properties + properties_extension) + one-shot
backfill from property_details.listing_events for pre-trigger history.
Tax reassessment forecast NY · Partial reset (capped growth)
- Current annual tax
- $7,820 · $652/mo
- Projected year-2 tax
- $7,820 · $652/mo
- Expected delta
- $0/yr ($0/mo · -0.0%)
ⓘ Screening estimate from a state-policy table — verify with the county assessor before closing.
Climate risk First Street
- Flood 1/10 Low FEMA zone X (unshaded) · 0% chance over 30 yrs
- Wildfire 1/10 Low
- Heat 3/10 Moderate 7 d/yr ≥94°F today · 16 d/yr by 30 yrs out
- Wind 1/10 Low 100% chance of damaging wind over 30 yrs
- Air quality 2/10 Low 0 unhealthy d/yr today · 1 by 30 yrs out
Nearby sold comps map
Loading sold comps map…
Walkable amenities ~0.75 mi
Loading nearby amenities…
Taxation est. · year 1
- Rental income
- $36,000
- − Mortgage interest
- −$17,925
- − Property taxes
- −$7,820
- − Insurance
- −$1,600
- − Repairs & maintenance
- −$2,880
- − Management
- −$2,880
- − Depreciation
- −$9,309
- Taxable loss
- −$6,414
- Est. tax savings @ 24.0%
- +$1,539
- After-tax cash flow
- $422/yr
For passive investors: Depreciation is non-cash, so a rental often shows a tax loss while cash-flowing — sheltering income. Rental losses are passive: they offset passive income freely, and up to $25,000/yr can offset ordinary (W-2) income if you actively participate and your MAGI is under $100k (phasing out to $0 by $150k); unused losses carry forward. On sale, claimed depreciation is recaptured at up to 25%, and gains may owe capital-gains tax (a 1031 exchange can defer both). Figures are a year-1 estimate at your 24.0% rate — not tax advice; consult a CPA.
Schools (NCES district)
- District
- Fayetteville-Manlius Central School District
- NCES district ID
- 3618330
- Math proficiency
- 79% ▼ -5.00%
- Reading proficiency
- 81% ▲ 7.00%
- Median HH income
- $86,156
- Composite
- 71.12/100
- National rank
- #238
- State rank
- #49 of 590 in NY
Livability — Fayetteville
- Score
- 82/100
- State rank
- #71
- US rank
- #1067
Category grades
Schools grade is shown separately in the Schools card above.
Census & demographics
- City population
- 12,680
- Population (ZIP)
- 12,680
Population outlook (Onondaga County) Hauer SSP2
- Today (2025)
- 467,894 people
- By 2030
- 463,381 · -1.0%
- By 2040
- 447,697 · -4.3%
- By 2050
- 426,399 · -8.9%
- By 2075
- 373,661 · -20.1%
- By 2100
- 307,967 · -34.2%
Race, ethnicity, and origin ACS 2023
- Neighborhood character
- Predominantly White (88%)
- Race & ethnicity
- White 88% Two or more races 4% Hispanic / Latino 3% Asian 3% Black 2%
- Common ancestry
- Romanian 5% Scotch-Irish 3% Lithuanian 3%
- Foreign-born
- 7% · Canada, China
- Languages at home
- 92% English-only · Other Indo-European 2% Chinese 2% Spanish 1%
Political lean MEDSL · Onondaga
- 2024 margin
- D (+17.3) · D 58.6% · R 41.4%
- 2008→2024 swing
- -3.0pp toward R · 2008: 20.3pp · 2024: 17.3pp
- All cycles
- 2024: D+17.3 2020: D+20.6 2016: D+12.8 2012: D+21.1 2008: D+20.3
Not yet ingested
- Civics
- —
Market trends
- HPI YoY
- ▼ -124.65%
- Current HPI
- 319.9702
- Rent YoY
- —
- Metro
- —
- State GDP YoY
- ▲ 2.60%
- F500 in state
- 92
Industry mix (Fortune 500 HQ in NY)
| Industry | F500 HQs | Revenue |
|---|---|---|
| Financial Services | 10 | $950B |
|
||
| Consumer Goods | 9 | $162B |
|
||
| Insurance | 4 | $225B |
|
||
| Telecommunications | 2 | $144B |
|
||
| Pharmaceuticals | 2 | $112B |
|
||
| Media / Entertainment | 2 | $69B |
|
||
Price history
3 events — show timeline
- 2026-06-04 Pending — CNYIS
- 2026-05-03 Contingent — CNYIS
- 2026-04-29 Listed $320,000 CNYIS
Property tax history
+4.7%/yrLatest (2025): $7,820 · +6.7% YoY. Source: county tax records.
Cash-flow waterfall
monthlySold comps — $/sqft
last 12 mo · ≤1 miLoading sold comps…