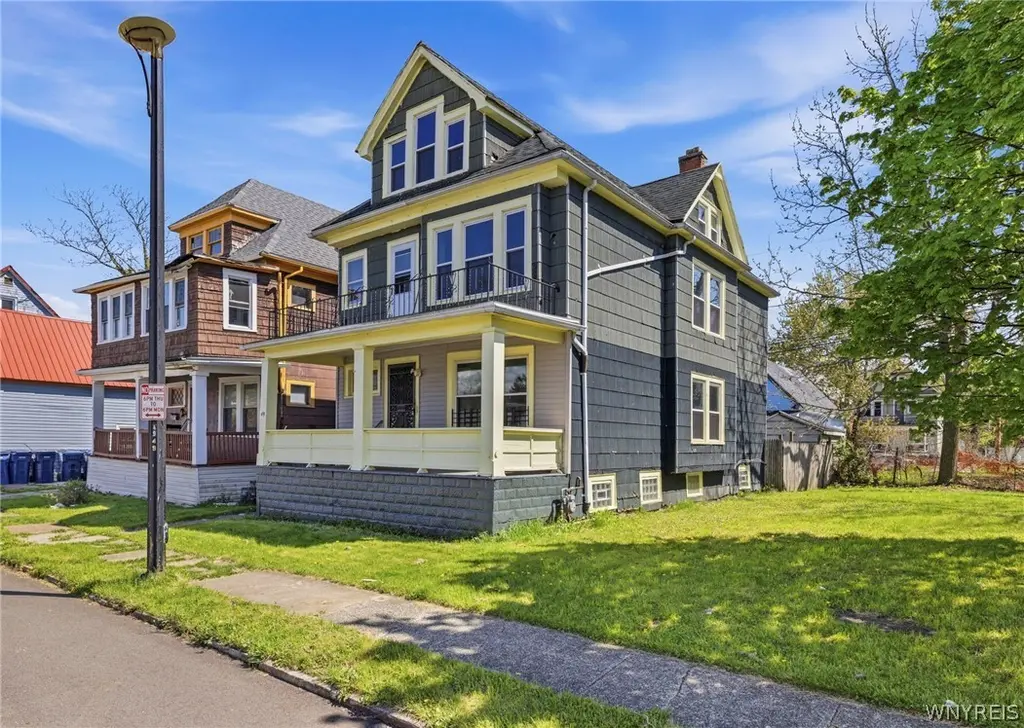
49 Brewster St · Buffalo, NY
Flood risk 1/10 · Minimal
- FEMA flood zone
- X (unshaded)
- Chance of flooding over 30 yrs
- 0.0%
- Est. flood insurance / yr
- $473 – $860
Fire risk 1/10 · Minimal
- Est. fire insurance / yr
- $691 – $1,283
Heat risk 3/10 · Minor
- Hot days now (above 93°F)
- 7 days/yr
- Hot days in 30 yrs
- 15 days/yr
Wind risk 1/10 · Minimal
- Chance of severe wind over 30 yrs
- —
Air-quality risk 3/10 · Minor
- Unhealthy air days now
- 2 days/yr
- Unhealthy air days in 30 yrs
- 3 days/yr
Risk factors via First Street. Map © Google.
Why this score? — see what drove the C+ grade
The composite is a weighted blend of 9 inputs, each scored 0–100. Each bar is that input's sub-score; the figure is the points it added to the 100-point composite (weight × sub-score).
- Cash flow +21.9/30.0
- ARV discount +15.0/15.0
- DSCR +7.0/10.0
- 1% rule +5.7/10.0
- Rent growth +4.0/5.0
- Livability +3.9/5.0
- Schools +3.3/10.0
- Condition / age +2.5/5.0
- Appreciation +0.0/10.0
$199,900
🖨 Deal sheet 📄 Offer letter ✓ Due diligence
Listing remarks
Excellent opportunity at 49 Brewster St, Buffalo, NY 14214. This spacious multi-family property offers strong potential for both owner-occupants and investors. The lower level features 2 bedrooms, a living room, dining room, kitchen, and a full bathroom. The upper level offers 4 bedrooms, 1.5 bathrooms, a living room, a dining room, and a kitchen, providing ample living space. Full basement for additional storage or potential use. Conveniently located near schools, shopping, restaurants, public transportation, and everyday amenities. Great opportunity to add to your investment portfolio or generate rental income. Square Footage is different from tax records for these properties, please see
Key facts
- Full basement
- Built 1913
- Listed 3 days
Tags
Property features AI
Finance
- Financial info: Owner pays water; water included in rent; Operating expenses include water/sewer; Two-unit multi-family property with two separate gas and electric meters
Exterior
- Parking: No driveway
- Utilities: Public water connected; Sewer connected; Circuit breaker electrical system
- Home design: Two-story building; Existing construction
- Construction: Vinyl siding; Stone foundation; Asphalt roof; PEX plumbing
- Exterior features: Near public transit; Rectangular residential lot; City street frontage
Interior
- Kitchen: Gas water heater
- Bedrooms: One unit with 4 bedrooms; One unit with 2 bedrooms
- Flooring: Carpet; Hardwood; Tile; Vinyl; Varied flooring
- Bathrooms: Two full bathrooms (total in building); Each unit has one full bathroom
- Heating & cooling: Gas forced-air heating
- Interior features: Accessible doors; Full basement
- Laundry & utility: Separate gas meters for each unit; Separate electric meters for each unit
Neighborhood map
What this means for you Summary
Snapshot
- This is a 4-bed/2.0-bath townhouse listed at $200k.
Deal economics
- At list price, monthly cash flow is $315 ($4k/yr) — positive.
- The deal already cash-flows at list — no discount required.
- Meets the 1% rule at list price ($2k rent vs $200k).
Location & tenants
- Location reads 77/100 on livability (#195 in NY, #3,011 nationally) — a middle-class / working-renter tenant base. Strengths: commute A+, housing A+, health & safety A+; Watch: crime F, employment D-.
- Buffalo City School District (urban): math 41% / reading 40% proficiency, ranked #535 of 590 in NY (top 91%) — families likely to look elsewhere, expect single-tenant / working-renter base with shorter leases; 75% free/reduced lunch — lower-income household profile, screen leases tightly.
- Market conditions: Rents rising fast (+5.8%/yr); 90 active listings in the ZIP; 18 comparable units currently listed for rent nearby; rentals at typical pace (median 15d on market — plan ~3-4 weeks tenant-placement turnaround); 1,244 units permitted in Erie County in 2024 (563 in 5+ unit buildings).
- This rent runs 44% of the median local income ($58k/yr) — at the standard rent-burdened threshold; future hikes will face affordability resistance.
Forward outlook
- Local home prices are declining (-3.0%/yr); year-one equity from $1k of loan paydown is wiped out by about $6k of value loss. Plan a longer hold.
- At projected returns (-3.0% appreciation + 5.8% rent growth), your $56k cash investment doubles in ~10 years — after that, you're playing with house money.
Negotiation context
- Only 3 days on market — expect competitive offers; lowballing is unlikely to land.
- 2 sale attempts with the ask held roughly flat each time — persistent listings suggest the price (not the market) is what's stuck; bring a comps-based counter.
- Current owner paid $68k; list at $200k implies a 194% gain — meaningful room to come down on a strong offer.
Risks & watch-outs
- Watch-outs: built in 1913 — expect roof / HVAC / electrical / plumbing capex.
Questions for the listing agent
- Built in 1913 — when were the roof, HVAC, electrical panel, plumbing, and water heater last replaced?
- Is there a deadline driving the sale (1031 exchange, divorce, estate, relocation)? That informs how much negotiation room exists.
- Crime grade is F in this area — have there been break-ins, vandalism, or insurance claims at this property in the last 3 years? What carrier currently insures it and at what premium?
- What's the average days-on-market for RENTAL listings here right now (not sales)? A rising rental-DOM trend means longer vacancies and softer asking-rent achievability than the comps imply.
- What's the recent tenant-quality profile in this submarket — average credit score on applications, eviction rate, late-payment / NSF rate, and stable-employment percentage? A property-management company in the area should have these aggregated.
- How much new for-sale + rental construction is in the pipeline within 1–3 miles? Heavy new supply typically softens prices + rents 12–24 months out; constrained supply supports both.
Investment metrics
- 1% rule
- 1.07% ✓
- Cap rate
- 8.19%
- Cash-on-cash
- 6.76%
- DSCR
- 1.30
- GRM
- 7.8
CMA / ARV
- ARV (on-the-fly)
- $324,054
- Comps found
- 4
Show comp detail 4 sales within ~0.75 mi
| Address | Dist | Beds/Ba | Sqft | Sold | Price | $/sf | Match |
|---|---|---|---|---|---|---|---|
| 36 Vernon Pl | 0.40mi | 4/2.0 | 2,156 (+2%) | 13mo | $330,000 | $153 | 67 |
| 10 Russell St | 0.63mi | 4/2.0 | 2,056 (-3%) | 6mo | $323,000 | $157 | 61 |
| 83 Monticello Pl | 0.54mi | 4/2.0 | 2,121 (+0%) | 22mo | $180,000 | $85 | 56 |
| 66 Monticello Pl | 0.53mi | 4/2.0 | 2,296 (+8%) | 8mo | $150,000 | $65 | 55 |
Match score weights: distance 35% · size 25% · config 20% · recency 20%. Top-matched comps best support the ARV.
Projected returns pro-forma
-3.0% appreciation · 5.81% rent growth · sell at horizon
- IRR
- -2.8%
- Equity multiple
- 0.89×
- Total profit
- $-6,031
- Equity at exit
- $29,806
- IRR
- 9.8%
- Equity multiple
- 1.86×
- Total profit
- $47,885
- Equity at exit
- $17,284
Cash invested: $55,972 (down + closing). Projections, not guarantees.
Landlord ↔ Tenant lean methodology
- Overall (STATE)
- 15 Strongly Tenant-Friendly
- State New York
- 15 Strongly Tenant-Friendly · D+10
- County
- — inherits STATE
- City
- — inherits STATE
ZIP-level market 14214
- Rents YoY
- 5.8%
- Active inventory
- 90
- Price-to-rent
- 7.8×
Monthly cashflow live
- Estimated rent
- $2,148 high interval (Pro) →
- Mortgage (P&I)
- −$1,048
- Tax est. 1.5%
- −$250 /mo · $2,998/yr
- Insurance
- −$83
- HOA
- −$0
- Vacancy / Maint / Mgmt
- −$451
- Net cashflow
- $315
Break-even live
UW: 25.0% down · 7.5% · 30yr · 1.5% tax · 5.0% vac · 8.0% maint · 8.0% mgmt
Financing live
Cash to close
- Down payment
- $49,975
- Closing costs
- $5,997
- Reserves months
- —
- Total cash needed
- —
Loan-product check · same deal, 3 products live
Conventional
25% down · 7.5% · 30yr
- Down + closing
- —
- Monthly P&I
- —
- Monthly cashflow
- —
- DSCR
- —
- Eligible?
- —
Personal DTI + credit; lowest rate.
DSCR
20% down · 8.5% · 30yr
- Down + closing
- —
- Monthly P&I
- —
- Monthly cashflow
- —
- DSCR
- —
- Eligible?
- —
No personal income docs; deal must DSCR.
Hard money
10% down · 12.0% · 12mo
- Down + closing
- —
- Monthly P&I
- —
- Monthly cashflow
- —
- DSCR
- —
- Eligible?
- —
Short-term bridge; refi at stabilization.
Rent comps 18 comps
| Address | Beds | Baths | Sqft | Rent | $/sqft | DOM | Units | Dist |
|---|---|---|---|---|---|---|---|---|
| 202 Summit Ave Unit 1 Buffalo, NY | 3.0 | 1.0 | 2000 | $2,400 | $1.20 | 23d | 1 | 0.56mi |
| 563 Humboldt Pkwy Buffalo, NY | 3.0 | 1.0 | 2004 | $1,200 | $0.60 | 23d | 1 | 0.95mi |
| 25 Parkridge Ave Buffalo, NY | 3.0 | 1.0 | 1914 | $1,350 | $0.71 | 14d | 1 | 0.96mi |
| 146 Wallace Ave Buffalo, NY | 3.0 | 1.0 | 2706 | $1,700 | $0.63 | 43d | 1 | 1.04mi |
| 89 Lasalle Ave Buffalo, NY | 1.0–4.0 | 1.0–4.0 | 1024 | $2,997 | $2.93 | 1d | 10 | 1.06mi |
| 184 Butler Ave Unit 1545840P Buffalo, NY | 4.0 | 1.0 | 1496 | $3,226 | $2.16 | 14d | 1 | 1.18mi |
| 73 Inter Park Ave Buffalo, NY | 3.0 | 1.0 | 2080 | $1,300 | $0.62 | 14d | 1 | 1.22mi |
| 82 Butler Ave Unit 2 Buffalo, NY | 3.0 | 1.0 | 2752 | $1,300 | $0.47 | 43d | 1 | 1.23mi |
| 59 Lisbon Ave Buffalo, NY | 3.0 | 1.0 | 2521 | $1,250 | $0.50 | 23d | 1 | 1.25mi |
| 24 Custer St Buffalo, NY | 5.0 | 2.0 | 2500 | $3,000 | $1.20 | 14d | 1 | 1.32mi |
| 163 Carmel Rd Buffalo, NY | 3.0 | 1.0 | 1400 | $1,800 | $1.29 | 3d | 1 | 1.33mi |
| 85 Highgate Ave Buffalo, NY | 5.0 | 2.0 | 2193 | $3,750 | $1.71 | 14d | 1 | 1.34mi |
| 175 Lisbon Ave Buffalo, NY | 5.0 | 2.0 | 2000 | $2,500 | $1.25 | 14d | 1 | 1.35mi |
| 28 Lonsdale Rd Buffalo, NY | 3.0 | 1.0 | 2735 | $1,725 | $0.63 | 43d | 1 | 1.36mi |
| 65 Northrup Pl Buffalo, NY | 5.0 | 2.0 | 1467 | $2,500 | $1.70 | 14d | 1 | 1.41mi |
| 222 Lisbon Ave Unit Upper Buffalo, NY | 3.0 | 1.0 | 1400 | $1,400 | $1.00 | 43d | 1 | 1.42mi |
| 79 Commonwealth Ave Buffalo, NY | 3.0 | 1.0 | 1450 | $1,600 | $1.10 | 23d | 1 | 1.45mi |
| 88 Commonwealth Ave Buffalo, NY | 3.0 | 1.0 | 2710 | $1,695 | $0.63 | 11d | 1 | 1.49mi |
Listing history 5 events
-
2026-05-14status Pending
-
2026-05-11$199,900 Active
-
2025-08-26historical
-
2025-04-26$209,900 Active
-
2021-12-20soldstatus $68,000
ⓘ Source: listings_history table (triggers on properties + properties_extension) + one-shot
backfill from property_details.listing_events for pre-trigger history.
Climate risk First Street
- Flood 1/10 Low FEMA zone X (unshaded) · 0% chance over 30 yrs
- Wildfire 1/10 Low
- Heat 3/10 Moderate 7 d/yr ≥93°F today · 15 d/yr by 30 yrs out
- Wind 1/10 Low
- Air quality 3/10 Moderate 2 unhealthy d/yr today · 3 by 30 yrs out
Nearby sold comps map
Loading sold comps map…
Walkable amenities ~0.75 mi
Loading nearby amenities…
Taxation est. · year 1
- Rental income
- $25,775
- − Mortgage interest
- −$11,198
- − Property taxes
- −$2,998
- − Insurance
- −$1,000
- − Repairs & maintenance
- −$2,062
- − Management
- −$2,062
- − Depreciation
- −$5,815
- Taxable income
- $640
- Est. tax owed @ 24.0%
- −$154
- After-tax cash flow
- $3,631/yr
For passive investors: Depreciation is non-cash, so a rental often shows a tax loss while cash-flowing — sheltering income. Rental losses are passive: they offset passive income freely, and up to $25,000/yr can offset ordinary (W-2) income if you actively participate and your MAGI is under $100k (phasing out to $0 by $150k); unused losses carry forward. On sale, claimed depreciation is recaptured at up to 25%, and gains may owe capital-gains tax (a 1031 exchange can defer both). Figures are a year-1 estimate at your 24.0% rate — not tax advice; consult a CPA.
Schools (NCES district)
- District
- Buffalo City School District
- NCES district ID
- 3605850
- Math proficiency
- 41% ▲ 11.00%
- Reading proficiency
- 40% ▲ 7.00%
- Median HH income
- $31,665
- Composite
- 33.17/100
- National rank
- #5544
- State rank
- #535 of 590 in NY
Livability — Buffalo
- Score
- 77/100
- State rank
- #195
- US rank
- #3011
Category grades
Schools grade is shown separately in the Schools card above.
Census & demographics
- Census place
- Buffalo, NY
- County
- Erie County · 714,559 people
- City population
- 440,021
- Metro
- Buffalo-Cheektowaga, NY
- Population (ZIP)
- 21,314
- Household income
- $58,228
- Rent vs Own
- Severe rent burden
- 1820.0
Population outlook (Erie County) Hauer SSP2
- Today (2025)
- 933,037 people
- By 2030
- 935,181 · +0.2%
- By 2040
- 928,531 · -0.5%
- By 2050
- 905,725 · -2.9%
- By 2075
- 834,037 · -10.6%
- By 2100
- 708,033 · -24.1%
Race, ethnicity, and origin ACS 2023
- Neighborhood character
- Diverse neighborhood (Simpson 0.67)
- Race & ethnicity
- White 47% Black 31% Asian 11% Hispanic / Latino 7% Two or more races 6%
- Hispanic origin (detail)
- Puerto Rican 3%
- Common ancestry
- Romanian 5% Lithuanian 2% Scotch-Irish 1%
- Foreign-born
- 14% · Canada, China
- Languages at home
- 81% English-only · Other Indo-European 7% Spanish 4% Other Asian/Pacific 1%
Political lean MEDSL · Erie
- 2024 margin
- Lean D (+9.7) · D 54.8% · R 45.2%
- 2008→2024 swing
- -7.9pp toward R · 2008: 17.5pp · 2024: 9.7pp
- All cycles
- 2024: D+9.7 2020: D+14.7 2016: D+4.8 2012: D+15.6 2008: D+17.5
Not yet ingested
- Civics
- —
Market trends
- HPI YoY
- ▼ -282.52%
- Current HPI
- 373.377
- Rent YoY
- ▲ 5.81%
- Metro
- Buffalo-Cheektowaga, NY
- State GDP YoY
- ▲ 2.60%
- F500 in state
- 92
Industry mix (Fortune 500 HQ in NY)
| Industry | F500 HQs | Revenue |
|---|---|---|
| Financial Services | 10 | $950B |
|
||
| Consumer Goods | 9 | $162B |
|
||
| Insurance | 4 | $225B |
|
||
| Telecommunications | 2 | $144B |
|
||
| Pharmaceuticals | 2 | $112B |
|
||
| Media / Entertainment | 2 | $69B |
|
||
Price history
+194.0% since first listed5 events — show timeline
- 2026-05-14 Pending — WNYREIS
- 2026-05-11 Listed $199,900 WNYREIS
- 2025-08-26 Listing Removed — WNYREIS
- 2025-04-26 Listed $209,900 WNYREIS
- 2021-12-20 Sold (Public Records) $68,000 Public Records
Property tax history
+10.7%/yrLatest (2025): $247 · +0.0% YoY. Source: county tax records.
Cash-flow waterfall
monthlySold comps — $/sqft
last 12 mo · ≤1 miLoading sold comps…