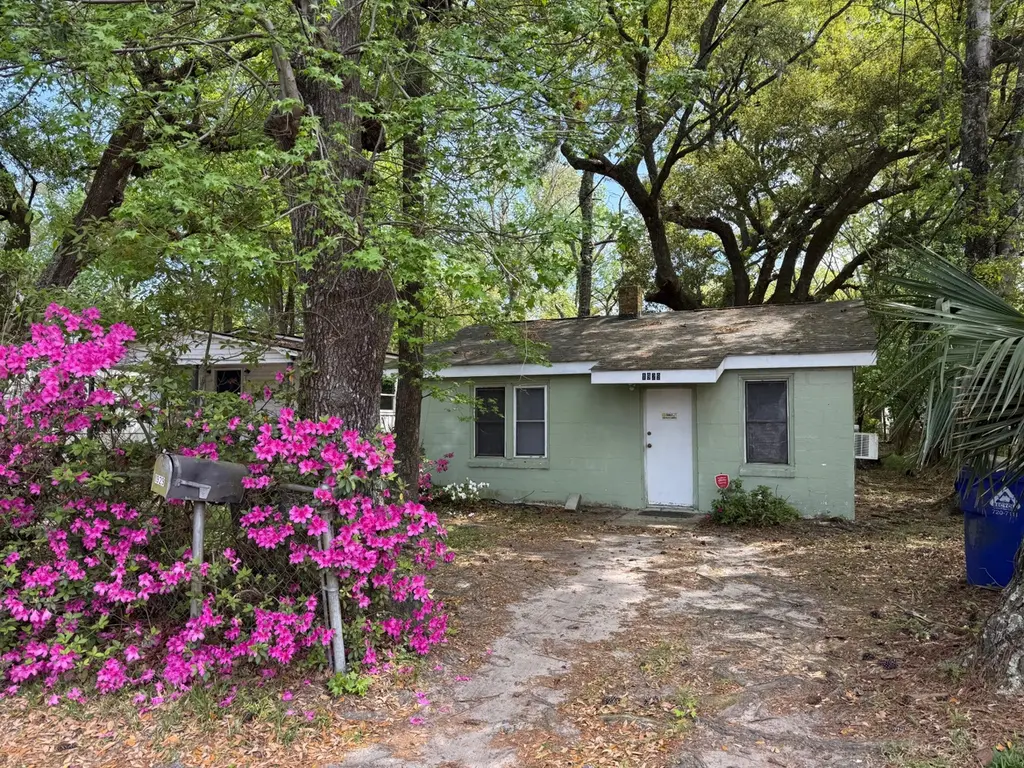
1929 Kerry St · North Charleston, SC
Flood risk 4/10 · Minor
- FEMA flood zone
- X (shaded)
- Chance of flooding over 30 yrs
- 0.22%
- Est. flood insurance / yr
- $507 – $1,088
Fire risk 1/10 · Minimal
- Est. fire insurance / yr
- $783 – $1,453
Heat risk 10/10 · Severe
- Hot days now (above 106°F)
- 7 days/yr
- Hot days in 30 yrs
- 18 days/yr
Wind risk 8/10 · Major
- Chance of severe wind over 30 yrs
- 99.0%
Air-quality risk 3/10 · Minor
- Unhealthy air days now
- 3 days/yr
- Unhealthy air days in 30 yrs
- 3 days/yr
Risk factors via First Street. Map © Google.
Why this score? — see what drove the B+ grade
The composite is a weighted blend of 9 inputs, each scored 0–100. Each bar is that input's sub-score; the figure is the points it added to the 100-point composite (weight × sub-score).
- Cash flow +30.0/30.0
- ARV discount +15.0/15.0
- DSCR +10.0/10.0
- 1% rule +8.4/10.0
- Schools +4.3/10.0
- Livability +3.3/5.0
- Rent growth +2.8/5.0
- Condition / age +2.5/5.0
- Appreciation +0.0/10.0
$115,000
🖨 Deal sheet (PDF) 📄 Offer letter ✓ Due diligence
Listing remarks
Revitalization happening all around this spot! This a great investment property to demo and rebuild new or a great fix and flip or even a renovation project for a new homeowner. Great location close to the airport, shopping, restaurants, the freeways and schools. There is a beautiful live oak tree in the yard!
Key facts
- Renovate project
- Great location
- Investment property
Tags
Property features AI
Exterior
- Utilities: Public sewer; Dominion Energy for power; North Charleston sewer district service
- Home design: Single-family detached residence; Residential property; One story
- Construction: Asphalt roof; Fee simple ownership
- Exterior features: Level, wooded lot (under 0.5 acre); Community trash service
Interior
- Bedrooms: 2 bedrooms (master bedroom on the lower level)
- Bathrooms: 1 bathroom
- Interior features: One-level layout
Neighborhood map
What this means for you Summary
Snapshot
- This is a 2-bed/1.0-bath single-family listed at $115k.
Deal economics
- At list price, monthly cash flow is $492 ($6k/yr) — positive.
- The deal already cash-flows at list — no discount required.
- Meets the 1% rule at list price ($2k rent vs $115k).
- Recommended offer: $108k (6.0% below list) — sets the bar for market timing.
Location & tenants
- Location reads 66/100 on livability (#122 in SC) — a middle-class / working-renter tenant base. Strengths: housing A+, health & safety A+, cost of living A; Watch: employment C-, crime F, amenities F.
- Charleston 01 (urban): math 48% / reading 53% proficiency, ranked #7 of 80 in SC (top 9%) — acceptable for families but not a draw, mixed tenant base, ~2y average lease.
- Zoned schools: North Charleston Creative Arts Elementary (math 22% / reading 27%, grade F, #452 of 597 statewide, top 78%, 397 students, 100% FRL); Morningside Middle (math 4% / reading 12%, grade F, #226 of 229 statewide, top 99%, 567 students, 100% FRL); North Charleston High (math 27% / reading 57%, grade F, #174 of 196 statewide, top 90%, 768 students, 100% FRL) — zoned schools average 100% FRL vs 44% district-wide (56 pts higher); higher-poverty schools than district average — tighter screening recommended.
- Zoned-school proficiency averages 25% at this address vs 50% district-wide (-26 pts) — the specific schools serving this property underperform the Charleston 01 average; the district grade overstates school quality for this exact location.
- Market conditions: Rents rising (+1.4%/yr); 173 active listings in the ZIP; 14 comparable units currently listed for rent nearby; rentals at typical pace (median 21d on market — plan ~3-4 weeks tenant-placement turnaround); 4,156 units permitted in Charleston County in 2024 (857 in 5+ unit buildings).
Forward outlook
- Local home prices are declining (-3.0%/yr); year-one equity from $795 of loan paydown is wiped out by about $3k of value loss. Plan a longer hold.
- Charleston County population projected at +44% by 2050 — long-run rental-demand tailwind backs the buy-and-hold thesis.
- At projected returns (-3.0% appreciation + 1.4% rent growth), your $32k cash investment doubles in ~8 years — after that, you're playing with house money.
Negotiation context
- It's been on market 76 days — a 6% lower offer ($108k) is reasonable based on typical stale-listing flexibility.
- 2 sale attempts; this cycle's ask has dropped $30k (21%) from the opening price — seller is motivated, your offer sets the floor, not the list.
- Current owner paid $5k; list at $115k implies a 2200% gain — meaningful room to come down on a strong offer.
Risks & watch-outs
- Watch-outs: built in 1954 — expect roof / HVAC / electrical / plumbing capex.
- Climate carrying-cost: severe wind risk, 99% chance of damaging wind over 30y; extreme-heat days projected 7→18/yr by 2055 (HVAC capex compounding) — expect insurance premiums to compound above CPI over the hold.
Questions for the listing agent
- It's been on market 76 days. Have you received any prior offers? Is the seller open to a 6% concession, seller financing, or rate buy-down credit?
- Built in 1954 — when were the roof, HVAC, electrical panel, plumbing, and water heater last replaced?
- Why hasn't it sold? Are there any deal-killer items the seller is aware of (foundation, flood, title, zoning, code violations)?
- Is there a deadline driving the sale (1031 exchange, divorce, estate, relocation)? That informs how much negotiation room exists.
- Crime grade is F in this area — have there been break-ins, vandalism, or insurance claims at this property in the last 3 years? What carrier currently insures it and at what premium?
- What's the average days-on-market for RENTAL listings here right now (not sales)? A rising rental-DOM trend means longer vacancies and softer asking-rent achievability than the comps imply.
- What's the recent tenant-quality profile in this submarket — average credit score on applications, eviction rate, late-payment / NSF rate, and stable-employment percentage? A property-management company in the area should have these aggregated.
- How much new for-sale + rental construction is in the pipeline within 1–3 miles? Heavy new supply typically softens prices + rents 12–24 months out; constrained supply supports both.
Investment metrics
- 1% rule
- 1.34% ✓
- Cap rate
- 11.43%
- Cash-on-cash
- 18.33%
- DSCR
- 1.82
- GRM
- 6.2
CMA / ARV
- ARV (on-the-fly)
- $163,566
- Comps found
- 1
Show comp detail 1 sale within ~0.75 mi
| Address | Dist | Beds/Ba | Sqft | Sold | Price | $/sf | Match |
|---|---|---|---|---|---|---|---|
| 1906 Bolton Street St | 0.50mi | 2/1.0 | 600 (-14%) | 17mo | $140,000 | $233 | 38 |
Match score weights: distance 35% · size 25% · config 20% · recency 20%. Top-matched comps best support the ARV.
Projected returns pro-forma
-3.0% appreciation · 1.37% rent growth · sell at horizon
- IRR
- 8.2%
- Equity multiple
- 1.32×
- Total profit
- $10,185
- Equity at exit
- $17,147
- IRR
- 16.1%
- Equity multiple
- 2.22×
- Total profit
- $39,244
- Equity at exit
- $9,943
Cash invested: $32,200 (down + closing). Projections, not guarantees.
Landlord ↔ Tenant lean methodology
- Overall (STATE)
- 90 Strongly Landlord-Friendly
- State South Carolina
- 90 Strongly Landlord-Friendly · R+6
- County
- — inherits STATE
- City
- — inherits STATE
ZIP-level market 29406
- Home prices YoY
- -6.7%
- Rents YoY
- 1.4%
- Active inventory
- 173
- Price-to-rent
- 6.2×
Monthly cashflow live
- Estimated rent
- $1,544 high interval (Pro) →
- Mortgage (P&I)
- −$603
- Tax from tax record
- −$76 /mo · $918/yr
- Insurance
- −$48
- HOA
- −$0
- Vacancy / Maint / Mgmt
- −$324
- Net cashflow
- $492
Break-even live
Sensitivity live
| Price | -10% $557 | -5% $524 | +0% $492 | +5% $459 | +10% $427 |
|---|---|---|---|---|---|
| Rent | -10% $370 | -5% $431 | +0% $492 | +5% $553 | +10% $614 |
| Rate | -1.0pp $550 | -0.5pp $521 | base $492 | +0.5pp $462 | +1.0pp $432 |
UW: 25.0% down · 7.5% · 30yr · 1.5% tax · 5.0% vac · 8.0% maint · 8.0% mgmt
Financing live
Cash to close
- Down payment
- $28,750
- Closing costs
- $3,450
- Reserves months
- —
- Total cash needed
- —
Loan-product check · same deal, 3 products live
Conventional
25% down · 7.5% · 30yr
- Down + closing
- —
- Monthly P&I
- —
- Monthly cashflow
- —
- DSCR
- —
- Eligible?
- —
Personal DTI + credit; lowest rate.
DSCR
20% down · 8.5% · 30yr
- Down + closing
- —
- Monthly P&I
- —
- Monthly cashflow
- —
- DSCR
- —
- Eligible?
- —
No personal income docs; deal must DSCR.
Hard money
10% down · 12.0% · 12mo
- Down + closing
- —
- Monthly P&I
- —
- Monthly cashflow
- —
- DSCR
- —
- Eligible?
- —
Short-term bridge; refi at stabilization.
Rent comps 14 comps
| Address | Beds | Baths | Sqft | Rent | $/sqft | DOM | Units | Dist |
|---|---|---|---|---|---|---|---|---|
| 1908 Fuller St Unit A North Charleston, SC | 1.0 | 1.0 | 450 | $1,170 | $2.60 | 25d | 1 | 0.29mi |
| 2169 Eleanor Dr Apt B North Charleston, SC | 1.0 | 1.0 | 466 | $1,200 | $2.58 | 16d | 1 | 0.42mi |
| 2181 Eleanor Dr North Charleston, SC | 2.0 | 1.0 | 644 | $1,640 | $2.55 | 16d | 1 | 0.45mi |
| 2181 Eleanor Dr Unit A North Charleston, SC | 2.0 | 1.0 | 644 | $1,640 | $2.55 | 25d | 1 | 0.45mi |
| 5475 Califf Rd Charleston, SC | 2.0 | 1.0 | 750 | $1,350 | $1.80 | 25d | 1 | 0.55mi |
| 1815 Sumner Ave North Charleston, SC | 2.0 | 1.0 | 625 | $1,500 | $2.40 | 16d | 2 | 0.58mi |
| 5527 Read St Apt 21 North Charleston, SC | 2.0 | 1.0 | 570 | $1,499 | $2.63 | 21d | 1 | 0.69mi |
| 5527 Read St Apt 28 North Charleston, SC | 2.0 | 1.0 | 570 | $1,450 | $2.54 | 21d | 1 | 0.69mi |
| 5555 Mole Ln North Charleston, SC | 2.0 | 1.0 | 625 | $1,620 | $2.59 | 13d | 4 | 0.69mi |
| 5555 Mole Ln Apt B1 North Charleston, SC | 2.0 | 1.0 | 625 | $1,600 | $2.56 | 25d | 1 | 0.69mi |
| 2403 Mall Dr North Charleston, SC | 1.0–2.0 | 1.0–2.0 | 911 | $2,470 | $2.71 | 5d | 20 | 0.69mi |
| 5607 Aldrich Ave North Charleston, SC | 2.0 | 1.0 | 650 | $1,650 | $2.54 | 25d | 1 | 0.94mi |
| 1441 Remount Rd North Charleston, SC | 2.0–3.0 | 1.0–2.0 | 837 | $1,500 | $1.79 | 16d | 3 | 0.97mi |
| 1441 Remount Rd Unit 14 North Charleston, SC | 2.0 | 1.0 | 625 | $1,500 | $2.40 | 25d | 1 | 0.97mi |
Listing history 20 events
-
2026-06-22days on market $115,000 Active 76 DOM
-
2026-06-18days on market $115,000 Active 73 DOM
-
2026-06-17days on market $115,000 Active 72 DOM
-
2026-06-16days on market $115,000 Active 71 DOM
-
2026-06-15days on market $115,000 Active 70 DOM
-
2026-06-10days on market $115,000 Active 65 DOM
-
2026-06-09days on market $115,000 Active 64 DOM
-
2026-06-08days on market $115,000 Active 63 DOM
-
2026-06-07days on market $115,000 Active 62 DOM
-
2026-06-05days on market $115,000 Active 59 DOM
-
2026-06-03days on market $115,000 Active 58 DOM
-
2026-06-01days on market $115,000 Active 56 DOM
-
2026-05-31days on market $115,000 Active 55 DOM
-
2026-05-14historical Active Under Contract
-
2026-05-12status Active
-
2026-04-29historical Active Under Contract
-
2026-04-20price $125,000
-
2026-04-06$145,000 Active
-
2001-03-19soldstatus $5,000
-
1983-03-01soldstatus $19,702
ⓘ Source: listings_history table (triggers on properties + properties_extension) + one-shot
backfill from property_details.listing_events for pre-trigger history.
Tax reassessment forecast SC · Resets to sale price
- Current annual tax
- $918 · $76/mo
- Projected year-2 tax
- $918 · $76/mo
- Expected delta
- $0/yr ($0/mo · 0.0%)
ⓘ Screening estimate from a state-policy table — verify with the county assessor before closing.
Climate risk First Street
- Flood 4/10 Moderate FEMA zone X (shaded) · 22% chance over 30 yrs
- Wildfire 1/10 Low
- Heat 10/10 Extreme 7 d/yr ≥106°F today · 18 d/yr by 30 yrs out
- Wind 8/10 Severe 99% chance of damaging wind over 30 yrs
- Air quality 3/10 Moderate 3 unhealthy d/yr today · 3 by 30 yrs out
Nearby sold comps map
Loading sold comps map…
Walkable amenities ~0.75 mi
Loading nearby amenities…
Taxation est. · year 1
- Rental income
- $18,522
- − Mortgage interest
- −$6,442
- − Property taxes
- −$918
- − Insurance
- −$575
- − Repairs & maintenance
- −$1,482
- − Management
- −$1,482
- − Depreciation
- −$3,345
- Taxable income
- $4,278
- Est. tax owed @ 24.0%
- −$1,027
- After-tax cash flow
- $4,876/yr
For passive investors: Depreciation is non-cash, so a rental often shows a tax loss while cash-flowing — sheltering income. Rental losses are passive: they offset passive income freely, and up to $25,000/yr can offset ordinary (W-2) income if you actively participate and your MAGI is under $100k (phasing out to $0 by $150k); unused losses carry forward. On sale, claimed depreciation is recaptured at up to 25%, and gains may owe capital-gains tax (a 1031 exchange can defer both). Figures are a year-1 estimate at your 24.0% rate — not tax advice; consult a CPA.
Schools (NCES district)
- District
- Charleston 01
- NCES district ID
- 4501440
- Math proficiency
- 48% ▼ -2.00%
- Reading proficiency
- 53% ▬ 0.00%
- Median HH income
- $52,376
- Composite
- 43.41/100
- National rank
- #3018
- State rank
- #7 of 80 in SC
Livability — North Charleston
- Score
- 66/100
- State rank
- #122
- US rank
- #12222
Category grades
Schools grade is shown separately in the Schools card above.
Census & demographics
- Census place
- North Charleston, SC
- County
- Charleston County · 366,793 people
- City population
- 108,266
- Metro
- Charleston-North Charleston, SC
- Population (ZIP)
- 32,001
- Household income
- $49,815
- Rent vs Own
- Severe rent burden
- 2054.0
Population outlook (Charleston County) Hauer SSP2
- Today (2025)
- 480,562 people
- By 2030
- 525,921 · +9.4%
- By 2040
- 612,189 · +27.4%
- By 2050
- 691,627 · +43.9%
- By 2075
- 847,979 · +76.5%
- By 2100
- 926,482 · +92.8%
Race, ethnicity, and origin ACS 2023
- Neighborhood character
- Diverse neighborhood (Simpson 0.70)
- Race & ethnicity
- Black 40% White 32% Hispanic / Latino 19% Two or more races 9% Asian 3%
- Hispanic origin (detail)
- Mexican 10% Puerto Rican 1%
- Common ancestry
- Romanian 1% Italian 1% Lithuanian 1%
- Foreign-born
- 15% · Canada, Vietnam
- Languages at home
- 79% English-only · Spanish 17% Vietnamese 1% Tagalog/Filipino 1%
Political lean MEDSL · Charleston
- 2024 margin
- Lean D (+5.7) · D 51.9% · R 46.3% · Other 1.8%
- 2008→2024 swing
- -2.7pp toward R · 2008: 8.3pp · 2024: 5.7pp
- All cycles
- 2024: D+5.7 2020: D+12.9 2016: D+7.9 2012: D+2.4 2008: D+8.3
Not yet ingested
- Civics
- —
Market trends
- HPI YoY
- ▼ -27.09%
- Current HPI
- 374.9164
- Rent YoY
- ▲ 1.37%
- Metro
- Charleston-North Charleston, SC
- State GDP YoY
- ▲ 4.51%
- F500 in state
- 2
Industry mix (Fortune 500 HQ in SC)
| Industry | F500 HQs | Revenue |
|---|---|---|
| Packaging | 1 | $7B |
|
||
Price history
+534.5% since first listed7 events — show timeline
- 2026-05-14 Contingent — Charleston Trident MLS
- 2026-05-12 Relisted — Charleston Trident MLS
- 2026-04-29 Contingent — Charleston Trident MLS
- 2026-04-20 Price Changed $125,000 Charleston Trident MLS
- 2026-04-06 Listed $145,000 Charleston Trident MLS
- 2001-03-19 Sold (Public Records) $5,000 Public Records
- 1983-03-01 Sold (Public Records) $19,702 Public Records
Property tax history
+10.9%/yrLatest (2022): $918 · +0.7% YoY. Source: county tax records.
Cash-flow waterfall
monthlySold comps — $/sqft
last 12 mo · ≤1 miLoading sold comps…