 Multi-family
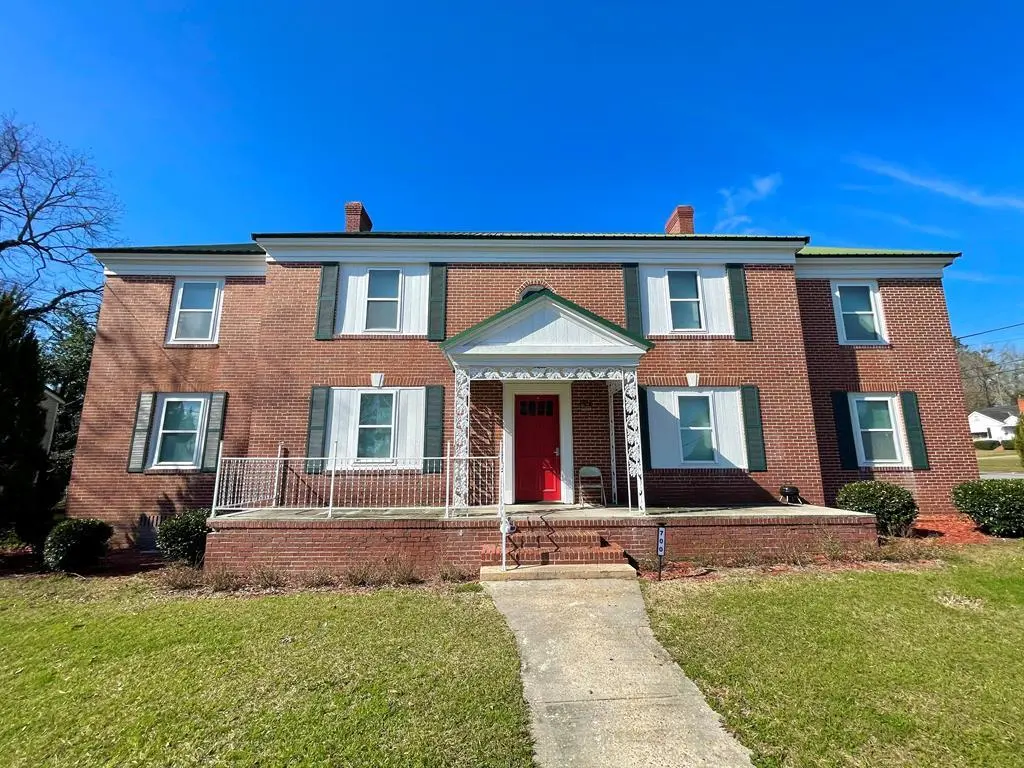
700 SW 1st St #22 · Moultrie, GA
Flood risk No data
- FEMA flood zone
- —
- Chance of flooding over 30 yrs
- —
- Est. flood insurance / yr
- —
Fire risk No data
- Est. fire insurance / yr
- —
Heat risk No data
- Hot days now (above threshold)
- —
- Hot days in 30 yrs
- —
Wind risk No data
- Chance of severe wind over 30 yrs
- —
Air-quality risk No data
- Unhealthy air days now
- —
- Unhealthy air days in 30 yrs
- —
Risk factors via First Street. Map © Google.
Why this score? — see what drove the B- grade
The composite is a weighted blend of 9 inputs, each scored 0–100. Each bar is that input's sub-score; the figure is the points it added to the 100-point composite (weight × sub-score).
- Cash flow +30.0/30.0
- DSCR +10.0/10.0
- 1% rule +8.7/10.0
- ARV discount +7.5/15.0
- Condition / age +4.0/5.0
- Livability +3.0/5.0
- Rent growth +2.5/5.0
- Schools +2.2/10.0
- Appreciation +0.0/10.0
$2,195,000
🖨 Deal sheet (PDF) 📄 Offer letter ✓ Due diligence
Multi-family units
County records classify this as Multi-Family (2-4 Unit). Listing-text estimate: 1 unit. estimate disagrees with records
Listing remarks
22-unit turnkey multifamily investment opportunity in Moultrie with 100% occupancy and strong cash flow. Six buildings across three contiguous parcels totaling approximately 23,916 SF. Unit mix includes fourteen 2BR/1BA units, four 3BR/2BA units, three 1BR/1BA units, and one studio unit, providing diversification across multiple tenant demographics and maximizing leasing demand. Current rents total $19,865/month with ability to bump to market rates of $22,530/mo. All units have been updated with LVP flooring, fresh paint, central HVAC, and upgraded fixtures/appliances while maintaining historic character and oversized floorplans. The property offers a unique, controlled residential setting
Key facts
- Strong cash flow
- Six buildings
- 1.75 acre lot
Tags
Property features AI
Finance
- Other: Property sits on approximately 1.75 acres
- Financial info: Annual tax information available (amount not included per instructions)
- HOA & community: No HOA or community details provided
Exterior
- Parking: No parking details provided
- Security: No security details provided
- Utilities: Public water; Public sewer
- Home design: Multi-family residential (multi unit); 2 stories
- Construction: Brick veneer, frame, and vinyl siding construction; Built with standard foundation (year built not provided)
- Exterior features: Metal roof; Zoned R-3
Interior
- Kitchen: No kitchen details provided
- Bedrooms: No bedroom details provided
- Flooring: No flooring details provided
- Bathrooms: No bathroom details provided
- Heating & cooling: No heating or cooling details provided
- Interior features: No interior details provided
- Laundry & utility: No laundry or utility appliance details provided
Neighborhood map
What this means for you Summary
Snapshot
- This is a multifamily listed at $2.19M. Condition is rated good.
Deal economics
- At list price, monthly cash flow is $9k ($104k/yr) — positive.
- The deal already cash-flows at list — no discount required.
- Meets the 1% rule at list price ($30k rent vs $2.19M).
- Recommended offer: $2.13M (3.0% below list) — sets the bar for market timing.
- Cap rate 11.0% vs local median 4.4% in Moultrie — top-decile yield for the area; either an underpriced asset or a hidden risk that comps aren't pricing in. Stress-test before assuming the spread holds.
Location & tenants
- Location reads 60/100 on livability (#374 in GA) — a middle-class / working-renter tenant base. Strengths: cost of living A+, housing A+; Watch: crime F, commute F, employment F.
- Colquitt County (town): math 29% / reading 25% proficiency, ranked #117 of 174 in GA (top 67%) — low school quality limits family demand, transient renter base, plan for 1-2y turnover; 67% free/reduced lunch — lower-income household profile, screen leases tightly.
- Zoned schools: Stringfellow Elementary School (math 12% / reading 12%, grade F, #1,041 of 1,228 statewide, top 87%, 300 students, 97% FRL); Willie J. Williams Middle School (math 25% / reading 24%, grade F, #301 of 470 statewide, top 66%, 1,369 students, 85% FRL); Colquitt County High School (math 50% / reading 18%, grade F, #98 of 424 statewide, top 23%, 1,787 students, 64% FRL).
- Market conditions: 139 active listings in the ZIP; 94 units permitted in Colquitt County in 2024 (0 in 5+ unit buildings).
Forward outlook
- Local home prices are declining (-3.0%/yr); year-one equity from $15k of loan paydown is wiped out by about $66k of value loss. Plan a longer hold.
- Colquitt County population projected to shrink 5% by 2050 — rents likely to lag national; underwrite the cash flow, not the appreciation.
- At projected returns (-3.0% appreciation + 3.0% rent growth), your $615k cash investment doubles in ~8 years — after that, you're playing with house money.
Negotiation context
- It's been on market 40 days — a 3% lower offer ($2.13M) is reasonable based on typical stale-listing flexibility.
Questions for the listing agent
- It's been on market 40 days. Have you received any prior offers? Is the seller open to a 3% concession, seller financing, or rate buy-down credit?
- Is there a deadline driving the sale (1031 exchange, divorce, estate, relocation)? That informs how much negotiation room exists.
- Schools are F-rated, which usually means shorter tenancies and higher turnover. Who's the typical renter profile here, and what's been the actual vacancy rate?
- Crime grade is F in this area — have there been break-ins, vandalism, or insurance claims at this property in the last 3 years? What carrier currently insures it and at what premium?
- What's the average days-on-market for RENTAL listings here right now (not sales)? A rising rental-DOM trend means longer vacancies and softer asking-rent achievability than the comps imply.
- What's the recent tenant-quality profile in this submarket — average credit score on applications, eviction rate, late-payment / NSF rate, and stable-employment percentage? A property-management company in the area should have these aggregated.
- How much new apartment / multifamily construction is in the pipeline within 1–3 miles? Heavy new supply (>2% of stock underway) typically softens rents 12–24 months out; light construction supports rent growth.
Investment metrics
- 1% rule
- 1.37% ✓
- Cap rate
- 11.03%
- Cash-on-cash
- 16.92%
- DSCR
- 1.75
- GRM
- 6.1
CMA / ARV
- ARV (median comp)
- $937,972
- List price
- $2,195,000
- Delta
- 134.02%
- Verdict
- OVERPRICED
- Comps
- 1 within 2.0 mi
Projected returns pro-forma
-3.0% appreciation · 3.0% rent growth · sell at horizon
- IRR
- 8.2%
- Equity multiple
- 1.32×
- Total profit
- $196,810
- Equity at exit
- $327,282
- IRR
- 17.4%
- Equity multiple
- 2.44×
- Total profit
- $884,067
- Equity at exit
- $189,783
Cash invested: $614,600 (down + closing). Projections, not guarantees.
Landlord ↔ Tenant lean methodology
- Overall (STATE)
- 90 Strongly Landlord-Friendly
- State Georgia
- 90 Strongly Landlord-Friendly · R+3
- County
- — inherits STATE
- City
- — inherits STATE
ZIP-level market 31768
- Home prices YoY
- -33.0%
- Active inventory
- 139
- Price-to-rent
- 133.4×
Monthly cashflow live
- Estimated rent
- $30,173 medium interval (Pro) →
- Mortgage (P&I)
- −$11,511
- Tax est. 1.5%
- −$2,744 /mo · $32,925/yr
- Insurance
- −$915
- HOA
- −$0
- Vacancy / Maint / Mgmt
- −$6,336
- Net cashflow
- $8,668
Break-even live
Sensitivity live
| Price | -10% $10,184 | -5% $9,426 | +0% $8,668 | +5% $7,909 | +10% $7,151 |
|---|---|---|---|---|---|
| Rent | -10% $6,284 | -5% $7,476 | +0% $8,668 | +5% $9,859 | +10% $11,051 |
| Rate | -1.0pp $9,773 | -0.5pp $9,226 | base $8,668 | +0.5pp $8,099 | +1.0pp $7,520 |
22-unit breakdown (identical units grouped — click to expand)
| Units | Beds | Baths | Est. rent |
|---|---|---|---|
| 14× units | 2.0 | 1 | $19,194 |
| #1 | 2.0 | 1 | $1,371 |
| #2 | 2.0 | 1 | $1,371 |
| #3 | 2.0 | 1 | $1,371 |
| #4 | 2.0 | 1 | $1,371 |
| #5 | 2.0 | 1 | $1,371 |
| #6 | 2.0 | 1 | $1,371 |
| #7 | 2.0 | 1 | $1,371 |
| #8 | 2.0 | 1 | $1,371 |
| #9 | 2.0 | 1 | $1,371 |
| #10 | 2.0 | 1 | $1,371 |
| #11 | 2.0 | 1 | $1,371 |
| #12 | 2.0 | 1 | $1,371 |
| #13 | 2.0 | 1 | $1,371 |
| #14 | 2.0 | 1 | $1,371 |
| 4× units | 3.0 | 2 | $5,484 |
| #15 | 3.0 | 2 | $1,371 |
| #16 | 3.0 | 2 | $1,371 |
| #17 | 3.0 | 2 | $1,371 |
| #18 | 3.0 | 2 | $1,371 |
| 3× units | 1.0 | 1 | $4,113 |
| #19 | 1.0 | 1 | $1,371 |
| #20 | 1.0 | 1 | $1,371 |
| #21 | 1.0 | 1 | $1,371 |
| 1× unit | 0.0 | 1 | $1,371 |
| Total (22 units) | $30,173 | ||
UW: 25.0% down · 7.5% · 30yr · 1.5% tax · 5.0% vac · 8.0% maint · 8.0% mgmt
Financing live
Cash to close
- Down payment
- $548,750
- Closing costs
- $65,850
- Reserves months
- —
- Total cash needed
- —
Loan-product check · same deal, 3 products live
Conventional
25% down · 7.5% · 30yr
- Down + closing
- —
- Monthly P&I
- —
- Monthly cashflow
- —
- DSCR
- —
- Eligible?
- —
Personal DTI + credit; lowest rate.
DSCR
20% down · 8.5% · 30yr
- Down + closing
- —
- Monthly P&I
- —
- Monthly cashflow
- —
- DSCR
- —
- Eligible?
- —
No personal income docs; deal must DSCR.
Hard money
10% down · 12.0% · 12mo
- Down + closing
- —
- Monthly P&I
- —
- Monthly cashflow
- —
- DSCR
- —
- Eligible?
- —
Short-term bridge; refi at stabilization.
Listing history 18 events
-
2026-06-21days on market $2,195,000 Active 40 DOM
-
2026-06-21days on market $2,195,000 Active 39 DOM
-
2026-06-18days on market $2,195,000 Active 37 DOM
-
2026-06-17days on market $2,195,000 Active 36 DOM
-
2026-06-16days on market $2,195,000 Active 35 DOM
-
2026-06-15days on market $2,195,000 Active 34 DOM
-
2026-06-13days on market $2,195,000 Active 32 DOM
-
2026-06-12days on market $2,195,000 Active 31 DOM
-
2026-06-09days on market $2,195,000 Active 28 DOM
-
2026-06-08days on market $2,195,000 Active 27 DOM
-
2026-06-07days on market $2,195,000 Active 26 DOM
-
2026-06-07days on market $2,195,000 Active 25 DOM
-
2026-06-04days on market $2,195,000 Active 22 DOM
-
2026-06-02days on market $2,195,000 Active 21 DOM
-
2026-06-01days on market $2,195,000 Active 20 DOM
-
2026-05-31days on market $2,195,000 Active 19 DOM
-
2026-05-31days on market $2,195,000 Active 18 DOM
-
2026-05-11$2,195,000 Active 1189-char remark
ⓘ Source: listings_history table (triggers on properties + properties_extension) + one-shot
backfill from property_details.listing_events for pre-trigger history.
Nearby sold comps map
Loading sold comps map…
Walkable amenities ~0.75 mi
Loading nearby amenities…
Taxation est. · year 1
- Rental income
- $362,076
- − Mortgage interest
- −$122,954
- − Property taxes
- −$32,925
- − Insurance
- −$10,975
- − Repairs & maintenance
- −$28,966
- − Management
- −$28,966
- − Depreciation
- −$63,855
- Taxable income
- $73,435
- Est. tax owed @ 24.0%
- −$17,624
- After-tax cash flow
- $86,386/yr
For passive investors: Depreciation is non-cash, so a rental often shows a tax loss while cash-flowing — sheltering income. Rental losses are passive: they offset passive income freely, and up to $25,000/yr can offset ordinary (W-2) income if you actively participate and your MAGI is under $100k (phasing out to $0 by $150k); unused losses carry forward. On sale, claimed depreciation is recaptured at up to 25%, and gains may owe capital-gains tax (a 1031 exchange can defer both). Figures are a year-1 estimate at your 24.0% rate — not tax advice; consult a CPA.
Condition & rehab AI · 12 photos
This multi-family property is in good condition with recent updates, making it a turnkey investment opportunity with strong cash flow.
Value-add opportunities
- Both Paint exterior trim — Enhances curb appeal and can increase both resale and rental value.
- Both Clean gutters — Improves drainage and can prevent water damage, increasing both resale and rental value.
Renovation cost estimate screening
Value-add ROI direction
- Both Paint exterior trim — Enhances curb appeal and can increase both resale and rental value. ↑
- Both Clean gutters — Improves drainage and can prevent water damage, increasing both resale and rental value. ↑
ⓘ Cost ranges are severity-bucket heuristics (US national rule-of-thumb). Get contractor quotes + a written scope before underwriting a rehab budget.
Schools (NCES district)
- District
- Colquitt County
- NCES district ID
- 1301380
- Math proficiency
- 29% ▼ -7.00%
- Reading proficiency
- 25% ▼ -5.00%
- Median HH income
- $32,950
- Composite
- 22.11/100
- National rank
- #8176
- State rank
- #117 of 174 in GA
Livability — Moultrie
- Score
- 60/100
- State rank
- #374
- US rank
- #18973
Category grades
Schools grade is shown separately in the Schools card above.
Census & demographics
- Census place
- Moultrie, GA
- Population (ZIP)
- 21,281
Population outlook (Colquitt County) Hauer SSP2
- Today (2025)
- 46,043 people
- By 2030
- 45,757 · -0.6%
- By 2040
- 44,929 · -2.4%
- By 2050
- 43,901 · -4.7%
- By 2075
- 40,831 · -11.3%
- By 2100
- 37,986 · -17.5%
Race, ethnicity, and origin ACS 2023
- Neighborhood character
- Diverse neighborhood (Simpson 0.61)
- Race & ethnicity
- White 51% Black 33% Hispanic / Latino 14% Two or more races 4% Native American 1%
- Hispanic origin (detail)
- Mexican 10% Puerto Rican 1% Cuban 2%
- Common ancestry
- Serbian 1% Italian 1% Lithuanian 1%
- Foreign-born
- 7% · Canada
- Languages at home
- 86% English-only · Spanish 13% German/W. Germanic 1%
Political lean MEDSL · Colquitt
- 2024 margin
- Solid R (+50.2) · D 24.8% · R 75.0%
- 2008→2024 swing
- -12.6pp toward R · 2008: -37.6pp · 2024: -50.2pp
- All cycles
- 2024: R+50.2 2020: R+47.2 2016: R+47.3 2012: R+39.6 2008: R+37.6
Not yet ingested
- Civics
- —
Market trends
- HPI YoY
- ▼ -93.21%
- Current HPI
- 188.988
- Rent YoY
- —
- Metro
- —
- State GDP YoY
- ▲ 2.66%
- F500 in state
- 28
Industry mix (Fortune 500 HQ in GA)
| Industry | F500 HQs | Revenue |
|---|---|---|
| Paper / Packaging | 2 | $29B |
|
||
| Retail | 1 | $160B |
|
||
| Transportation / Logistics | 1 | $91B |
|
||
| Airlines | 1 | $62B |
|
||
| Consumer Goods | 1 | $47B |
|
||
| Utilities | 1 | $25B |
|
||
Price history
1 event — show timeline
- 2026-05-11 Listed $2,195,000 SGMLS
Cash-flow waterfall
monthlySold comps — $/sqft
last 12 mo · ≤1 miLoading sold comps…