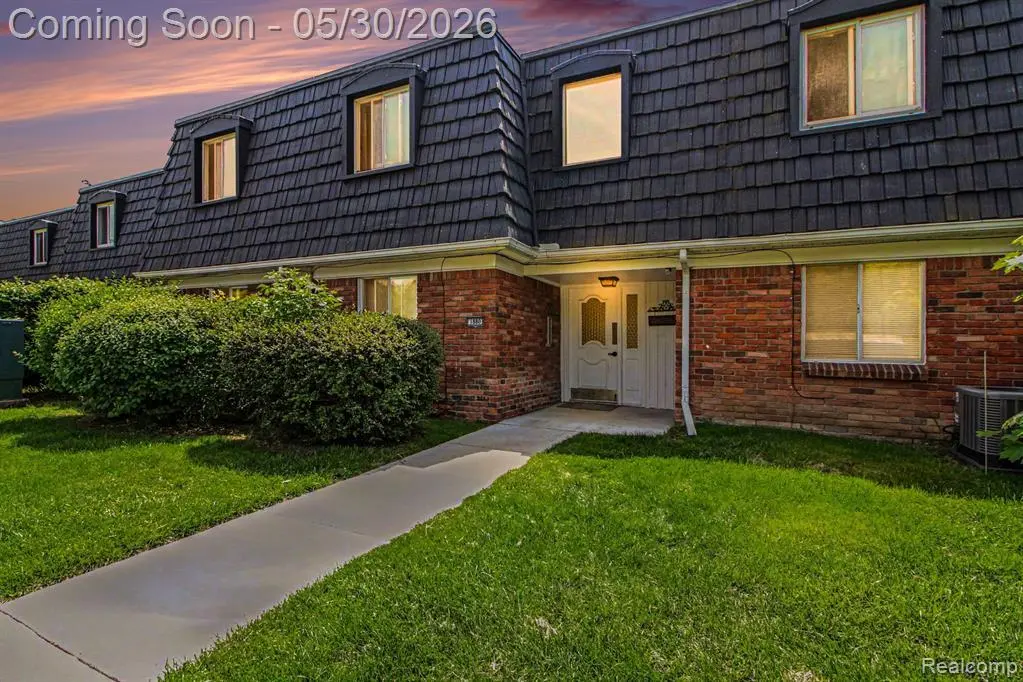
1880 Colonial Village Way · Pontiac, MI
Flood risk 1/10 · Minimal
- FEMA flood zone
- X (unshaded)
- Chance of flooding over 30 yrs
- 0.0%
- Est. flood insurance / yr
- $473 – $860
Fire risk 1/10 · Minimal
- Est. fire insurance / yr
- $784 – $1,456
Heat risk 2/10 · Minimal
- Hot days now (above 97°F)
- 7 days/yr
- Hot days in 30 yrs
- 15 days/yr
Wind risk 2/10 · Minimal
- Chance of severe wind over 30 yrs
- —
Air-quality risk 3/10 · Minor
- Unhealthy air days now
- 2 days/yr
- Unhealthy air days in 30 yrs
- 4 days/yr
Risk factors via First Street. Map © Google.
Why this score? — see what drove the B- grade
The composite is a weighted blend of 9 inputs, each scored 0–100. Each bar is that input's sub-score; the figure is the points it added to the 100-point composite (weight × sub-score).
- Cash flow +29.9/30.0
- 1% rule +10.0/10.0
- DSCR +10.0/10.0
- ARV discount +7.5/15.0
- Condition / age +3.8/5.0
- Livability +3.2/5.0
- Schools +3.0/10.0
- Rent growth +2.5/5.0
- Appreciation +0.0/10.0
$40,000
🖨 Deal sheet 📄 Offer letter ✓ Due diligence
Key facts
- $373 HOA
- Community pool
- Built 1968
Property features AI
Finance
- Other: Pet restrictions: call for details; Subdivision: Colonial Village; Located in Waterford Township
- HOA & community: Monthly association fee (approx. $373) includes lawn maintenance, water/sewer, exterior maintenance and clubhouse; Community amenities include clubhouse and on-site laundry facility; Association contact available
Exterior
- Parking: Carport; One parking space
- Utilities: Public water; Electric heating fuel; Electric water heater
- Home design: Condominium; Condo/Apartment on 2nd floor or above; Built in 1968; Slab foundation
- Construction: Aluminum and brick construction; Shaw/1968 construction date
- Exterior features: Aluminum and brick exterior; Exterior balcony; Inground pool; Pond; Paved street access
Interior
- Kitchen: Kitchen on the entry level (approx. 11 x 7); Range/Oven; Microwave; Dishwasher; Refrigerator
- Bedrooms: Primary bedroom located on the entry level (approx. 13 x 11)
- Bathrooms: One full bathroom located on the entry level (approx. 9 x 7)
- Heating & cooling: Baseboard heating; Central air conditioning; Ceiling fan(s)
- Interior features: Total of 5 rooms; Entry-level layout throughout
- Laundry & utility: Washer and Dryer included; Laundry facility available in the community
Neighborhood map
What this means for you Summary
Snapshot
- This is a 1-bed/1.0-bath condo listed at $40k. Condition is rated good.
Deal economics
- At list price, monthly cash flow is $148 ($2k/yr) — positive.
- The deal already cash-flows at list — no discount required.
- Meets the 1% rule at list price ($1k rent vs $40k).
- Cap rate 10.7% vs local median 6.7% in Pontiac — top-decile yield for the area; either an underpriced asset or a hidden risk that comps aren't pricing in. Stress-test before assuming the spread holds.
Location & tenants
- Location reads 64/100 on livability (#499 in MI) — a middle-class / working-renter tenant base. Strengths: commute A+, cost of living A+, housing A+; Watch: health & safety D, schools F, crime F.
- Waterford School District (suburban): math 26% / reading 42% proficiency, ranked #285 of 540 in MI (top 53%) — families likely to look elsewhere, expect single-tenant / working-renter base with shorter leases.
- Market conditions: 144 active listings in the ZIP; 4 comparable units currently listed for rent nearby; rentals lingering (median 44d on market — plan ~5-8 weeks vacancy on turnover, expect pricing pressure); 50% of comp listings sitting > 30 days — soft ceiling on asking rent; 2,614 units permitted in Oakland County in 2024 (721 in 5+ unit buildings).
- This rent is only 17% of the median local income ($72k/yr) — well below the 30% rent-burden line; pricing power to push rent on renewal without tenant pushback.
Forward outlook
- Local home prices are declining (-3.0%/yr); year-one equity from $277 of loan paydown is wiped out by about $1k of value loss. Plan a longer hold.
- Oakland County population projected at +10% by 2050 — modest demand growth; plan on rents tracking national, not racing it.
- At projected returns (-3.0% appreciation + 3.0% rent growth), your $11k cash investment doubles in ~8 years — after that, you're playing with house money.
Negotiation context
- Only 4 days on market — expect competitive offers; lowballing is unlikely to land.
- 2 sale attempts since 14y ago; this cycle's ask is 61% above the opening price — seller raised mid-cycle; expect resistance to lowballs.
Risks & watch-outs
- Watch-outs: HOA is 37% of rent.
Questions for the listing agent
- Built in 1968 — when were the roof, HVAC, electrical panel, plumbing, and water heater last replaced?
- What does the HOA fee cover, when was the last increase, and are there any pending special assessments or reserve-fund shortfalls?
- Any open or pending special assessments — roof, HVAC, plumbing, elevator, façade? What's the per-unit balance and payoff schedule, and is the seller paying it off at close or rolling it to the buyer?
- Is there a deadline driving the sale (1031 exchange, divorce, estate, relocation)? That informs how much negotiation room exists.
- Schools are F-rated, which usually means shorter tenancies and higher turnover. Who's the typical renter profile here, and what's been the actual vacancy rate?
- Crime grade is F in this area — have there been break-ins, vandalism, or insurance claims at this property in the last 3 years? What carrier currently insures it and at what premium?
- What's the average days-on-market for RENTAL listings here right now (not sales)? A rising rental-DOM trend means longer vacancies and softer asking-rent achievability than the comps imply.
- What's the recent tenant-quality profile in this submarket — average credit score on applications, eviction rate, late-payment / NSF rate, and stable-employment percentage? A property-management company in the area should have these aggregated.
- How much new apartment / multifamily construction is in the pipeline within 1–3 miles? Heavy new supply (>2% of stock underway) typically softens rents 12–24 months out; light construction supports rent growth.
Investment metrics
- 1% rule
- 2.52% ✓
- Cap rate
- 10.75%
- Cash-on-cash
- 15.90%
- DSCR
- 1.71
- GRM
- 3.3
CMA / ARV
No comps found within radius.
Projected returns pro-forma
-3.0% appreciation · 3.0% rent growth · sell at horizon
- IRR
- 7.3%
- Equity multiple
- 1.29×
- Total profit
- $3,216
- Equity at exit
- $5,964
- IRR
- 17.0%
- Equity multiple
- 2.43×
- Total profit
- $15,966
- Equity at exit
- $3,458
Cash invested: $11,200 (down + closing). Projections, not guarantees.
Landlord ↔ Tenant lean methodology
- Overall (STATE)
- 62 Landlord-Friendly
- State Michigan
- 62 Landlord-Friendly · EVEN
- County
- — inherits STATE
- City
- — inherits STATE
ZIP-level market 48328
- Active inventory
- 144
- Price-to-rent
- 3.3×
Monthly cashflow live
- Estimated rent
- $1,010 medium interval (Pro) →
- Mortgage (P&I)
- −$210
- Tax est. 1.5%
- −$50 /mo · $600/yr
- Insurance
- −$17
- HOA
- −$373
- Vacancy / Maint / Mgmt
- −$212
- Net cashflow
- $148
Break-even live
UW: 25.0% down · 7.5% · 30yr · 1.5% tax · 5.0% vac · 8.0% maint · 8.0% mgmt
Financing live
Cash to close
- Down payment
- $10,000
- Closing costs
- $1,200
- Reserves months
- —
- Total cash needed
- —
Loan-product check · same deal, 3 products live
Conventional
25% down · 7.5% · 30yr
- Down + closing
- —
- Monthly P&I
- —
- Monthly cashflow
- —
- DSCR
- —
- Eligible?
- —
Personal DTI + credit; lowest rate.
DSCR
20% down · 8.5% · 30yr
- Down + closing
- —
- Monthly P&I
- —
- Monthly cashflow
- —
- DSCR
- —
- Eligible?
- —
No personal income docs; deal must DSCR.
Hard money
10% down · 12.0% · 12mo
- Down + closing
- —
- Monthly P&I
- —
- Monthly cashflow
- —
- DSCR
- —
- Eligible?
- —
Short-term bridge; refi at stabilization.
Rent comps 4 comps
| Address | Beds | Baths | Sqft | Rent | $/sqft | DOM | Units | Dist |
|---|---|---|---|---|---|---|---|---|
| 3170 Dixie Hwy Waterford Twp, MI | 1.0 | 1.0 | 500 | $950 | $1.90 | 43d | 1 | 0.71mi |
| 950 Village Green Ln Waterford Twp, MI | 1.0–2.0 | 1.0–2.0 | 811 | $999 | $1.23 | 1d | 12 | 1.05mi |
| 995 N Cass Lake Rd #236 Waterford, MI | 1.0 | 1.0 | 639 | $975 | $1.53 | 43d | 1 | 1.15mi |
| 850 Williamsbury Ct Waterford Twp, MI | 1.0–2.0 | 1.0 | 812 | $1,099 | $1.35 | 1d | 25 | 1.32mi |
HOA detail condo
- Monthly dues
- $373 · $4,476/yr
- Assessments
- None detected in remarks — confirm with the listing agent.
Listing history 8 events
-
2026-06-02statusdays on market $40,000 Pending 4 DOM
-
2026-06-01days on market $40,000 Active 3 DOM
-
2026-05-31days on market $40,000 Active 2 DOM
-
2026-05-28historical $40,000
-
2012-12-06historical
-
2012-12-06historical
-
2012-10-24$24,900
-
2012-10-24$24,900
ⓘ Source: listings_history table (triggers on properties + properties_extension) + one-shot
backfill from property_details.listing_events for pre-trigger history.
Climate risk First Street
- Flood 1/10 Low FEMA zone X (unshaded) · 0% chance over 30 yrs
- Wildfire 1/10 Low
- Heat 2/10 Low 7 d/yr ≥97°F today · 15 d/yr by 30 yrs out
- Wind 2/10 Low
- Air quality 3/10 Moderate 2 unhealthy d/yr today · 4 by 30 yrs out
Nearby sold comps map
Loading sold comps map…
Walkable amenities ~0.75 mi
Loading nearby amenities…
Taxation est. · year 1
- Rental income
- $12,119
- − Mortgage interest
- −$2,241
- − Property taxes
- −$600
- − Insurance
- −$200
- − Repairs & maintenance
- −$970
- − Management
- −$970
- − HOA
- −$4,476
- − Depreciation
- −$1,164
- Taxable income
- $1,500
- Est. tax owed @ 24.0%
- −$360
- After-tax cash flow
- $1,421/yr
For passive investors: Depreciation is non-cash, so a rental often shows a tax loss while cash-flowing — sheltering income. Rental losses are passive: they offset passive income freely, and up to $25,000/yr can offset ordinary (W-2) income if you actively participate and your MAGI is under $100k (phasing out to $0 by $150k); unused losses carry forward. On sale, claimed depreciation is recaptured at up to 25%, and gains may owe capital-gains tax (a 1031 exchange can defer both). Figures are a year-1 estimate at your 24.0% rate — not tax advice; consult a CPA.
Condition & rehab AI · 12 photos
This condo is in good condition with cosmetic updates needed to modernize the kitchen and bathroom. The exterior is well-maintained, making it an attractive property for both resale and rental.
Repairs flagged
- Minor Kitchen cabinets — Dated and could be replaced for a fresh look
- Minor Bathroom fixtures — Simple and dated, could be replaced for a more modern look
Value-add opportunities
- Both Kitchen renovation — Freshens up the space and adds value
- Both Bathroom renovation — Modernizes the space and adds value
Renovation cost estimate screening
| Repair item | Severity | Est. cost |
|---|---|---|
| Kitchen cabinets · Dated and could be replaced for a fresh look | Minor | $500–3,000 |
| Bathroom fixtures · Simple and dated, could be replaced for a more modern look | Minor | $500–3,000 |
| Total estimated repair cost · 2 items | $1,000–6,000 |
Value-add ROI direction
- Both Kitchen renovation — Freshens up the space and adds value ↑
- Both Bathroom renovation — Modernizes the space and adds value ↑
ⓘ Cost ranges are severity-bucket heuristics (US national rule-of-thumb). Get contractor quotes + a written scope before underwriting a rehab budget.
Schools (NCES district)
- District
- Waterford School District
- NCES district ID
- 2635310
- Math proficiency
- 26% ▼ -5.00%
- Reading proficiency
- 42% ▼ -1.00%
- Median HH income
- $55,581
- Composite
- 29.99/100
- National rank
- #6364
- State rank
- #285 of 540 in MI
Livability — Pontiac
- Score
- 64/100
- State rank
- #499
- US rank
- #14703
Category grades
Schools grade is shown separately in the Schools card above.
Census & demographics
- County
- Oakland County · 1,009,092 people
- City population
- 44,593
- Metro
- Detroit-Warren-Dearborn, MI
- Population (ZIP)
- 24,478
- Household income
- $72,299
- Rent vs Own
- Severe rent burden
- 1013.0
Population outlook (Oakland County) Hauer SSP2
- Today (2025)
- 1,335,747 people
- By 2030
- 1,375,100 · +2.9%
- By 2040
- 1,435,385 · +7.5%
- By 2050
- 1,469,250 · +10.0%
- By 2075
- 1,531,946 · +14.7%
- By 2100
- 1,450,485 · +8.6%
Race, ethnicity, and origin ACS 2023
- Neighborhood character
- Predominantly White (73%)
- Race & ethnicity
- White 73% Hispanic / Latino 10% Two or more races 9% Black 9% Asian 2%
- Hispanic origin (detail)
- Mexican 7% Puerto Rican 1%
- Common ancestry
- Romanian 7% Lithuanian 3% Slovak 3%
- Foreign-born
- 6% · Canada
- Languages at home
- 90% English-only · Spanish 4% Other Asian/Pacific 2% Russian/Polish/Slavic 2%
Political lean MEDSL · Oakland
- 2024 margin
- D (+10.6) · D 54.4% · R 43.8% · Other 1.9%
- 2008→2024 swing
- -3.9pp toward R · 2008: 14.5pp · 2024: 10.6pp
- All cycles
- 2024: D+10.6 2020: D+14.1 2016: D+8.1 2012: D+8.1 2008: D+14.5
Not yet ingested
- Civics
- —
Market trends
- HPI YoY
- ▼ -249.13%
- Current HPI
- 191.2771
- Rent YoY
- —
- Metro
- Detroit-Warren-Dearborn, MI
- State GDP YoY
- ▲ 1.37%
- F500 in state
- 28
Industry mix (Fortune 500 HQ in MI)
| Industry | F500 HQs | Revenue |
|---|---|---|
| Automotive Parts | 3 | $48B |
|
||
| Automotive | 2 | $372B |
|
||
| Chemicals | 1 | $45B |
|
||
| Automotive Retail | 1 | $29B |
|
||
| Healthcare / Medical Devices | 1 | $23B |
|
||
| Automotive Technology | 1 | $20B |
|
||
Price history
+60.6% since first listed5 events — show timeline
- 2026-05-28 Coming Soon $40,000 MiRealSource-MiMLS
- 2012-12-06 Listing Removed — REALCOMP
- 2012-12-06 Listing Removed — MiRealSource-MiMLS
- 2012-10-24 Listed $24,900 REALCOMP
- 2012-10-24 Listed $24,900 MiRealSource-MiMLS
Cash-flow waterfall
monthlySold comps — $/sqft
last 12 mo · ≤1 miLoading sold comps…