 Multi-family
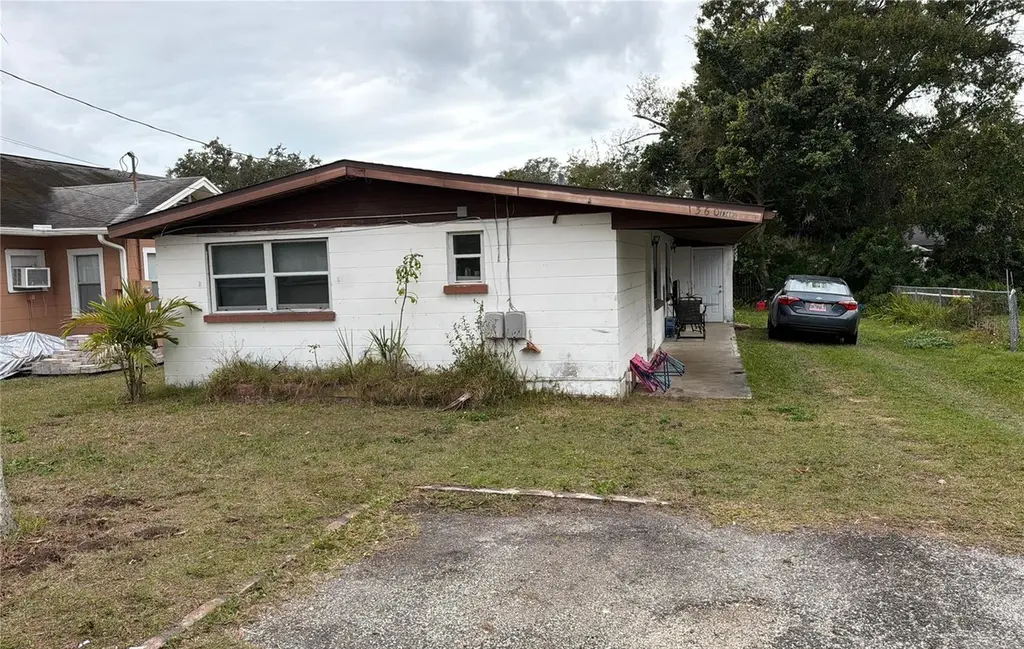
1360 S Washington Ave · Clearwater, FL
Flood risk 1/10 · Minimal
- FEMA flood zone
- X (unshaded)
- Chance of flooding over 30 yrs
- 0.0%
- Est. flood insurance / yr
- $507 – $1,088
Fire risk 1/10 · Minimal
- Est. fire insurance / yr
- $947 – $1,759
Heat risk 10/10 · Severe
- Hot days now (above 107°F)
- 7 days/yr
- Hot days in 30 yrs
- 24 days/yr
Wind risk 10/10 · Severe
- Chance of severe wind over 30 yrs
- 99.0%
Air-quality risk 3/10 · Minor
- Unhealthy air days now
- 2 days/yr
- Unhealthy air days in 30 yrs
- 3 days/yr
Risk factors via First Street. Map © Google.
Why this score? — see what drove the F grade
The composite is a weighted blend of 9 inputs, each scored 0–100. Each bar is that input's sub-score; the figure is the points it added to the 100-point composite (weight × sub-score).
- Cash flow +13.4/30.0
- Schools +4.3/10.0
- Livability +4.1/5.0
- DSCR +4.0/10.0
- 1% rule +3.5/10.0
- Condition / age +2.5/5.0
- Rent growth +1.9/5.0
- ARV discount +0.0/15.0
- Appreciation +0.0/10.0
$345,000
🖨 Deal sheet (PDF) 📄 Offer letter ✓ Due diligence
Multi-family units
County records classify this as Multi-Family (2-4 Unit). Listing-text estimate: 1 unit. estimate disagrees with records
Listing remarks
Under contract-accepting backup offers. Amazing investment opportunity. DUPLEX in Clearwater Florida. Both Units Leased (Clearwater Housing) and professionally managed. Gross CAP 12 AGI $42,000. This is your chance to own a great investment opportunity, repairs are minimal, income potential is great! Each unit is a 1/1 with living room and kitchen, shared parking and yard area. Both units occupied. Please do not distub residents. Sold AS IS
Key facts
- Shared parking
- Both units leased
- Yard area
Tags
Property features AI
Finance
- Other: Property type: Residential, Single Family Residence; Total living area reported as 1,092 (source: public records); Total building area reported as 1,422; Lot size approximately 0.12 acres (50 x 103); Universal property identifier available
- Financial info: No lease restrictions; Tax information and other financial details omitted
- HOA & community: No HOA; No association approval required
Exterior
- Parking: No parking details provided
- Security: No security features listed
- Utilities: Public water; Public sewer; Other utilities (unspecified)
- Home design: Single family residence; Completed condition; One story; North-facing
- Construction: Block construction; Shingle roof; Slab foundation; Built on a 0.12-acre (50 x 103) lot
- Exterior features: Asphalt road access
Interior
- Kitchen: Appliances listed as Other
- Bedrooms: 2 bedrooms
- Flooring: Other flooring (unspecified)
- Bathrooms: 2 full bathrooms
- Heating & cooling: Electric heating; Mini-split cooling units
- Interior features: No additional interior features listed; Other appliances (unspecified)
- Laundry & utility: No laundry features
Neighborhood map
What this means for you Summary
Snapshot
- This is a 2-bed/2.0-bath multifamily listed at $345k.
Deal economics
- At list price, monthly cash flow is $4 ($52/yr) — positive.
- The deal already cash-flows at list — no discount required.
- To meet the 1% rule (rent ≥ 1% of price), the offer needs to be $295k (14.6% below list).
- Recommended offer: $295k (14.6% below list) — sets the bar for 1% rule.
- Cap rate 6.3% vs local median 3.0% in Clearwater — top-decile yield for the area; either an underpriced asset or a hidden risk that comps aren't pricing in. Stress-test before assuming the spread holds.
Location & tenants
- Location reads 82/100 on livability (#60 in FL, #988 nationally) — a professional / high-income tenant draw. Strengths: commute A+, housing A+, health & safety A+; Watch: schools C-, employment C-.
- Pinellas (suburban): math 51% / reading 51% proficiency, ranked #31 of 73 in FL (top 42%) — acceptable for families but not a draw, mixed tenant base, ~2y average lease.
- Market conditions: Rents soft (-2.2%/yr); 363 active listings in the ZIP; 40 comparable units currently listed for rent nearby; rentals at typical pace (median 22d on market — plan ~3-4 weeks tenant-placement turnaround); 2,676 units permitted in Pinellas County in 2024 (1,422 in 5+ unit buildings).
- At $2,947/mo this rent would consume 57% of the median local household income ($62k/yr) (locally 1868% of renters already pay >50% of income on rent) — very limited rent-growth headroom before tenants either downsize or default.
Forward outlook
- Local home prices are declining (-3.0%/yr); year-one equity from $2k of loan paydown is wiped out by about $10k of value loss. Plan a longer hold.
- Pinellas County population projected at +14% by 2050 — modest demand growth; plan on rents tracking national, not racing it.
Negotiation context
- It's been on market 24 days — a 2% lower offer ($340k) is reasonable based on typical stale-listing flexibility.
- 2 sale attempts since 4y ago with the ask held roughly flat each time — persistent listings suggest the price (not the market) is what's stuck; bring a comps-based counter.
- Current owner paid $280k; 23% above their basis — modest negotiation headroom, anchor on the comps not their cost.
Risks & watch-outs
- Watch-outs: built in 1956 — expect roof / HVAC / electrical / plumbing capex.
- Climate carrying-cost: severe wind risk, 99% chance of damaging wind over 30y; extreme-heat days projected 7→24/yr by 2055 (HVAC capex compounding) — expect insurance premiums to compound above CPI over the hold.
Questions for the listing agent
- Built in 1956 — when were the roof, HVAC, electrical panel, plumbing, and water heater last replaced?
- Is there a deadline driving the sale (1031 exchange, divorce, estate, relocation)? That informs how much negotiation room exists.
- The area grade is low — what's the realistic commute time and amenity access for the typical tenant pool here? Any planned neighborhood developments (good or bad) we should know about?
- What's the average days-on-market for RENTAL listings here right now (not sales)? A rising rental-DOM trend means longer vacancies and softer asking-rent achievability than the comps imply.
- What's the recent tenant-quality profile in this submarket — average credit score on applications, eviction rate, late-payment / NSF rate, and stable-employment percentage? A property-management company in the area should have these aggregated.
- How much new apartment / multifamily construction is in the pipeline within 1–3 miles? Heavy new supply (>2% of stock underway) typically softens rents 12–24 months out; light construction supports rent growth.
Investment metrics
- 1% rule
- 0.85% ✗
- Cap rate
- 6.31%
- Cash-on-cash
- 0.05%
- DSCR
- 1.00
- GRM
- 9.8
CMA / ARV
- ARV (on-the-fly)
- $281,736
- Comps found
- 1
Show comp detail 1 sale within ~0.75 mi
| Address | Dist | Beds/Ba | Sqft | Sold | Price | $/sf | Match |
|---|---|---|---|---|---|---|---|
| 1538 S Martin Luther King JR | 0.45mi | 3/2.0 (+1) | 1,050 (-4%) | 6mo | $271,000 | $258 | 63 |
Match score weights: distance 35% · size 25% · config 20% · recency 20%. Top-matched comps best support the ARV.
Projected returns pro-forma
-3.0% appreciation · 0.0% rent growth · sell at horizon
- IRR
- -19.6%
- Equity multiple
- 0.33×
- Total profit
- $-64,257
- Equity at exit
- $51,441
- IRR
- -20.1%
- Equity multiple
- 0.08×
- Total profit
- $-88,943
- Equity at exit
- $29,829
Cash invested: $96,600 (down + closing). Projections, not guarantees.
Landlord ↔ Tenant lean methodology
- Overall (STATE)
- 87 Strongly Landlord-Friendly
- State Florida
- 87 Strongly Landlord-Friendly · R+3
- County
- — inherits STATE
- City
- — inherits STATE
ZIP-level market 33756
- Rents YoY
- -2.2%
- Active inventory
- 363
- Price-to-rent
- 19.5×
Monthly cashflow live
- Estimated rent
- $2,947 high interval (Pro) →
- Mortgage (P&I)
- −$1,809
- Tax from tax record
- −$371 /mo · $4,450/yr
- Insurance
- −$144
- HOA
- −$0
- Vacancy / Maint / Mgmt
- −$619
- Net cashflow
- $4
Break-even live
Sensitivity live
| Price | -10% $200 | -5% $102 | +0% $4 | +5% $-93 | +10% $-191 |
|---|---|---|---|---|---|
| Rent | -10% $-228 | -5% $-112 | +0% $4 | +5% $121 | +10% $237 |
| Rate | -1.0pp $178 | -0.5pp $92 | base $4 | +0.5pp $-85 | +1.0pp $-176 |
2-unit breakdown (identical units grouped — click to expand)
| Units | Beds | Baths | Est. rent |
|---|---|---|---|
| 2× units | 1 | 1 | $2,946 |
| #1 | 1 | 1 | $1,473 |
| #2 | 1 | 1 | $1,473 |
| Total (2 units) | $2,947 | ||
UW: 25.0% down · 7.5% · 30yr · 1.5% tax · 5.0% vac · 8.0% maint · 8.0% mgmt
Financing live
Cash to close
- Down payment
- $86,250
- Closing costs
- $10,350
- Reserves months
- —
- Total cash needed
- —
Loan-product check · same deal, 3 products live
Conventional
25% down · 7.5% · 30yr
- Down + closing
- —
- Monthly P&I
- —
- Monthly cashflow
- —
- DSCR
- —
- Eligible?
- —
Personal DTI + credit; lowest rate.
DSCR
20% down · 8.5% · 30yr
- Down + closing
- —
- Monthly P&I
- —
- Monthly cashflow
- —
- DSCR
- —
- Eligible?
- —
No personal income docs; deal must DSCR.
Hard money
10% down · 12.0% · 12mo
- Down + closing
- —
- Monthly P&I
- —
- Monthly cashflow
- —
- DSCR
- —
- Eligible?
- —
Short-term bridge; refi at stabilization.
Rent comps 40 comps
| Address | Beds | Baths | Sqft | Rent | $/sqft | DOM | Units | Dist |
|---|---|---|---|---|---|---|---|---|
| 1119 Tuskawilla Dr Clearwater, FL | 2.0 | 1.0 | 603 | $1,500 | $2.49 | 3d | 23 | 0.25mi |
| 1530 S Martin Luther King Jr Ave Clearwater, FL | 3.0 | 2.0 | 1025 | $1,995 | $1.95 | 12d | 1 | 0.40mi |
| 1530 S Martin Luther King Jr Ave Clearwater, FL | 3.0 | 2.0 | 1025 | $1,950 | $1.90 | 25d | 1 | 0.40mi |
| 1245 S Martin Luther King Jr Ave #104 Clearwater, FL | 2.0 | 2.0 | 1120 | $1,495 | $1.33 | 5d | 1 | 0.40mi |
| 1532 S Washington Ave Clearwater, FL | 3.0 | 2.0 | 954 | $1,500 | $1.57 | 5d | 1 | 0.41mi |
| 1319 Boylan Ave Clearwater, FL | 2.0 | 1.0 | 800 | $1,550 | $1.94 | 25d | 1 | 0.41mi |
| 1224 S Missouri Ave #903 Clearwater, FL | 1.0 | 1.0 | 730 | $2,250 | $3.08 | 25d | 1 | 0.46mi |
| 1216 S Missouri Ave Clearwater, FL | 1.0–2.0 | 1.0–2.0 | 835 | $2,100 | $2.51 | 25d | 5 | 0.46mi |
| 1216 S Missouri Ave Clearwater, FL | 1.0–2.0 | 1.0–2.0 | 835 | $2,000 | $2.40 | 3d | 6 | 0.46mi |
| 629 Wildwood Way Clearwater, FL | 2.0 | 1.0 | 768 | $1,400 | $1.82 | 21d | 1 | 0.48mi |
| 627 Wildwood Way Clearwater, FL | 2.0 | 1.0 | 768 | $1,400 | $1.82 | 21d | 1 | 0.48mi |
| 625 Wildwood Way Clearwater, FL | 2.0 | 1.0 | 768 | $1,400 | $1.82 | 21d | 1 | 0.49mi |
| 1574 Ewing Ave Clearwater, FL | 3.0 | 2.0 | 1324 | $2,700 | $2.04 | 5d | 1 | 0.51mi |
| 1562 S Jefferson Ave Clearwater, FL | 1.0 | 1.0 | 870 | $1,250 | $1.44 | 18d | 1 | 0.53mi |
| 1128 Belleair Rd Unit Home Clearwater, FL | 3.0 | 1.0 | 1326 | $1,695 | $1.28 | 25d | 1 | 0.54mi |
| 811 Lotus Path Unit 2 Clearwater, FL | 2.0 | 1.0 | 700 | $1,699 | $2.43 | 25d | 1 | 0.58mi |
| 1516 Carmel Ave Clearwater, FL | 2.0 | 1.0 | 740 | $1,650 | $2.23 | 5d | 1 | 0.58mi |
| 1552 S Myrtle Ave Clearwater, FL | 3.0 | 2.0 | 900 | $1,950 | $2.17 | 9d | 1 | 0.59mi |
| 1552 S Myrtle Ave Clearwater, FL | 2.0 | 1.5 | 750 | $1,750 | $2.33 | 16d | 1 | 0.59mi |
| 1571 S Myrtle Ave Clearwater, FL | 3.0 | 2.0 | 1202 | $2,400 | $2.00 | 25d | 1 | 0.60mi |
| 1353 Lakeview Rd Clearwater, FL | 3.0 | 1.0 | 1360 | $1,995 | $1.47 | 25d | 1 | 0.60mi |
| 1523 S Fredrica Ave Clearwater, FL | 3.0 | 2.0 | 1284 | $2,550 | $1.99 | 25d | 1 | 0.60mi |
| 915 Ewing Ave Clearwater, FL | 2.0 | 1.0 | 752 | $1,400 | $1.86 | 25d | 1 | 0.63mi |
| 1406 Lemon St Clearwater, FL | 2.0 | 1.5 | 1020 | $1,990 | $1.95 | 25d | 1 | 0.71mi |
| 423 Wildwood Way Belleair, FL | 2.0 | 1.0 | 1277 | $2,045 | $1.60 | 5d | 1 | 0.71mi |
| 1007 Hawkins St Unit A Clearwater, FL | 2.0 | 1.0 | 784 | $1,845 | $2.35 | 25d | 1 | 0.73mi |
| 713 Smith St Clearwater, FL | 1.0 | 1.0 | 814 | $1,595 | $1.96 | 4d | 1 | 0.76mi |
| 833 Hall St Clearwater, FL | 1.0 | 1.0 | 700 | $1,350 | $1.93 | 25d | 1 | 0.78mi |
| 833 Hall St Clearwater, FL | 1.0 | 1.0 | 700 | $1,350 | $1.93 | 18d | 1 | 0.78mi |
| 701 S Madison Ave Unit 1545916P Clearwater, FL | 2.0 | 2.0 | 1237 | $1,935 | $1.56 | 15d | 1 | 0.78mi |
| 701 S Madison Ave Clearwater, FL | 2.0 | 2.0 | 965 | $1,998 | $2.07 | 4d | 6 | 0.78mi |
| 1632 Clearwater Largo Rd Clearwater, FL | 3.0 | 1.0–2.0 | 961 | $2,499 | $2.60 | 3d | 25 | 0.79mi |
| 1009 Chester Dr Clearwater, FL | 3.0 | 2.0 | 1105 | $2,500 | $2.26 | 13d | 1 | 0.79mi |
| 1310 Bayview Dr Clearwater, FL | 3.0 | 2.0 | 1500 | $3,300 | $2.20 | 25d | 1 | 0.81mi |
| 612 Sally Ln S Unit 14 Clearwater, FL | 1.0 | 1.0 | 750 | $1,500 | $2.00 | 25d | 1 | 0.83mi |
| 711 S Lincoln Ave Clearwater, FL | 1.0–2.0 | 1.0 | 860 | $1,660 | $1.93 | 3d | 8 | 0.86mi |
| 1432 Lotus Path Clearwater, FL | 2.0 | 1.0 | 900 | $1,750 | $1.94 | 12d | 1 | 0.88mi |
| 1100 Turner St Clearwater, FL | 1.0 | 1.5 | 900 | $1,750 | $1.94 | 4d | 2 | 0.89mi |
| 1221 Court St Unit 1 Clearwater, FL | 2.0 | 1.0 | 1000 | $1,800 | $1.80 | 25d | 1 | 0.96mi |
| 1412 Druid Rd E Clearwater, FL | 3.0 | 1.0 | 1239 | $1,995 | $1.61 | 25d | 1 | 1.00mi |
Listing history 12 events
-
2026-05-08status Pending
-
2026-04-14$345,000 Active
-
2026-01-05soldstatus $280,000
-
2022-10-24soldstatus $228,000
-
2022-09-01status Pending
-
2022-09-01historical
-
2022-08-27price $219,000
-
2022-07-30$270,000 Active
-
2000-01-20soldstatus $24,600
-
1987-04-01soldstatus $49,000
-
1986-08-08soldstatus $35,000
-
1984-07-01soldstatus $20,000
ⓘ Source: listings_history table (triggers on properties + properties_extension) + one-shot
backfill from property_details.listing_events for pre-trigger history.
Tax reassessment forecast FL · Resets to sale price
- Current annual tax
- $4,450 · $371/mo
- Projected year-2 tax
- $4,450 · $371/mo
- Expected delta
- $0/yr ($0/mo · 0.0%)
ⓘ Screening estimate from a state-policy table — verify with the county assessor before closing.
Climate risk First Street
- Flood 1/10 Low FEMA zone X (unshaded) · 0% chance over 30 yrs
- Wildfire 1/10 Low
- Heat 10/10 Extreme 7 d/yr ≥107°F today · 24 d/yr by 30 yrs out
- Wind 10/10 Extreme 99% chance of damaging wind over 30 yrs
- Air quality 3/10 Moderate 2 unhealthy d/yr today · 3 by 30 yrs out
Nearby sold comps map
Loading sold comps map…
Walkable amenities ~0.75 mi
Loading nearby amenities…
Taxation est. · year 1
- Rental income
- $35,364
- − Mortgage interest
- −$19,325
- − Property taxes
- −$4,450
- − Insurance
- −$1,725
- − Repairs & maintenance
- −$2,829
- − Management
- −$2,829
- − Depreciation
- −$10,036
- Taxable loss
- −$5,831
- Est. tax savings @ 24.0%
- +$1,399
- After-tax cash flow
- $1,452/yr
For passive investors: Depreciation is non-cash, so a rental often shows a tax loss while cash-flowing — sheltering income. Rental losses are passive: they offset passive income freely, and up to $25,000/yr can offset ordinary (W-2) income if you actively participate and your MAGI is under $100k (phasing out to $0 by $150k); unused losses carry forward. On sale, claimed depreciation is recaptured at up to 25%, and gains may owe capital-gains tax (a 1031 exchange can defer both). Figures are a year-1 estimate at your 24.0% rate — not tax advice; consult a CPA.
Schools (NCES district)
- District
- Pinellas
- NCES district ID
- 1201560
- Math proficiency
- 51% ▼ -5.00%
- Reading proficiency
- 51% ▼ -3.00%
- Median HH income
- $46,270
- Composite
- 43.27/100
- National rank
- #3046
- State rank
- #31 of 73 in FL
Livability — Clearwater
- Score
- 82/100
- State rank
- #60
- US rank
- #988
Category grades
Schools grade is shown separately in the Schools card above.
Census & demographics
- Census place
- Clearwater, FL
- County
- Pinellas County · 939,478 people
- City population
- 170,933
- Metro
- Tampa-St. Petersburg-Clearwater, FL
- Population (ZIP)
- 32,201
- Household income
- $61,872
- Rent vs Own
- Severe rent burden
- 1868.0
Population outlook (Pinellas County) Hauer SSP2
- Today (2025)
- 1,027,532 people
- By 2030
- 1,063,586 · +3.5%
- By 2040
- 1,125,020 · +9.5%
- By 2050
- 1,168,637 · +13.7%
- By 2075
- 1,265,188 · +23.1%
- By 2100
- 1,260,357 · +22.7%
Race, ethnicity, and origin ACS 2023
- Neighborhood character
- Majority White (64%)
- Race & ethnicity
- White 64% Hispanic / Latino 18% Black 11% Two or more races 9% Asian 3%
- Hispanic origin (detail)
- Mexican 8% Puerto Rican 5%
- Common ancestry
- Romanian 3% Lithuanian 2% Slovak 2%
- Foreign-born
- 16% · Canada
- Languages at home
- 79% English-only · Spanish 14% Other Indo-European 2% Russian/Polish/Slavic 2%
Political lean MEDSL · Pinellas
- 2024 margin
- Lean R (+5.2) · D 46.9% · R 52.1%
- 2008→2024 swing
- -13.5pp toward R · 2008: 8.3pp · 2024: -5.2pp
- All cycles
- 2024: R+5.2 2020: D+0.2 2016: R+1.1 2012: D+5.6 2008: D+8.3
Not yet ingested
- Civics
- —
Market trends
- HPI YoY
- ▼ -438.74%
- Current HPI
- 354.6792
- Rent YoY
- ▼ -2.22%
- Metro
- Tampa-St. Petersburg-Clearwater, FL
- State GDP YoY
- ▲ 3.28%
- F500 in state
- 36
Industry mix (Fortune 500 HQ in FL)
| Industry | F500 HQs | Revenue |
|---|---|---|
| Industrial Technology | 2 | $29B |
|
||
| Insurance | 2 | $17B |
|
||
| Retail | 1 | $60B |
|
||
| Technology Distribution | 1 | $58B |
|
||
| Homebuilding | 1 | $35B |
|
||
| Technology Manufacturing | 1 | $35B |
|
||
Price history
+1625.0% since first listed12 events — show timeline
- 2026-05-08 Pending — Stellar MLS as Distributed by MLS Grid
- 2026-04-14 Listed $345,000 Stellar MLS as Distributed by MLS Grid
- 2026-01-05 Sold (Public Records) $280,000 Public Records
- 2022-10-24 Sold (Public Records) $228,000 Public Records
- 2022-09-01 Pending — Stellar MLS as Distributed by MLS Grid
- 2022-09-01 Listing Removed — Stellar MLS as Distributed by MLS Grid
- 2022-08-27 Price Changed $219,000 Stellar MLS as Distributed by MLS Grid
- 2022-07-30 Listed $270,000 Stellar MLS as Distributed by MLS Grid
- 2000-01-20 Sold (Public Records) $24,600 Public Records
- 1987-04-01 Sold (Public Records) $49,000 Public Records
- 1986-08-08 Sold (Public Records) $35,000 Public Records
- 1984-07-01 Sold (Public Records) $20,000 Public Records
Property tax history
+14.5%/yrLatest (2025): $4,450 · +11.4% YoY. Source: county tax records.
Cash-flow waterfall
monthlySold comps — $/sqft
last 12 mo · ≤1 miLoading sold comps…