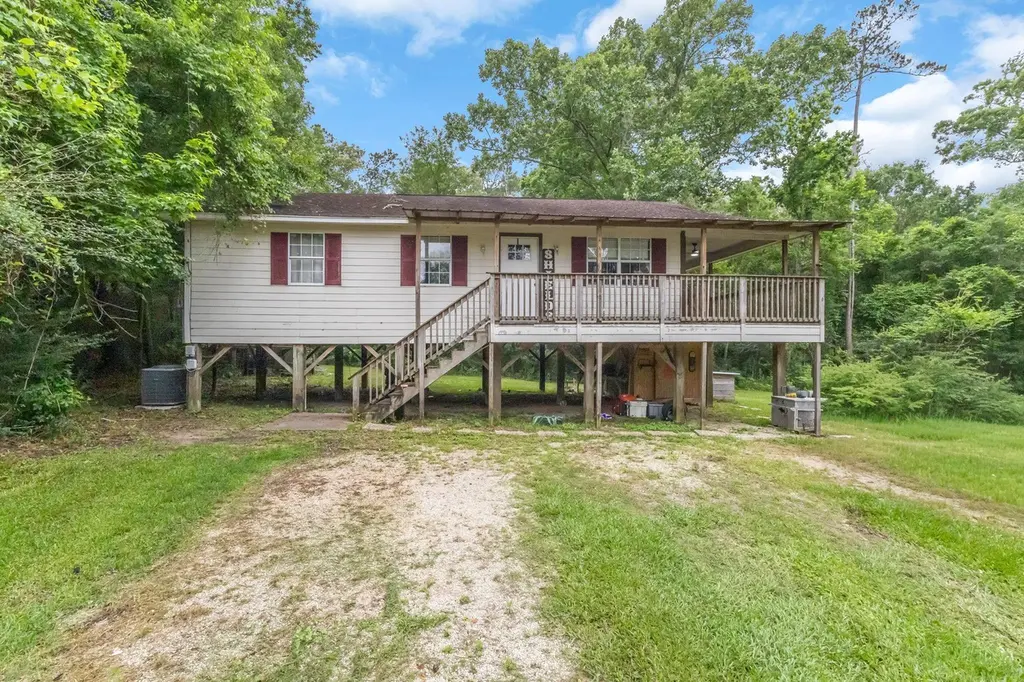
121 Private Road 8382 · Evadale, TX
Flood risk 1/10 · Minimal
- FEMA flood zone
- A
- Chance of flooding over 30 yrs
- 0.0%
- Est. flood insurance / yr
- $1,009 – $1,996
Fire risk 4/10 · Minor
- Est. fire insurance / yr
- $1,222 – $2,270
Heat risk 9/10 · Severe
- Hot days now (above 112°F)
- 7 days/yr
- Hot days in 30 yrs
- 23 days/yr
Wind risk 9/10 · Severe
- Chance of severe wind over 30 yrs
- 99.0%
Air-quality risk 2/10 · Minimal
- Unhealthy air days now
- 1 days/yr
- Unhealthy air days in 30 yrs
- 1 days/yr
Risk factors via First Street. Map © Google.
Why this score? — see what drove the C- grade
The composite is a weighted blend of 9 inputs, each scored 0–100. Each bar is that input's sub-score; the figure is the points it added to the 100-point composite (weight × sub-score).
- Cash flow +16.0/30.0
- ARV discount +7.5/15.0
- Appreciation +5.7/10.0
- DSCR +4.9/10.0
- 1% rule +4.4/10.0
- Schools +3.9/10.0
- Livability +3.7/5.0
- Rent growth +2.5/5.0
- Condition / age +2.2/5.0
$90,000
🖨 Deal sheet 📄 Offer letter ✓ Due diligence
Listing remarks MLS
Great location in Evadale, TX for this 2 bedroom , 1 bath home. With good proximity to FM 105 and Hwy 96, this is great for a commuter to Orange, Beaumont or Port Arthur. The property has plenty of area under the home for storage and boasts a nice porch overlooking the yard. Less than 5 minutes to Evadale schools.
Key facts
- Nice porch
- Overlooking the yard
- Great location
Tags
Neighborhood map
What this means for you Summary
Snapshot
- This is a 2-bed/1.0-bath single-family listed at $90k. Condition is rated fair.
Deal economics
- At list price, monthly cash flow is $-81 ($-975/yr) — negative.
- To cash-flow at today's rent, offer at most $78k (13.1% below list).
- To meet the 1% rule (rent ≥ 1% of price), the offer needs to be $84k (6.3% below list).
- Recommended offer: $78k (13.1% below list) — sets the bar for cash-flow.
Location & tenants
- Location reads 73/100 on livability (#205 in TX) — a middle-class / working-renter tenant base. Strengths: employment A+, cost of living A+, housing A+; Watch: amenities F, commute F.
- Evadale ISD (rural): math 38% / reading 46% proficiency, ranked #609 of 1,141 in TX (top 53%) — families likely to look elsewhere, expect single-tenant / working-renter base with shorter leases.
- Market conditions: 10 active listings in the ZIP; 45 units permitted in Jasper County in 2024 (0 in 5+ unit buildings).
Forward outlook
- In year one you build about $2k of equity ($622 loan paydown + $1k appreciation (1.4% local appreciation)).
- Jasper County population projected at -15% by 2050 — secular population decline; favor cash flow + early exit over multi-decade hold.
Negotiation context
- Only 1 days on market — expect competitive offers; lowballing is unlikely to land.
Risks & watch-outs
- Watch-outs: flood insurance adds $125/mo.
- Climate carrying-cost: in FEMA flood zone A (mandatory federal flood insurance); severe wind risk, 99% chance of damaging wind over 30y; extreme-heat days projected 7→23/yr by 2055 (HVAC capex compounding) — expect insurance premiums to compound above CPI over the hold.
Questions for the listing agent
- What do current leases actually rent for vs. the listed asking? Can we see a recent rent roll and the last 12 months of T-12 income?
- Have any recent inspections been done? Can we get a copy of the seller's disclosures and any deferred-maintenance estimates?
- What's the actual annual flood-insurance premium (NFIP or private), and is the property in a SFHA with mandatory coverage?
- Is there a deadline driving the sale (1031 exchange, divorce, estate, relocation)? That informs how much negotiation room exists.
- Schools are B-rated — typically a magnet for longer-tenancy family renters. What's the average tenant stay here, and is there a school-zone premium baked into asking?
- What's the average days-on-market for RENTAL listings here right now (not sales)? A rising rental-DOM trend means longer vacancies and softer asking-rent achievability than the comps imply.
- What's the recent tenant-quality profile in this submarket — average credit score on applications, eviction rate, late-payment / NSF rate, and stable-employment percentage? A property-management company in the area should have these aggregated.
- How much new for-sale + rental construction is in the pipeline within 1–3 miles? Heavy new supply typically softens prices + rents 12–24 months out; constrained supply supports both.
Investment metrics
- 1% rule
- 0.94% ✗
- Cap rate
- 6.88%
- Cash-on-cash
- 2.09%
- DSCR
- 1.09
- GRM
- 8.9
CMA / ARV
No comps found within radius.
Projected returns pro-forma
1.44% appreciation · 3.0% rent growth · sell at horizon
- IRR
- -1.1%
- Equity multiple
- 0.94×
- Total profit
- $-1,440
- Equity at exit
- $32,814
- IRR
- 3.6%
- Equity multiple
- 1.47×
- Total profit
- $11,808
- Equity at exit
- $45,270
Cash invested: $25,200 (down + closing). Projections, not guarantees.
Landlord ↔ Tenant lean methodology
- Overall (STATE)
- 87 Strongly Landlord-Friendly
- State Texas
- 87 Strongly Landlord-Friendly · R+5
- County
- — inherits STATE
- City
- — inherits STATE
ZIP-level market 77615
- Home prices YoY
- 1.8%
- Active inventory
- 10
- Price-to-rent
- 8.9×
Monthly cashflow live
- Estimated rent
- $843 medium interval (Pro) →
- Mortgage (P&I)
- −$472
- Tax est. 1.5%
- −$112 /mo · $1,350/yr
- Insurance
- −$38
- Flood insurance flood zone
- −$125 /mo · $1,502/yr
- HOA
- −$0
- Vacancy / Maint / Mgmt
- −$177
- Net cashflow
- $-81
Break-even live
UW: 25.0% down · 7.5% · 30yr · 1.5% tax · 5.0% vac · 8.0% maint · 8.0% mgmt
Financing live
Cash to close
- Down payment
- $22,500
- Closing costs
- $2,700
- Reserves months
- —
- Total cash needed
- —
Loan-product check · same deal, 3 products live
Conventional
25% down · 7.5% · 30yr
- Down + closing
- —
- Monthly P&I
- —
- Monthly cashflow
- —
- DSCR
- —
- Eligible?
- —
Personal DTI + credit; lowest rate.
DSCR
20% down · 8.5% · 30yr
- Down + closing
- —
- Monthly P&I
- —
- Monthly cashflow
- —
- DSCR
- —
- Eligible?
- —
No personal income docs; deal must DSCR.
Hard money
10% down · 12.0% · 12mo
- Down + closing
- —
- Monthly P&I
- —
- Monthly cashflow
- —
- DSCR
- —
- Eligible?
- —
Short-term bridge; refi at stabilization.
Listing history 9 events
-
2026-06-18remarks 315-char remark
-
2026-06-18days on market $90,000 Active 1 DOM
-
2026-06-05days on market $90,000 Active 30 DOM
-
2026-06-03days on market $90,000 Active 29 DOM
-
2026-06-02days on market $90,000 Active 28 DOM
-
2026-06-01days on market $90,000 Active 27 DOM
-
2026-05-31days on market $90,000 Active 26 DOM
-
2026-05-30days on market $90,000 Active 25 DOM
-
2026-05-05$90,000 Active
ⓘ Source: listings_history table (triggers on properties + properties_extension) + one-shot
backfill from property_details.listing_events for pre-trigger history.
Climate risk First Street
- Flood 1/10 Low FEMA zone A · 0% chance over 30 yrs
- Wildfire 4/10 Moderate
- Heat 9/10 Extreme 7 d/yr ≥112°F today · 23 d/yr by 30 yrs out
- Wind 9/10 Extreme 99% chance of damaging wind over 30 yrs
- Air quality 2/10 Low 1 unhealthy d/yr today · 1 by 30 yrs out
Nearby sold comps map
Loading sold comps map…
Walkable amenities ~0.75 mi
Loading nearby amenities…
Taxation est. · year 1
- Rental income
- $10,115
- − Mortgage interest
- −$5,041
- − Property taxes
- −$1,350
- − Insurance
- −$1,952
- − Repairs & maintenance
- −$809
- − Management
- −$809
- − Depreciation
- −$2,618
- Taxable loss
- −$2,466
- Est. tax savings @ 24.0%
- +$592
- After-tax cash flow
- $-384/yr
For passive investors: Depreciation is non-cash, so a rental often shows a tax loss while cash-flowing — sheltering income. Rental losses are passive: they offset passive income freely, and up to $25,000/yr can offset ordinary (W-2) income if you actively participate and your MAGI is under $100k (phasing out to $0 by $150k); unused losses carry forward. On sale, claimed depreciation is recaptured at up to 25%, and gains may owe capital-gains tax (a 1031 exchange can defer both). Figures are a year-1 estimate at your 24.0% rate — not tax advice; consult a CPA.
Condition & rehab AI · 13 photos
The home requires moderate repairs and maintenance, with a focus on the kitchen and exterior. Simple updates like painting and cleaning can significantly enhance its value.
Repairs flagged
- Minor Exposed ductwork in kitchen — Aesthetic and possibly functional issue
- Minor Cluttered countertops in kitchen — Reduces functionality and appeal
Value-add opportunities
- Both Paint exterior siding — Enhances curb appeal and value
- Resale Replace exposed ductwork — Improves functionality and aesthetics
- Resale Clean and organize countertops — Enhances functionality and appeal
Renovation cost estimate screening
| Repair item | Severity | Est. cost |
|---|---|---|
| Exposed ductwork in kitchen · Aesthetic and possibly functional issue | Minor | $500–3,000 |
| Cluttered countertops in kitchen · Reduces functionality and appeal | Minor | $500–3,000 |
| Total estimated repair cost · 2 items | $1,000–6,000 |
Value-add ROI direction
- Both Paint exterior siding — Enhances curb appeal and value ↑
- Resale Replace exposed ductwork — Improves functionality and aesthetics ↑
- Resale Clean and organize countertops — Enhances functionality and appeal ↑
ⓘ Cost ranges are severity-bucket heuristics (US national rule-of-thumb). Get contractor quotes + a written scope before underwriting a rehab budget.
Schools (NCES district)
- District
- Evadale ISD
- NCES district ID
- 4818750
- Math proficiency
- 38% ▬ 0.00%
- Reading proficiency
- 46% ▲ 3.00%
- Median HH income
- $55,985
- Composite
- 39.05/100
- National rank
- #8273
- State rank
- #609 of 1141 in TX
Livability — Evadale
- Score
- 73/100
- State rank
- #205
- US rank
- #5091
Category grades
Schools grade is shown separately in the Schools card above.
Census & demographics
- Census place
- Evadale, TX
- City population
- 256
- Population (ZIP)
- 256
Population outlook (Jasper County) Hauer SSP2
- Today (2025)
- 33,986 people
- By 2030
- 32,965 · -3.0%
- By 2040
- 30,908 · -9.1%
- By 2050
- 28,893 · -15.0%
- By 2075
- 24,828 · -26.9%
- By 2100
- 19,987 · -41.2%
Race, ethnicity, and origin ACS 2023
- Neighborhood character
- Predominantly White (100%)
- Race & ethnicity
- White 100%
- Common ancestry
- Serbian 3%
Political lean MEDSL · Jasper
- 2024 margin
- Solid R (+66.6) · D 16.5% · R 83.1%
- 2008→2024 swing
- -24.6pp toward R · 2008: -42.0pp · 2024: -66.6pp
- All cycles
- 2024: R+66.6 2020: R+61.4 2016: R+59.9 2012: R+48.4 2008: R+42.0
Not yet ingested
- Civics
- —
Market trends
- HPI YoY
- ▲ 1.44%
- Current HPI
- 81.228
- Rent YoY
- —
- Metro
- —
- State GDP YoY
- ▲ 3.95%
- F500 in state
- 110
Industry mix (Fortune 500 HQ in TX)
| Industry | F500 HQs | Revenue |
|---|---|---|
| Energy | 16 | $1,198B |
|
||
| Technology | 5 | $198B |
|
||
| Engineering / Construction | 4 | $72B |
|
||
| Energy Services | 3 | $60B |
|
||
| Utilities | 3 | $41B |
|
||
| Healthcare | 2 | $330B |
|
||
Price history
1 event — show timeline
- 2026-06-16 Listed $90,000 BBOR
Cash-flow waterfall
monthlySold comps — $/sqft
last 12 mo · ≤1 miLoading sold comps…