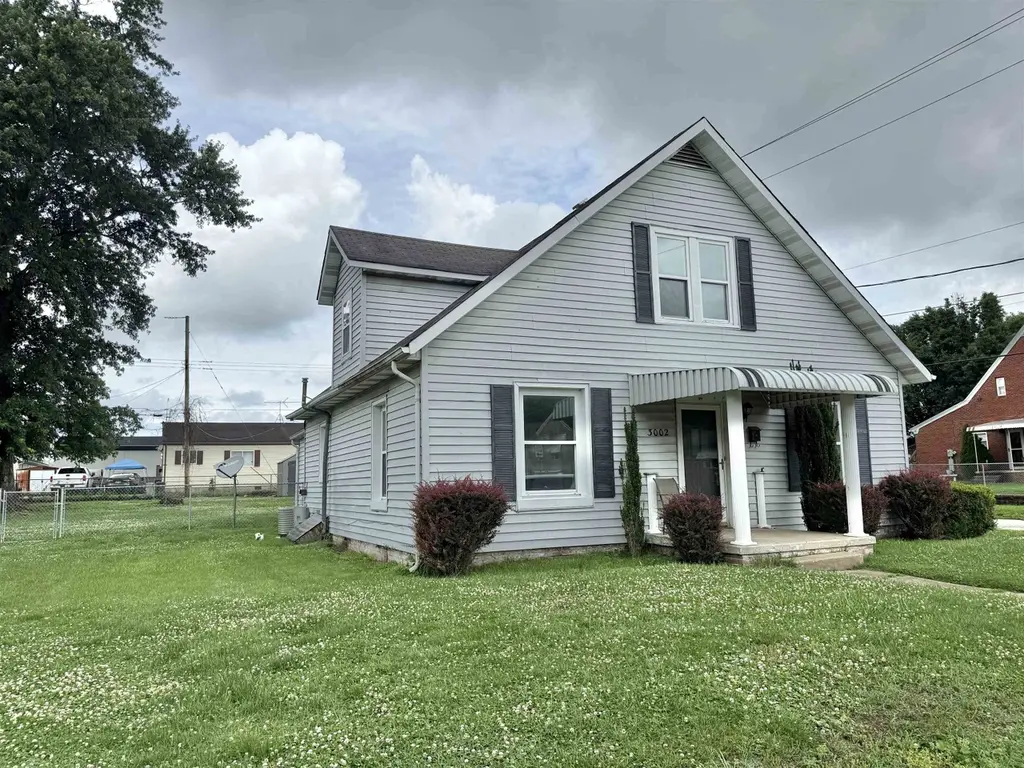
3002 Hughes St · Huntington, WV
Flood risk 1/10 · Minimal
- FEMA flood zone
- X (unshaded)
- Chance of flooding over 30 yrs
- 0.0%
- Est. flood insurance / yr
- $507 – $1,088
Fire risk 4/10 · Minor
- Est. fire insurance / yr
- $787 – $1,461
Heat risk 5/10 · Moderate
- Hot days now (above 102°F)
- 7 days/yr
- Hot days in 30 yrs
- 20 days/yr
Wind risk 2/10 · Minimal
- Chance of severe wind over 30 yrs
- 1.0%
Air-quality risk 1/10 · Minimal
- Unhealthy air days now
- 0 days/yr
- Unhealthy air days in 30 yrs
- 0 days/yr
Risk factors via First Street. Map © Google.
Why this score? — see what drove the C- grade
The composite is a weighted blend of 9 inputs, each scored 0–100. Each bar is that input's sub-score; the figure is the points it added to the 100-point composite (weight × sub-score).
- Cash flow +16.2/30.0
- ARV discount +13.9/15.0
- DSCR +5.0/10.0
- Livability +4.0/5.0
- 1% rule +3.6/10.0
- Schools +2.6/10.0
- Rent growth +2.5/5.0
- Condition / age +2.5/5.0
- Appreciation +0.0/10.0
$145,000
🖨 Deal sheet (PDF) 📄 Offer letter ✓ Due diligence
Listing remarks
Welcome to this charming freshly painted home located in the desirable Westmoreland area! Situated on a spacious double corner lot, this 3 bedroom, 2.5 bath home offers a wonderful combination of character, updates, and outdoor space. Inside, you’ll find beautiful hardwood flooring, generous room sizes, updated windows, and abundant natural light throughout. Recent improvements include a beautifully remodeled bathroom and added laundry room for modern convenience. The spacious living areas provide flexibility for entertaining, relaxing, or everyday living. Outside, enjoy the large fenced-in backyard perfect for pets, gatherings, gardening, or play. Additional features include off-stre
Key facts
- Double corner lot
- Remodeled bathroom
- Covered carport
Tags
Property features AI
Exterior
- Parking: Off-street parking
- Utilities: Public water; Public sewer
- Home design: Single family residence; 2 stories
- Construction: Vinyl siding; Shingle roof; Built with partial unfinished basement
- Exterior features: Patio; Porch; Chain link fencing; Level lot
Interior
- Kitchen: Dishwasher; Range; Oven; Refrigerator
- Flooring: Laminate; Vinyl; Wood
- Bathrooms: 2 full bathrooms; 1 half bathroom
- Heating & cooling: Central heating (natural gas); Central air; Window unit(s)
- Interior features: Dishwasher; Range; Oven; Refrigerator; Partial unfinished basement
Neighborhood map
What this means for you Summary
Snapshot
- This is a 3-bed/1.0-bath single-family listed at $145k.
Deal economics
- At list price, monthly cash flow is $76 ($913/yr) — positive.
- The deal already cash-flows at list — no discount required.
- To meet the 1% rule (rent ≥ 1% of price), the offer needs to be $125k (13.8% below list).
- Recommended offer: $125k (13.8% below list) — sets the bar for 1% rule.
Location & tenants
- Location reads 79/100 on livability (#16 in WV, #2,045 nationally) — a middle-class / working-renter tenant base. Strengths: amenities A+, commute A+, cost of living A+; Watch: crime F, employment F.
- Wayne County Schools (rural): math 25% / reading 38% proficiency, ranked #25 of 55 in WV (top 46%) — families likely to look elsewhere, expect single-tenant / working-renter base with shorter leases.
- Zoned schools: Kellogg Elementary School (math 47% / reading 37%, grade F, #87 of 377 statewide, top 28%, 327 students, 0% FRL); Vinson Middle School (math 19% / reading 53%, grade F, #31 of 109 statewide, top 28%, 197 students, 0% FRL); Spring Valley High School (math 17% / reading 47%, grade F, #55 of 110 statewide, top 59%, 910 students, 0% FRL) — zoned schools average 0% FRL vs 46% district-wide (46 pts lower); this property's tenant base skews higher-income than the district average.
- Market conditions: 78 active listings in the ZIP; 1 comparable units currently listed for rent nearby; 67 units permitted in Wayne County in 2024 (0 in 5+ unit buildings).
Forward outlook
- Local home prices are declining (-3.0%/yr); year-one equity from $1k of loan paydown is wiped out by about $4k of value loss. Plan a longer hold.
- Wayne County population projected at -22% by 2050 — secular population decline; favor cash flow + early exit over multi-decade hold.
Negotiation context
- It's been on market 28 days — a 2% lower offer ($143k) is reasonable based on typical stale-listing flexibility.
- Current owner paid $63k; list at $145k implies a 130% gain — meaningful room to come down on a strong offer.
Risks & watch-outs
- Watch-outs: built in 1940 — expect roof / HVAC / electrical / plumbing capex.
- Climate carrying-cost: extreme-heat days projected 7→20/yr by 2055 (HVAC capex compounding) — expect insurance premiums to compound above CPI over the hold.
Questions for the listing agent
- Built in 1940 — when were the roof, HVAC, electrical panel, plumbing, and water heater last replaced?
- Is there a deadline driving the sale (1031 exchange, divorce, estate, relocation)? That informs how much negotiation room exists.
- Crime grade is F in this area — have there been break-ins, vandalism, or insurance claims at this property in the last 3 years? What carrier currently insures it and at what premium?
- What's the average days-on-market for RENTAL listings here right now (not sales)? A rising rental-DOM trend means longer vacancies and softer asking-rent achievability than the comps imply.
- What's the recent tenant-quality profile in this submarket — average credit score on applications, eviction rate, late-payment / NSF rate, and stable-employment percentage? A property-management company in the area should have these aggregated.
- How much new for-sale + rental construction is in the pipeline within 1–3 miles? Heavy new supply typically softens prices + rents 12–24 months out; constrained supply supports both.
Investment metrics
- 1% rule
- 0.86% ✗
- Cap rate
- 6.92%
- Cash-on-cash
- 2.25%
- DSCR
- 1.10
- GRM
- 9.7
CMA / ARV
- ARV (on-the-fly)
- $169,161
- Comps found
- 12
Show comp detail 12 sales within ~0.75 mi
| Address | Dist | Beds/Ba | Sqft | Sold | Price | $/sf | Match |
|---|---|---|---|---|---|---|---|
| 3203 Bradley Rd | 0.17mi | 3/1.5 | 1,439 (-4%) | 4mo | $163,500 | $114 | 80 |
| 2971 Hughes St | 0.03mi | 3/1.0 | 1,296 (-13%) | 2mo | $153,750 | $119 | 74 |
| 3642 Piedmont Rd | 0.45mi | 3/2.0 | 1,509 (+1%) | 0mo | $230,000 | $152 | 73 |
| 282 Kentucky St | 0.52mi | 3/2.0 | 1,472 (-2%) | 2mo | $166,000 | $113 | 67 |
| 3214 Hughes St | 0.15mi | 2/2.0 (-1) | 1,328 (-11%) | 3mo | $192,000 | $145 | 63 |
| 2834 Park Ave | 0.20mi | 3/2.5 | 1,653 (+10%) | 9mo | $144,000 | $87 | 60 |
| 227 32nd Street West St | 0.35mi | 4/2.0 (+1) | 1,585 (+6%) | 7mo | $180,000 | $114 | 59 |
| 3115 Brandon Rd | 0.26mi | 2/1.0 (-1) | 1,279 (-15%) | 2mo | $135,000 | $106 | 57 |
| 4123 Auburn Rd | 0.74mi | 3/2.0 | 1,552 (+4%) | 1mo | $170,000 | $110 | 55 |
| 331 Bernard St | 0.72mi | 3/2.0 | 1,544 (+3%) | 5mo | $153,000 | $99 | 53 |
| 3610 Hughes St | 0.38mi | 2/1.5 (-1) | 1,300 (-13%) | 8mo | $130,000 | $100 | 47 |
| 2201 Washington Ave | 0.73mi | 3/1.5 | 1,664 (+11%) | 8mo | $119,000 | $72 | 38 |
Match score weights: distance 35% · size 25% · config 20% · recency 20%. Top-matched comps best support the ARV.
Projected returns pro-forma
-3.0% appreciation · 3.0% rent growth · sell at horizon
- IRR
- -12.8%
- Equity multiple
- 0.54×
- Total profit
- $-18,687
- Equity at exit
- $21,620
- IRR
- -3.8%
- Equity multiple
- 0.75×
- Total profit
- $-10,181
- Equity at exit
- $12,537
Cash invested: $40,600 (down + closing). Projections, not guarantees.
Landlord ↔ Tenant lean methodology
- Overall (STATE)
- 83 Strongly Landlord-Friendly
- State West Virginia
- 83 Strongly Landlord-Friendly · R+22
- County
- — inherits STATE
- City
- — inherits STATE
ZIP-level market 25704
- Home prices YoY
- -13.7%
- Active inventory
- 78
- Price-to-rent
- 9.7×
Monthly cashflow live
- Estimated rent
- $1,250 medium interval (Pro) →
- Mortgage (P&I)
- −$760
- Tax from tax record
- −$91 /mo · $1,087/yr
- Insurance
- −$60
- HOA
- −$0
- Vacancy / Maint / Mgmt
- −$262
- Net cashflow
- $76
Break-even live
Sensitivity live
| Price | -10% $158 | -5% $117 | +0% $76 | +5% $35 | +10% $-6 |
|---|---|---|---|---|---|
| Rent | -10% $-23 | -5% $27 | +0% $76 | +5% $125 | +10% $175 |
| Rate | -1.0pp $149 | -0.5pp $113 | base $76 | +0.5pp $39 | +1.0pp $0 |
UW: 25.0% down · 7.5% · 30yr · 1.5% tax · 5.0% vac · 8.0% maint · 8.0% mgmt
Financing live
Cash to close
- Down payment
- $36,250
- Closing costs
- $4,350
- Reserves months
- —
- Total cash needed
- —
Loan-product check · same deal, 3 products live
Conventional
25% down · 7.5% · 30yr
- Down + closing
- —
- Monthly P&I
- —
- Monthly cashflow
- —
- DSCR
- —
- Eligible?
- —
Personal DTI + credit; lowest rate.
DSCR
20% down · 8.5% · 30yr
- Down + closing
- —
- Monthly P&I
- —
- Monthly cashflow
- —
- DSCR
- —
- Eligible?
- —
No personal income docs; deal must DSCR.
Hard money
10% down · 12.0% · 12mo
- Down + closing
- —
- Monthly P&I
- —
- Monthly cashflow
- —
- DSCR
- —
- Eligible?
- —
Short-term bridge; refi at stabilization.
Rent comps 1 comps
| Address | Beds | Baths | Sqft | Rent | $/sqft | DOM | Units | Dist |
|---|---|---|---|---|---|---|---|---|
| 457 Overby Rd Huntington, WV | 3.0 | 1.5 | 1724 | $1,250 | $0.73 | 45d | 1 | 1.47mi |
Listing history 20 events
-
2026-06-22days on market $145,000 Active 28 DOM
-
2026-06-21days on market $145,000 Active 27 DOM
-
2026-06-19days on market $145,000 Active 25 DOM
-
2026-06-18days on market $145,000 Active 24 DOM
-
2026-06-17days on market $145,000 Active 23 DOM
-
2026-06-16days on market $145,000 Active 22 DOM
-
2026-06-15days on market $145,000 Active 21 DOM
-
2026-06-14days on market $145,000 Active 19 DOM
-
2026-06-12days on market $145,000 Active 18 DOM
-
2026-06-09days on market $145,000 Active 15 DOM
-
2026-06-08days on market $145,000 Active 14 DOM
-
2026-06-07days on market $145,000 Active 13 DOM
-
2026-06-05days on market $145,000 Active 10 DOM
-
2026-06-03days on market $145,000 Active 9 DOM
-
2026-06-02days on market $145,000 Active 8 DOM
-
2026-06-01days on market $145,000 Active 7 DOM
-
2026-05-31days on market $145,000 Active 6 DOM
-
2026-05-30days on market $145,000 Active 5 DOM
-
2026-05-25$145,000 Active
-
2018-02-09soldstatus $63,100
ⓘ Source: listings_history table (triggers on properties + properties_extension) + one-shot
backfill from property_details.listing_events for pre-trigger history.
Tax reassessment forecast WV · Resets to sale price
- Current annual tax
- $1,087 · $91/mo
- Projected year-2 tax
- $1,087 · $91/mo
- Expected delta
- $0/yr ($0/mo · 0.0%)
ⓘ Screening estimate from a state-policy table — verify with the county assessor before closing.
Climate risk First Street
- Flood 1/10 Low FEMA zone X (unshaded) · 0% chance over 30 yrs
- Wildfire 4/10 Moderate
- Heat 5/10 Major 7 d/yr ≥102°F today · 20 d/yr by 30 yrs out
- Wind 2/10 Low 100% chance of damaging wind over 30 yrs
- Air quality 1/10 Low 0 unhealthy d/yr today · 0 by 30 yrs out
Nearby sold comps map
Loading sold comps map…
Walkable amenities ~0.75 mi
Loading nearby amenities…
Taxation est. · year 1
- Rental income
- $15,000
- − Mortgage interest
- −$8,122
- − Property taxes
- −$1,087
- − Insurance
- −$725
- − Repairs & maintenance
- −$1,200
- − Management
- −$1,200
- − Depreciation
- −$4,218
- Taxable loss
- −$1,553
- Est. tax savings @ 24.0%
- +$373
- After-tax cash flow
- $1,286/yr
For passive investors: Depreciation is non-cash, so a rental often shows a tax loss while cash-flowing — sheltering income. Rental losses are passive: they offset passive income freely, and up to $25,000/yr can offset ordinary (W-2) income if you actively participate and your MAGI is under $100k (phasing out to $0 by $150k); unused losses carry forward. On sale, claimed depreciation is recaptured at up to 25%, and gains may owe capital-gains tax (a 1031 exchange can defer both). Figures are a year-1 estimate at your 24.0% rate — not tax advice; consult a CPA.
Schools (NCES district)
- District
- Wayne County Schools
- NCES district ID
- 5401500
- Math proficiency
- 25% ▼ -15.00%
- Reading proficiency
- 38% ▼ -10.00%
- Median HH income
- $36,283
- Composite
- 26.08/100
- National rank
- #7297
- State rank
- #25 of 55 in WV
Livability — Huntington
- Score
- 79/100
- State rank
- #16
- US rank
- #2045
Category grades
Schools grade is shown separately in the Schools card above.
Census & demographics
- Census place
- Huntington, WV
- City population
- 25,795
- Population (ZIP)
- 14,413
Population outlook (Wayne County) Hauer SSP2
- Today (2025)
- 38,267 people
- By 2030
- 36,578 · -4.4%
- By 2040
- 33,034 · -13.7%
- By 2050
- 29,671 · -22.5%
- By 2075
- 22,901 · -40.2%
- By 2100
- 17,421 · -54.5%
Race, ethnicity, and origin ACS 2023
- Neighborhood character
- Predominantly White (93%)
- Race & ethnicity
- White 93% Two or more races 5% Black 2%
- Common ancestry
- Italian 3% Serbian 2% Slovak 2%
- Foreign-born
- 1% · Canada
- Languages at home
- 99% English-only · French/Haitian/Cajun 1%
Political lean MEDSL · Wayne
- 2024 margin
- Solid R (+53.4) · D 22.4% · R 75.8% · Other 1.8%
- 2008→2024 swing
- -35.1pp toward R · 2008: -18.2pp · 2024: -53.4pp
- All cycles
- 2024: R+53.4 2020: R+50.1 2016: R+51.3 2012: R+27.0 2008: R+18.2
Not yet ingested
- Civics
- —
Market trends
- HPI YoY
- ▼ -32.21%
- Current HPI
- 202.1322
- Rent YoY
- —
- Metro
- —
- State GDP YoY
- —
- F500 in state
- 0
Price history
+129.8% since first listed2 events — show timeline
- 2026-05-25 Listed $145,000 HBRMLS
- 2018-02-09 Sold (Public Records) $63,100 Public Records
Property tax history
+9.3%/yrLatest (2025): $1,087 · +7.2% YoY. Source: county tax records.
Cash-flow waterfall
monthlySold comps — $/sqft
last 12 mo · ≤1 miLoading sold comps…