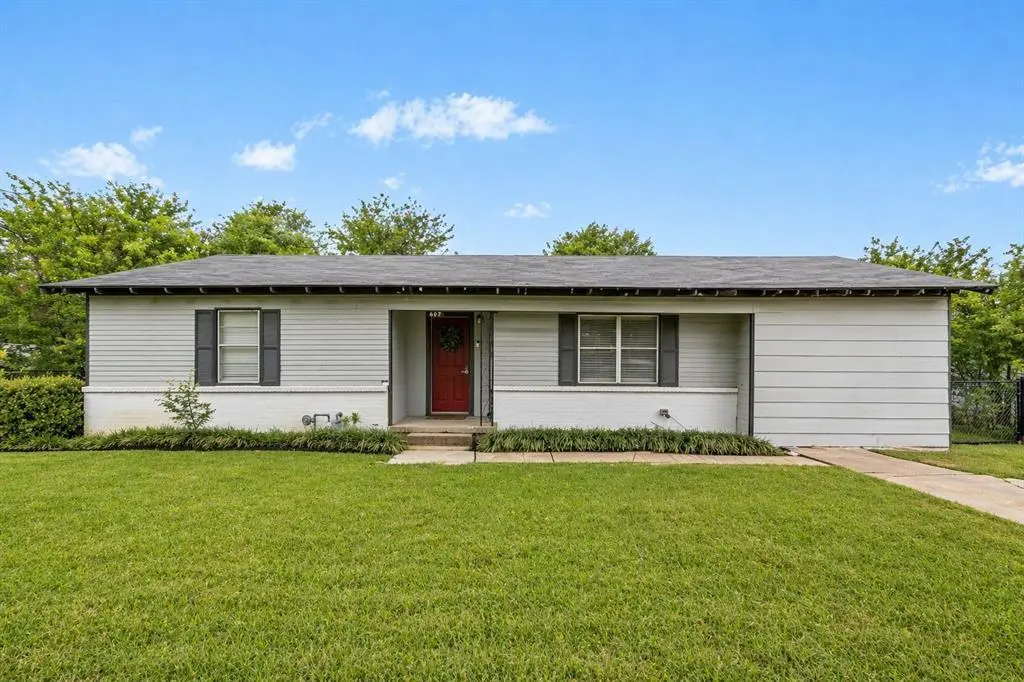
607 E Pine St · West, TX
Flood risk 1/10 · Minimal
- FEMA flood zone
- X (unshaded)
- Chance of flooding over 30 yrs
- 0.0%
- Est. flood insurance / yr
- $507 – $1,088
Fire risk 4/10 · Minor
- Est. fire insurance / yr
- $1,222 – $2,270
Heat risk 7/10 · Major
- Hot days now (above 109°F)
- 7 days/yr
- Hot days in 30 yrs
- 23 days/yr
Wind risk 6/10 · Moderate
- Chance of severe wind over 30 yrs
- 70.0%
Air-quality risk 2/10 · Minimal
- Unhealthy air days now
- 0 days/yr
- Unhealthy air days in 30 yrs
- 1 days/yr
Risk factors via First Street. Map © Google.
Why this score? — see what drove the B- grade
The composite is a weighted blend of 9 inputs, each scored 0–100. Each bar is that input's sub-score; the figure is the points it added to the 100-point composite (weight × sub-score).
- Cash flow +23.2/30.0
- Appreciation +10.0/10.0
- ARV discount +7.5/15.0
- DSCR +7.4/10.0
- 1% rule +6.8/10.0
- Schools +4.1/10.0
- Livability +3.6/5.0
- Rent growth +2.5/5.0
- Condition / age +2.5/5.0
$149,000
🖨 Deal sheet (PDF) 📄 Offer letter ✓ Due diligence
Listing remarks
Charming home in West, just streets away from local businesses and West ISD. Whether you’re searching for the perfect family home or a great addition to your investment portfolio, this property offers both comfort and convenience. This 3-bedroom, 1-bath home features updates with an inviting layout ideal for entertaining. The cozy backyard provides the perfect space to relax or enjoy outdoor activities and includes a storage building for tools and hobbies. Kitchen appliances will convey with the sale. Enjoy everything West has to offer, from its small-town charm to its nearby amenities. This home is ready for its next owner!
Key facts
- Storage building
- Inviting layout
- Cozy backyard
Tags
Property features AI
Finance
- Other: Property subtype: Single Family Residence; Lot under 0.5 acre (about 0.201 acre); Will not subdivide
- Financial info: Listing accepts Cash, Conventional, or Other financing
- HOA & community: No association
Exterior
- Parking: Driveway; Has garage (garage spaces listed as 0)
- Security: Audio and video surveillance devices present
- Utilities: City water; City sewer; Municipal utility district: No
- Home design: Single-family residence; Residential property; Built in 1960; One story; Not attached to another property; Entry/levels: One
- Construction: Composition roof; Pillar/post/pier foundation
- Exterior features: Covered porch(es); Covered patio/porch; Chain link fence in back yard; Shed(s) on the property; Black soil type
Interior
- Kitchen: Gas range; Refrigerator; Gas water heater
- Bedrooms: Primary bedroom (1st floor) approximately 14 x 11; Bedroom (1st floor) approximately 13 x 10; Bedroom (1st floor) approximately 11 x 10
- Flooring: Carpet; Vinyl; Wood
- Bathrooms: 1 full bathroom
- Heating & cooling: Central heating (electric); Central air conditioning (electric)
- Interior features: Cable TV available; 6 total rooms; One level
- Laundry & utility: Utility room
Neighborhood map
What this means for you Summary
Snapshot
- This is a 3-bed/1.0-bath single-family listed at $149k.
Deal economics
- At list price, monthly cash flow is $270 ($3k/yr) — positive.
- The deal already cash-flows at list — no discount required.
- Meets the 1% rule at list price ($2k rent vs $149k).
- Recommended offer: $145k (3.0% below list) — sets the bar for market timing.
Location & tenants
- Location reads 71/100 on livability (#291 in TX) — a middle-class / working-renter tenant base. Strengths: crime A+, cost of living A+, housing A+; Watch: amenities F, commute F, health & safety F.
- West ISD (town): math 49% / reading 47% proficiency, ranked #201 of 826 in TX (top 24%) — families likely to look elsewhere, expect single-tenant / working-renter base with shorter leases.
- Zoned schools: West El (math 63% / reading 47%, grade C, #602 of 4,322 statewide, top 14%, 582 students, 45% FRL); West Middle (math 48% / reading 43%, grade D+, #470 of 1,662 statewide, top 29%, 264 students, 43% FRL); West H S (math 32% / reading 62%, grade D-, #591 of 1,632 statewide, top 38%, 395 students, 29% FRL).
- Market conditions: 89 active listings in the ZIP; 3 comparable units currently listed for rent nearby; rentals at typical pace (median 23d on market — plan ~3-4 weeks tenant-placement turnaround); 1,014 units permitted in McLennan County in 2024 (200 in 5+ unit buildings).
Forward outlook
- In year one you build about $16k of equity ($1k loan paydown + $15k appreciation (10.0% local appreciation)).
- McLennan County population projected at +17% by 2050 — long-run rental-demand tailwind backs the buy-and-hold thesis.
- At projected returns (10.0% appreciation + 3.0% rent growth), your $42k cash investment doubles in ~3 years — after that, you're playing with house money.
- By year 3, paydown + projected appreciation supports a ~$40k cash-out refi (75% LTV) — recoverable capital for the next deal without selling this one.
Negotiation context
- It's been on market 51 days — a 3% lower offer ($145k) is reasonable based on typical stale-listing flexibility.
- 9 sale attempts since 7y ago with the ask held roughly flat each time — persistent listings suggest the price (not the market) is what's stuck; bring a comps-based counter.
Risks & watch-outs
- Climate carrying-cost: major wind risk, 70% chance of damaging wind over 30y; extreme-heat days projected 7→23/yr by 2055 (HVAC capex compounding) — expect insurance premiums to compound above CPI over the hold.
Questions for the listing agent
- It's been on market 51 days. Have you received any prior offers? Is the seller open to a 3% concession, seller financing, or rate buy-down credit?
- Built in 1960 — when were the roof, HVAC, electrical panel, plumbing, and water heater last replaced?
- Is there a deadline driving the sale (1031 exchange, divorce, estate, relocation)? That informs how much negotiation room exists.
- Schools are D-rated, which usually means shorter tenancies and higher turnover. Who's the typical renter profile here, and what's been the actual vacancy rate?
- What's the average days-on-market for RENTAL listings here right now (not sales)? A rising rental-DOM trend means longer vacancies and softer asking-rent achievability than the comps imply.
- What's the recent tenant-quality profile in this submarket — average credit score on applications, eviction rate, late-payment / NSF rate, and stable-employment percentage? A property-management company in the area should have these aggregated.
- How much new for-sale + rental construction is in the pipeline within 1–3 miles? Heavy new supply typically softens prices + rents 12–24 months out; constrained supply supports both.
Investment metrics
- 1% rule
- 1.18% ✓
- Cap rate
- 8.46%
- Cash-on-cash
- 7.75%
- DSCR
- 1.34
- GRM
- 7.1
CMA / ARV
No comps found within radius.
Projected returns pro-forma
10.0% appreciation · 3.0% rent growth · sell at horizon
- IRR
- 29.9%
- Equity multiple
- 3.36×
- Total profit
- $98,398
- Equity at exit
- $134,231
- IRR
- 26.0%
- Equity multiple
- 7.63×
- Total profit
- $276,429
- Equity at exit
- $289,474
Cash invested: $41,720 (down + closing). Projections, not guarantees.
Landlord ↔ Tenant lean methodology
- Overall (STATE)
- 87 Strongly Landlord-Friendly
- State Texas
- 87 Strongly Landlord-Friendly · R+5
- County
- — inherits STATE
- City
- — inherits STATE
ZIP-level market 76691
- Home prices YoY
- 8.6%
- Active inventory
- 89
- Price-to-rent
- 7.1×
Monthly cashflow live
- Estimated rent
- $1,759 medium interval (Pro) →
- Mortgage (P&I)
- −$781
- Tax from tax record
- −$276 /mo · $3,315/yr
- Insurance
- −$62
- HOA
- −$0
- Lot rent
- −$0
- Vacancy / Maint / Mgmt
- −$369
- Net cashflow
- $270
Break-even live
Sensitivity live
| Price | -10% $354 | -5% $312 | +0% $270 | +5% $227 | +10% $185 |
|---|---|---|---|---|---|
| Rent | -10% $131 | -5% $200 | +0% $270 | +5% $339 | +10% $408 |
| Rate | -1.0pp $345 | -0.5pp $307 | base $270 | +0.5pp $231 | +1.0pp $192 |
UW: 25.0% down · 7.5% · 30yr · 1.5% tax · 5.0% vac · 8.0% maint · 8.0% mgmt
Financing live
Cash to close
- Down payment
- $37,250
- Closing costs
- $4,470
- Reserves months
- —
- Total cash needed
- —
Loan-product check · same deal, 3 products live
Conventional
25% down · 7.5% · 30yr
- Down + closing
- —
- Monthly P&I
- —
- Monthly cashflow
- —
- DSCR
- —
- Eligible?
- —
Personal DTI + credit; lowest rate.
DSCR
20% down · 8.5% · 30yr
- Down + closing
- —
- Monthly P&I
- —
- Monthly cashflow
- —
- DSCR
- —
- Eligible?
- —
No personal income docs; deal must DSCR.
Hard money
10% down · 12.0% · 12mo
- Down + closing
- —
- Monthly P&I
- —
- Monthly cashflow
- —
- DSCR
- —
- Eligible?
- —
Short-term bridge; refi at stabilization.
Rent comps 3 comps
| Address | Beds | Baths | Sqft | Rent | $/sqft | DOM | Units | Dist |
|---|---|---|---|---|---|---|---|---|
| 104 Vitava Dr West, TX | 3.0 | 2.0 | 1211 | $1,795 | $1.48 | 23d | 1 | 0.17mi |
| 106 Vitava Dr Unit 102 West, TX | 3.0 | 2.0 | 1211 | $1,795 | $1.48 | 23d | 1 | 0.18mi |
| 190 Wishing Well Rd Unit 190 West, TX | 3.0 | 1.5 | 1100 | $1,295 | $1.18 | 15d | 1 | 1.02mi |
Listing history 37 events
-
2026-06-15statusdays on market $149,000 Pending 51 DOM
-
2026-06-14days on market $149,000 Active Option Contract 50 DOM
-
2026-06-13days on market $149,000 Active Option Contract 49 DOM
-
2026-06-10days on market $149,000 Active Option Contract 47 DOM
-
2026-06-09days on market $149,000 Active Option Contract 46 DOM
-
2026-06-08days on market $149,000 Active Option Contract 45 DOM
-
2026-06-07days on market $149,000 Active Option Contract 44 DOM
-
2026-06-03days on market $149,000 Active Option Contract 40 DOM
-
2026-06-02statusdays on market $149,000 Active Option Contract 39 DOM
-
2026-06-01days on market $149,000 Active 38 DOM
-
2026-05-31days on market $149,000 Active 37 DOM
-
2026-05-30days on market $149,000 Active 36 DOM
-
2026-05-14status Active 644-char remark
-
2026-05-05historical Active Option Contract 644-char remark
-
2026-04-24$149,000 Active 644-char remark
-
2026-04-16historical
-
2026-04-15status Active
-
2026-04-10status Pending
-
2026-04-09historical Active Option Contract
-
2026-04-06status Pending
-
2026-04-02historical Active Option Contract
-
2026-02-05$169,900 Active
-
2025-12-29historical
-
2025-12-02status Active
-
2025-11-25historical Active Option Contract
-
2025-10-27price $177,500
-
2025-08-25price $179,900
-
2025-07-31price $182,500
-
2025-06-24$184,900 Active
-
2021-05-03soldstatus
-
2021-04-30soldstatus
-
2021-01-19$144,900
-
2020-06-03soldstatus
-
2020-03-26$65,000
-
2020-03-25historical
-
2019-12-20$65,000
-
2009-07-31soldstatus
ⓘ Source: listings_history table (triggers on properties + properties_extension) + one-shot
backfill from property_details.listing_events for pre-trigger history.
Tax reassessment forecast TX · Resets to sale price
- Current annual tax
- $3,315 · $276/mo
- Projected year-2 tax
- $3,315 · $276/mo
- Expected delta
- $0/yr ($0/mo · 0.0%)
ⓘ Screening estimate from a state-policy table — verify with the county assessor before closing.
Climate risk First Street
- Flood 1/10 Low FEMA zone X (unshaded) · 0% chance over 30 yrs
- Wildfire 4/10 Moderate
- Heat 7/10 Severe 7 d/yr ≥109°F today · 23 d/yr by 30 yrs out
- Wind 6/10 Major 70% chance of damaging wind over 30 yrs
- Air quality 2/10 Low 0 unhealthy d/yr today · 1 by 30 yrs out
Nearby sold comps map
Loading sold comps map…
Walkable amenities ~0.75 mi
Loading nearby amenities…
Taxation est. · year 1
- Rental income
- $21,102
- − Mortgage interest
- −$8,346
- − Property taxes
- −$3,315
- − Insurance
- −$745
- − Repairs & maintenance
- −$1,688
- − Management
- −$1,688
- − Depreciation
- −$4,335
- Taxable income
- $985
- Est. tax owed @ 24.0%
- −$236
- After-tax cash flow
- $2,998/yr
For passive investors: Depreciation is non-cash, so a rental often shows a tax loss while cash-flowing — sheltering income. Rental losses are passive: they offset passive income freely, and up to $25,000/yr can offset ordinary (W-2) income if you actively participate and your MAGI is under $100k (phasing out to $0 by $150k); unused losses carry forward. On sale, claimed depreciation is recaptured at up to 25%, and gains may owe capital-gains tax (a 1031 exchange can defer both). Figures are a year-1 estimate at your 24.0% rate — not tax advice; consult a CPA.
Schools (NCES district)
- District
- West ISD
- NCES district ID
- 4845040
- Math proficiency
- 49% ▲ 10.00%
- Reading proficiency
- 47% ▲ 1.00%
- Median HH income
- $52,112
- Composite
- 41.34/100
- National rank
- #3502
- State rank
- #201 of 826 in TX
Livability — West
- Score
- 71/100
- State rank
- #291
- US rank
- #6692
Category grades
Schools grade is shown separately in the Schools card above.
Census & demographics
- Census place
- West, TX
- Population (ZIP)
- 6,288
Population outlook (McLennan County) Hauer SSP2
- Today (2025)
- 264,191 people
- By 2030
- 273,578 · +3.6%
- By 2040
- 291,506 · +10.3%
- By 2050
- 308,044 · +16.6%
- By 2075
- 349,648 · +32.3%
- By 2100
- 364,779 · +38.1%
Race, ethnicity, and origin ACS 2023
- Neighborhood character
- Predominantly White (82%)
- Race & ethnicity
- White 82% Hispanic / Latino 14% Two or more races 13% Black 1%
- Hispanic origin (detail)
- Mexican 14%
- Common ancestry
- Lithuanian 2% Slovak 2% Romanian 1%
- Foreign-born
- 5% · Canada
- Languages at home
- 90% English-only · Spanish 9% Russian/Polish/Slavic 2%
Political lean MEDSL · McLennan
- 2024 margin
- Solid R (+30.9) · D 34.0% · R 64.9% · Other 1.0%
- 2008→2024 swing
- -7.0pp toward R · 2008: -23.9pp · 2024: -30.9pp
- All cycles
- 2024: R+30.9 2020: R+23.4 2016: R+27.1 2012: R+29.8 2008: R+23.9
Not yet ingested
- Civics
- —
Market trends
- HPI YoY
- ▲ 34.54%
- Current HPI
- 436.11
- Rent YoY
- —
- Metro
- —
- State GDP YoY
- ▲ 3.95%
- F500 in state
- 110
Industry mix (Fortune 500 HQ in TX)
| Industry | F500 HQs | Revenue |
|---|---|---|
| Energy | 16 | $1,198B |
|
||
| Technology | 5 | $198B |
|
||
| Engineering / Construction | 4 | $72B |
|
||
| Energy Services | 3 | $60B |
|
||
| Utilities | 3 | $41B |
|
||
| Healthcare | 2 | $330B |
|
||
Price history
+129.2% since first listed27 events — show timeline
- 2026-06-14 Pending — NTREIS
- 2026-06-01 Contingent — NTREIS
- 2026-05-14 Relisted — NTREIS
- 2026-05-05 Contingent — NTREIS
- 2026-04-24 Listed $149,000 NTREIS
- 2026-04-16 Listing Removed — NTREIS
- 2026-04-15 Relisted — NTREIS
- 2026-04-10 Pending — NTREIS
- 2026-04-09 Contingent — NTREIS
- 2026-04-06 Pending — NTREIS
- 2026-04-02 Contingent — NTREIS
- 2026-02-05 Listed $169,900 NTREIS
- 2025-12-29 Listing Removed — NTREIS
- 2025-12-02 Relisted — NTREIS
- 2025-11-25 Contingent — NTREIS
- 2025-10-27 Price Changed $177,500 NTREIS
- 2025-08-25 Price Changed $179,900 NTREIS
- 2025-07-31 Price Changed $182,500 NTREIS
- 2025-06-24 Listed $184,900 NTREIS
- 2021-05-03 Sold (Public Records) — Public Records
- 2021-04-30 Sold (MLS) — NTREIS
- 2021-01-19 Listed $144,900 NTREIS
- 2020-06-03 Sold (MLS) — NTREIS
- 2020-03-26 Listed $65,000 NTREIS
- 2020-03-25 Listing Removed — NTREIS
- 2019-12-20 Listed $65,000 NTREIS
- 2009-07-31 Sold (Public Records) — Public Records
Property tax history
+6.4%/yrLatest (2025): $3,315 · +6.6% YoY. Source: county tax records.
Cash-flow waterfall
monthlySold comps — $/sqft
last 12 mo · ≤1 miLoading sold comps…