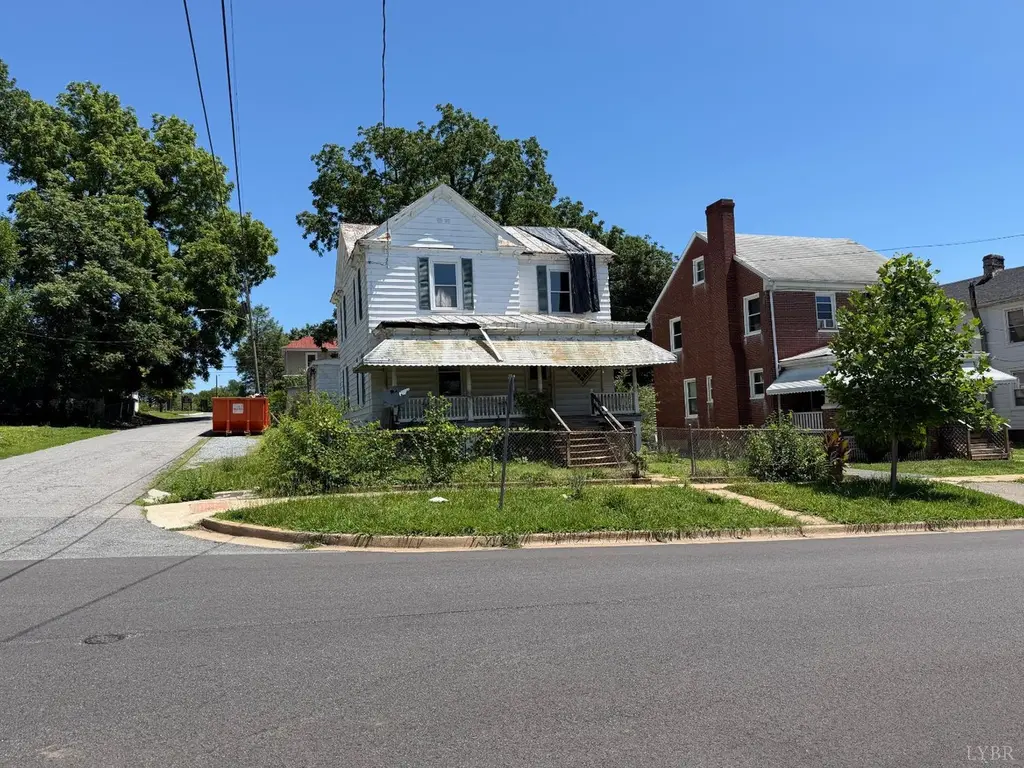
400 Wadsworth st St · Lynchburg, VA
Flood risk 1/10 · Minimal
- FEMA flood zone
- X (unshaded)
- Chance of flooding over 30 yrs
- 0.0%
- Est. flood insurance / yr
- $473 – $860
Fire risk 3/10 · Minor
- Est. fire insurance / yr
- $666 – $1,236
Heat risk 6/10 · Moderate
- Hot days now (above 102°F)
- 7 days/yr
- Hot days in 30 yrs
- 18 days/yr
Wind risk 2/10 · Minimal
- Chance of severe wind over 30 yrs
- 2.0%
Air-quality risk 2/10 · Minimal
- Unhealthy air days now
- 0 days/yr
- Unhealthy air days in 30 yrs
- 1 days/yr
Risk factors via First Street. Map © Google.
Why this score? — see what drove the B grade
The composite is a weighted blend of 9 inputs, each scored 0–100. Each bar is that input's sub-score; the figure is the points it added to the 100-point composite (weight × sub-score).
- Cash flow +30.0/30.0
- 1% rule +10.0/10.0
- DSCR +10.0/10.0
- ARV discount +7.5/15.0
- Livability +4.5/5.0
- Schools +4.0/10.0
- Rent growth +3.8/5.0
- Condition / age +2.5/5.0
- Appreciation +0.0/10.0
$69,900
🖨 Deal sheet 📄 Offer letter ✓ Due diligence
Listing remarks MLS
Flip this House. .. .Could be a Great home, investment or Rental Property. Over 2200 Sq. finished Ft. Most of the Vinyl replacement windows have already been installed. Hardwood floors through out. The majority of the epair/replacement work needs to be centered around the bathroom and Kitchen areas. Fenced, Corner Lot.
Key facts
- Flexible layout
- Large living room
- Large kitchen
Tags
Property features AI
Finance
- Financial info: Annual tax amount: $943
Exterior
- Utilities: Public sewer
- Home design: Single family residence; 2 stories; Residential property; Located in Miller Park - South subdivision
- Construction: Metal roof; Approximately 2,200 above-grade finished area
- Exterior features: Porch; Corner property
Interior
- Flooring: Hardwood; Wood
- Bathrooms: 2 full bathrooms
- Heating & cooling: Central air conditioning
- Interior features: Hardwood/Wood flooring; Basement
- Laundry & utility: Washer hookup
Neighborhood map
What this means for you Summary
Snapshot
- This is a 4-bed/2.0-bath single-family listed at $70k.
Deal economics
- At list price, monthly cash flow is $919 ($11k/yr) — positive.
- The deal already cash-flows at list — no discount required.
- Meets the 1% rule at list price ($2k rent vs $70k).
- Cap rate 22.1% vs local median 4.0% in Lynchburg — top-decile yield for the area; either an underpriced asset or a hidden risk that comps aren't pricing in. Stress-test before assuming the spread holds.
Location & tenants
- Location reads 91/100 on livability (#1 in VA, #58 nationally) — a professional / high-income tenant draw. Strengths: amenities A+, commute A+, cost of living A+; Watch: crime C-, employment D+.
- Lynchburg City Public School District (urban): math 36% / reading 61% proficiency, ranked #104 of 131 in VA (top 79%) — families likely to look elsewhere, expect single-tenant / working-renter base with shorter leases; 61% free/reduced lunch — lower-income household profile, screen leases tightly.
- Zoned schools: E.C. Glass High (math 42% / reading 84%, grade B-, #223 of 319 statewide, top 70%, 1,325 students, 92% FRL) — zoned schools average 92% FRL vs 61% district-wide (32 pts higher); higher-poverty schools than district average — tighter screening recommended.
- Zoned-school proficiency averages 63% at this address vs 48% district-wide (+14 pts) — the actual schools serving this property are materially stronger than the Lynchburg City Public School District average implies; a family-tenant draw the district grade alone would hide.
- Market conditions: Rents rising fast (+5.1%/yr); 318 active listings in the ZIP; 16 comparable units currently listed for rent nearby; rentals at typical pace (median 21d on market — plan ~3-4 weeks tenant-placement turnaround); 472 units permitted in Lynchburg city in 2024 (240 in 5+ unit buildings).
Forward outlook
- Local home prices are declining (-3.0%/yr); year-one equity from $483 of loan paydown is wiped out by about $2k of value loss. Plan a longer hold.
- Lynchburg County population projected at +37% by 2050 — long-run rental-demand tailwind backs the buy-and-hold thesis.
- At projected returns (-3.0% appreciation + 5.1% rent growth), your $20k cash investment doubles in ~2 years — after that, you're playing with house money.
Negotiation context
- Only 10 days on market — expect competitive offers; lowballing is unlikely to land.
- 3 sale attempts since 16y ago with the ask held roughly flat each time — persistent listings suggest the price (not the market) is what's stuck; bring a comps-based counter.
- Current owner paid $25k; list at $70k implies a 180% gain — meaningful room to come down on a strong offer.
Risks & watch-outs
- Watch-outs: built in 1905 — expect roof / HVAC / electrical / plumbing capex.
- Climate carrying-cost: extreme-heat days projected 7→18/yr by 2055 (HVAC capex compounding) — expect insurance premiums to compound above CPI over the hold.
Questions for the listing agent
- Built in 1905 — when were the roof, HVAC, electrical panel, plumbing, and water heater last replaced?
- Is there a deadline driving the sale (1031 exchange, divorce, estate, relocation)? That informs how much negotiation room exists.
- Schools are A-rated — typically a magnet for longer-tenancy family renters. What's the average tenant stay here, and is there a school-zone premium baked into asking?
- What's the average days-on-market for RENTAL listings here right now (not sales)? A rising rental-DOM trend means longer vacancies and softer asking-rent achievability than the comps imply.
- What's the recent tenant-quality profile in this submarket — average credit score on applications, eviction rate, late-payment / NSF rate, and stable-employment percentage? A property-management company in the area should have these aggregated.
- How much new for-sale + rental construction is in the pipeline within 1–3 miles? Heavy new supply typically softens prices + rents 12–24 months out; constrained supply supports both.
Investment metrics
- 1% rule
- 2.52% ✓
- Cap rate
- 22.07%
- Cash-on-cash
- 56.35%
- DSCR
- 3.51
- GRM
- 3.3
CMA / ARV
- ARV (on-the-fly)
- $254,562
- Comps found
- 12
Show comp detail 12 sales within ~0.75 mi
| Address | Dist | Beds/Ba | Sqft | Sold | Price | $/sf | Match |
|---|---|---|---|---|---|---|---|
| 1303 Garfield Ave | 0.33mi | 4/2.5 | 2,314 (+4%) | 4mo | $235,000 | $102 | 73 |
| 1305 Campbell Ave | 0.37mi | 4/2.0 | 2,070 (-7%) | 5mo | $155,000 | $75 | 66 |
| 306 Langhorne Ln | 0.74mi | 4/2.0 | 2,166 (-3%) | 0mo | $293,000 | $135 | 60 |
| 914 Fillmore St | 0.69mi | 4/2.5 | 2,326 (+4%) | 2mo | $25,000 | $11 | 57 |
| 2329 Fort Ave | 0.14mi | 3/1.5 (-1) | 1,908 (-15%) | 8mo | $75,000 | $39 | 56 |
| 1502 Pierce St St | 0.72mi | 4/2.5 | 2,133 (-4%) | 2mo | $269,000 | $126 | 55 |
| 507 Euclid Ave | 0.33mi | 4/3.0 | 2,394 (+7%) | 16mo | $279,900 | $117 | 55 |
| 102 Yeardley Ave | 0.56mi | 4/3.0 | 2,301 (+3%) | 16mo | $299,900 | $130 | 52 |
| 2131 Westerly Dr | 0.74mi | 4/2.0 | 1,962 (-12%) | 4mo | $210,000 | $107 | 42 |
| 1403 Fillmore St. St | 0.72mi | 4/2.0 | 2,420 (+8%) | 15mo | $328,900 | $136 | 40 |
| 2100 Westerly Dr | 0.73mi | 3/2.5 (-1) | 2,538 (+14%) | 0mo | $289,900 | $114 | 36 |
| 1306 Pierce St | 0.67mi | 4/1.0 | 2,548 (+14%) | 17mo | $153,000 | $60 | 27 |
Match score weights: distance 35% · size 25% · config 20% · recency 20%. Top-matched comps best support the ARV.
Projected returns pro-forma
-3.0% appreciation · 5.11% rent growth · sell at horizon
- IRR
- 57.1%
- Equity multiple
- 3.61×
- Total profit
- $51,055
- Equity at exit
- $10,422
- IRR
- 62.8%
- Equity multiple
- 7.96×
- Total profit
- $136,302
- Equity at exit
- $6,044
Cash invested: $19,572 (down + closing). Projections, not guarantees.
Landlord ↔ Tenant lean methodology
- Overall (STATE)
- 55 Moderately Landlord-Leaning
- State Virginia
- 55 Moderately Landlord-Leaning · D+2
- County
- — inherits STATE
- City
- — inherits STATE
ZIP-level market 24502
- Rents YoY
- 5.1%
- Active inventory
- 318
- Price-to-rent
- 3.3×
Monthly cashflow live
- Estimated rent
- $1,764 high interval (Pro) →
- Mortgage (P&I)
- −$367
- Tax from tax record
- −$79 /mo · $943/yr
- Insurance
- −$29
- HOA
- −$0
- Vacancy / Maint / Mgmt
- −$370
- Net cashflow
- $919
Break-even live
UW: 25.0% down · 7.5% · 30yr · 1.5% tax · 5.0% vac · 8.0% maint · 8.0% mgmt
Financing live
Cash to close
- Down payment
- $17,475
- Closing costs
- $2,097
- Reserves months
- —
- Total cash needed
- —
Loan-product check · same deal, 3 products live
Conventional
25% down · 7.5% · 30yr
- Down + closing
- —
- Monthly P&I
- —
- Monthly cashflow
- —
- DSCR
- —
- Eligible?
- —
Personal DTI + credit; lowest rate.
DSCR
20% down · 8.5% · 30yr
- Down + closing
- —
- Monthly P&I
- —
- Monthly cashflow
- —
- DSCR
- —
- Eligible?
- —
No personal income docs; deal must DSCR.
Hard money
10% down · 12.0% · 12mo
- Down + closing
- —
- Monthly P&I
- —
- Monthly cashflow
- —
- DSCR
- —
- Eligible?
- —
Short-term bridge; refi at stabilization.
Rent comps 16 comps
| Address | Beds | Baths | Sqft | Rent | $/sqft | DOM | Units | Dist |
|---|---|---|---|---|---|---|---|---|
| 403 Grove St Lynchburg, VA | 3.0 | 2.0 | 1400 | $1,600 | $1.14 | 43d | 1 | 0.01mi |
| 630 Park Ln Lynchburg, VA | 4.0 | 1.5 | 1434 | $1,895 | $1.32 | 13d | 1 | 0.21mi |
| 320 Kenyon St Lynchburg, VA | 3.0 | 2.0 | 1736 | $1,595 | $0.92 | 43d | 1 | 0.27mi |
| 2920 Richmond St Lynchburg, VA | 4.0 | 1.0 | 1472 | $1,695 | $1.15 | 20d | 1 | 0.57mi |
| 209 Munford St Lynchburg, VA | 3.0 | 2.5 | 1420 | $1,497 | $1.05 | 44d | 1 | 0.61mi |
| 800 Pierce St Lynchburg, VA | 4.0 | 1.0 | 1714 | $1,295 | $0.76 | 43d | 1 | 0.61mi |
| 1514 Fillmore St Lynchburg, VA | 3.0 | 2.5 | 1560 | $1,800 | $1.15 | 13d | 1 | 0.76mi |
| 1518 Fillmore St Lynchburg, VA | 3.0 | 2.5 | 1560 | $1,800 | $1.15 | 13d | 1 | 0.77mi |
| 310 Yeardley Ave Lynchburg, VA | 4.0 | 2.5 | 1888 | $1,800 | $0.95 | 20d | 1 | 0.81mi |
| 812 Taylor St Lynchburg, VA | 3.0 | 2.0 | 1872 | $1,950 | $1.04 | 13d | 1 | 0.84mi |
| 1110 11th St Lynchburg, VA | 3.0 | 1.5 | 2000 | $1,450 | $0.72 | 13d | 1 | 0.86mi |
| 101 Thomas Rd Unit A Lynchburg, VA | 3.0 | 1.0 | 1530 | $1,395 | $0.91 | 43d | 1 | 0.98mi |
| 1701 Grace St Lynchburg, VA | 4.0 | 2.0 | 2173 | $1,495 | $0.69 | 13d | 1 | 1.07mi |
| 206 Connecticut Ave Lynchburg, VA | 4.0 | 2.5 | 2180 | $1,650 | $0.76 | 20d | 1 | 1.08mi |
| 1316 Harrison St Lynchburg, VA | 3.0 | 1.5 | 1535 | $1,500 | $0.98 | 43d | 1 | 1.17mi |
| 2121 Langhorne Rd Unit 11011559SF 3BR/2BA Lynchburg, VA | 3.0 | 2.0 | 1559 | $1,695 | $1.09 | 20d | 1 | 1.22mi |
Listing history 8 events
-
2026-06-10days on market $69,900 Active 10 DOM
-
2026-06-09days on market $69,900 Active 9 DOM
-
2026-06-08days on market $69,900 Active 8 DOM
-
2026-06-07days on market $69,900 Active 7 DOM
-
2026-06-03days on market $69,900 Active 3 DOM
-
2026-06-02days on market $69,900 Active 2 DOM
-
2026-06-01remarks 696-char remark
-
2026-06-01$69,900 Active 1 DOM
ⓘ Source: listings_history table (triggers on properties + properties_extension) + one-shot
backfill from property_details.listing_events for pre-trigger history.
Tax reassessment forecast VA · Resets to sale price
- Current annual tax
- $943 · $79/mo
- Projected year-2 tax
- $943 · $79/mo
- Expected delta
- $0/yr ($0/mo · 0.0%)
ⓘ Screening estimate from a state-policy table — verify with the county assessor before closing.
Climate risk First Street
- Flood 1/10 Low FEMA zone X (unshaded) · 0% chance over 30 yrs
- Wildfire 3/10 Moderate
- Heat 6/10 Major 7 d/yr ≥102°F today · 18 d/yr by 30 yrs out
- Wind 2/10 Low 2% chance of damaging wind over 30 yrs
- Air quality 2/10 Low 0 unhealthy d/yr today · 1 by 30 yrs out
Nearby sold comps map
Loading sold comps map…
Walkable amenities ~0.75 mi
Loading nearby amenities…
Taxation est. · year 1
- Rental income
- $21,165
- − Mortgage interest
- −$3,915
- − Property taxes
- −$943
- − Insurance
- −$350
- − Repairs & maintenance
- −$1,693
- − Management
- −$1,693
- − Depreciation
- −$2,033
- Taxable income
- $10,537
- Est. tax owed @ 24.0%
- −$2,529
- After-tax cash flow
- $8,500/yr
For passive investors: Depreciation is non-cash, so a rental often shows a tax loss while cash-flowing — sheltering income. Rental losses are passive: they offset passive income freely, and up to $25,000/yr can offset ordinary (W-2) income if you actively participate and your MAGI is under $100k (phasing out to $0 by $150k); unused losses carry forward. On sale, claimed depreciation is recaptured at up to 25%, and gains may owe capital-gains tax (a 1031 exchange can defer both). Figures are a year-1 estimate at your 24.0% rate — not tax advice; consult a CPA.
Schools (NCES district)
- District
- Lynchburg City Public School District
- NCES district ID
- 5102340
- Math proficiency
- 36% ▼ -38.00%
- Reading proficiency
- 61% ▼ -8.00%
- Median HH income
- $39,097
- Composite
- 40.4/100
- National rank
- #3730
- State rank
- #104 of 131 in VA
Livability — Lynchburg
- Score
- 91/100
- State rank
- #1
- US rank
- #58
Category grades
Schools grade is shown separately in the Schools card above.
Census & demographics
- Census place
- Lynchburg, VA
- County
- Lynchburg City · 97,036 people
- City population
- 97,036
- Metro
- Lynchburg, VA
- Population (ZIP)
- 41,979
- Household income
- $68,872
- Rent vs Own
- Severe rent burden
- 1774.0
Population outlook (Lynchburg County) Hauer SSP2
- Today (2025)
- 87,977 people
- By 2030
- 93,626 · +6.4%
- By 2040
- 106,145 · +20.7%
- By 2050
- 120,783 · +37.3%
- By 2075
- 162,249 · +84.4%
- By 2100
- 191,358 · +117.5%
Race, ethnicity, and origin ACS 2023
- Neighborhood character
- Predominantly White (68%)
- Race & ethnicity
- White 68% Black 19% Two or more races 6% Hispanic / Latino 6% Asian 2%
- Hispanic origin (detail)
- Mexican 2%
- Common ancestry
- Slovak 3% Italian 2% Lithuanian 2%
- Foreign-born
- 6% · Canada, South Korea, United Kingdom
- Languages at home
- 91% English-only · Spanish 4% Other Indo-European 1% Other Asian/Pacific 1%
Political lean MEDSL · Lynchburg
- 2024 margin
- Lean R (+7.9) · D 45.4% · R 53.3% · Other 1.3%
- 2008→2024 swing
- -3.9pp toward R · 2008: -4.0pp · 2024: -7.9pp
- All cycles
- 2024: R+7.9 2020: D+2.6 2016: R+9.0 2012: R+10.6 2008: R+4.0
Not yet ingested
- Civics
- —
Market trends
- HPI YoY
- ▼ -222.79%
- Current HPI
- 241.9041
- Rent YoY
- ▲ 5.11%
- Metro
- Lynchburg, VA
- State GDP YoY
- ▲ 2.40%
- F500 in state
- 50
Industry mix (Fortune 500 HQ in VA)
| Industry | F500 HQs | Revenue |
|---|---|---|
| Aerospace / Defense | 4 | $236B |
|
||
| Technology / Defense | 3 | $32B |
|
||
| Financial Services | 2 | $176B |
|
||
| Utilities | 2 | $27B |
|
||
| Insurance | 2 | $25B |
|
||
| Technology | 2 | $15B |
|
||
Price history
+75.2% since first listed5 events — show timeline
- 2026-05-31 Listed $69,900 LMLS
- 2010-12-21 Sold (Public Records) $25,000 Public Records
- 2010-12-20 Sold (MLS) $25,000 MLSRV
- 2010-09-14 Listed $39,900 MLSRV
- 2010-09-09 Listed $39,900 CAAR
Property tax history
+4.2%/yrLatest (2025): $943 · +27.9% YoY. Source: county tax records.
Cash-flow waterfall
monthlySold comps — $/sqft
last 12 mo · ≤1 miLoading sold comps…