 Duplex
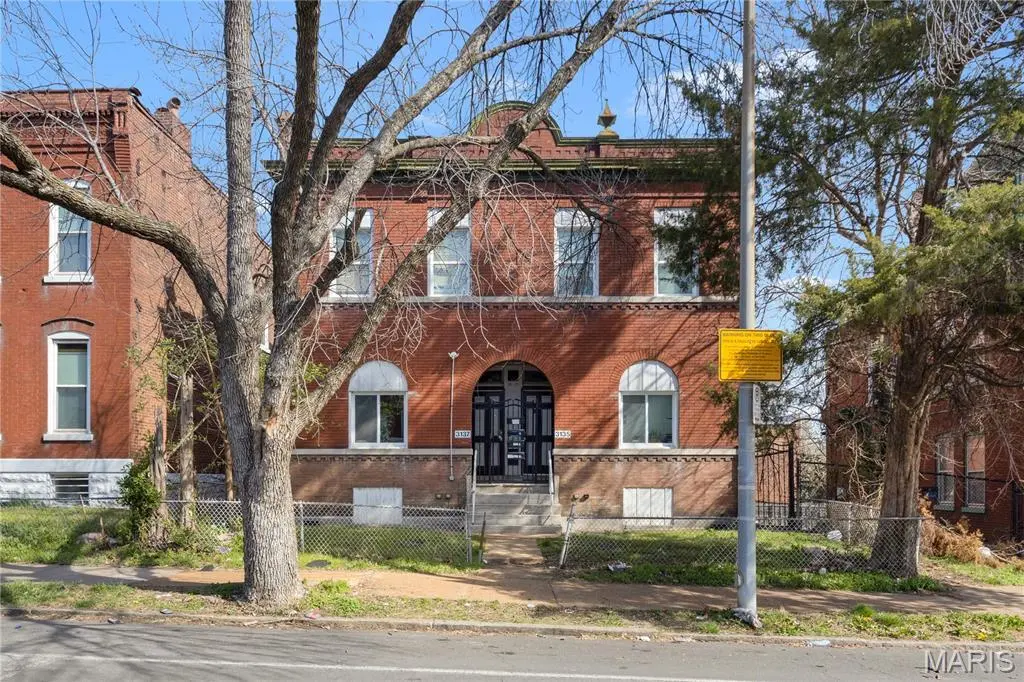
3135-3137 Chippewa St · St. Louis, MO
Flood risk 1/10 · Minimal
- FEMA flood zone
- X (unshaded)
- Chance of flooding over 30 yrs
- 0.0%
- Est. flood insurance / yr
- $473 – $860
Fire risk 1/10 · Minimal
- Est. fire insurance / yr
- $1,054 – $1,958
Heat risk 6/10 · Moderate
- Hot days now (above 108°F)
- 7 days/yr
- Hot days in 30 yrs
- 21 days/yr
Wind risk 2/10 · Minimal
- Chance of severe wind over 30 yrs
- 1.0%
Air-quality risk 3/10 · Minor
- Unhealthy air days now
- 3 days/yr
- Unhealthy air days in 30 yrs
- 4 days/yr
Risk factors via First Street. Map © Google.
Why this score? — see what drove the B- grade
The composite is a weighted blend of 9 inputs, each scored 0–100. Each bar is that input's sub-score; the figure is the points it added to the 100-point composite (weight × sub-score).
- Cash flow +28.3/30.0
- ARV discount +11.5/15.0
- DSCR +10.0/10.0
- 1% rule +7.8/10.0
- Condition / age +3.8/5.0
- Rent growth +3.7/5.0
- Livability +2.5/5.0
- Schools +1.2/10.0
- Appreciation +0.0/10.0
$224,000
🖨 Deal sheet 📄 Offer letter ✓ Due diligence
Multi-family units
County records classify this as Multi-Family (5+ Unit). Listing-text estimate: 2 units. estimate disagrees with records
5+ unit building — per-unit beds/baths from public records are typically unavailable; the breakdown below (if shown) is an estimate from the listing text.
Listing remarks MLS
Welcome to 3135–3137 Chippewa St, a solid investment opportunity in the heart of South St. Louis. This well-located duplex offers strong rental potential with all four units currently occupied. Each unit features spacious layouts, functional floor plans, and great natural light. Conveniently located near major roadways, local shops, and dining, this is a great addition to any investor’s portfolio. Highlights: 4-unit brick building, all units occupied New Roof Two units with updated kitchens Two units with new furnaces New plumbing waste stack on 3137 side New fences and gates Recently tuck pointed Some updated windows New vinyl plank in one unit Four new refrigerators and four new stoves
Key facts
- New furnaces
- Updated kitchens
- New roof
Tags
Neighborhood map
What this means for you Summary
Snapshot
- This is a 2 × 2-bed/?-bath units multifamily listed at $224k. Condition is rated good.
Deal economics
- At list price, monthly cash flow is $719 ($9k/yr) — positive. Per door: $360/mo.
- The deal already cash-flows at list — no discount required.
- Meets the 1% rule at list price ($3k rent vs $224k).
- Recommended offer: $211k (6.0% below list) — sets the bar for market timing.
- Cap rate 10.1% vs local median 5.0% in St. Louis — top-decile yield for the area; either an underpriced asset or a hidden risk that comps aren't pricing in. Stress-test before assuming the spread holds.
Location & tenants
- Location reads: area grade B — affects rentability + tenant quality, not the cash-flow math above.
- St. Louis City (urban): math 10% / reading 18% proficiency, ranked #312 of 324 in MO (top 96%) — low school quality limits family demand, transient renter base, plan for 1-2y turnover; 80% free/reduced lunch — lower-income household profile, screen leases tightly.
- Market conditions: Rents rising fast (+4.9%/yr); 240 active listings in the ZIP; 1 comparable units currently listed for rent nearby; 294 units permitted in St. Louis city in 2024 (227 in 5+ unit buildings).
- At $2,870/mo this rent would consume 60% of the median local household income ($58k/yr) (locally 1495% of renters already pay >50% of income on rent) — very limited rent-growth headroom before tenants either downsize or default.
Forward outlook
- Local home prices are declining (-3.0%/yr); year-one equity from $2k of loan paydown is wiped out by about $7k of value loss. Plan a longer hold.
- St. Louis County population projected to shrink 6% by 2050 — rents likely to lag national; underwrite the cash flow, not the appreciation.
- At projected returns (-3.0% appreciation + 4.9% rent growth), your $63k cash investment doubles in ~8 years — after that, you're playing with house money.
Negotiation context
- It's been on market 81 days — a 6% lower offer ($211k) is reasonable based on typical stale-listing flexibility.
- 6 sale attempts; this cycle's ask has dropped $25k (10%) from the opening price — seller is motivated, your offer sets the floor, not the list.
Risks & watch-outs
- Watch-outs: built in 1907 — expect roof / HVAC / electrical / plumbing capex.
- Climate carrying-cost: extreme-heat days projected 7→21/yr by 2055 (HVAC capex compounding) — expect insurance premiums to compound above CPI over the hold.
Questions for the listing agent
- It's been on market 81 days. Have you received any prior offers? Is the seller open to a 6% concession, seller financing, or rate buy-down credit?
- Can we see the unit-by-unit rent roll, current vacancy, and any below-market leases? What's the average tenancy length?
- What capital expenditures (roof, boiler, parking lot, exteriors) have been made in the last 5 years, and what's planned in the next 2?
- Built in 1907 — when were the roof, HVAC, electrical panel, plumbing, and water heater last replaced?
- Why hasn't it sold? Are there any deal-killer items the seller is aware of (foundation, flood, title, zoning, code violations)?
- Is there a deadline driving the sale (1031 exchange, divorce, estate, relocation)? That informs how much negotiation room exists.
- What's the average days-on-market for RENTAL listings here right now (not sales)? A rising rental-DOM trend means longer vacancies and softer asking-rent achievability than the comps imply.
- What's the recent tenant-quality profile in this submarket — average credit score on applications, eviction rate, late-payment / NSF rate, and stable-employment percentage? A property-management company in the area should have these aggregated.
- How much new apartment / multifamily construction is in the pipeline within 1–3 miles? Heavy new supply (>2% of stock underway) typically softens rents 12–24 months out; light construction supports rent growth.
Investment metrics
- 1% rule
- 1.28% ✓
- Cap rate
- 10.15%
- Cash-on-cash
- 13.76%
- DSCR
- 1.61
- GRM
- 6.5
CMA / ARV
- ARV (median comp)
- $245,685
- List price
- $224,000
- Delta
- -8.83%
- Verdict
- FAIR
- Comps
- 20 within 1.0 mi
Show comp detail 12 sales within ~0.75 mi
| Address | Dist | Beds/Ba | Sqft | Sold | Price | $/sf | Match |
|---|---|---|---|---|---|---|---|
| 3435 Alberta St | 0.30mi | 4/4.0 | 3,850 (+1%) | 5mo | $160,000 | $42 | 80 |
| 3526 Minnesota Ave | 0.32mi | 4/4.0 | 3,516 (-8%) | 1mo | $220,000 | $63 | 72 |
| 3136 Chippewa St | 0.03mi | 3/2.0 (-1) | 3,922 (+3%) | 13mo | $249,000 | $63 | 70 |
| 3446 Texas Ave Unit 1,2,3,4 | 0.66mi | 4/4.0 | 3,656 (-4%) | 5mo | $135,000 | $37 | 58 |
| 4015 California Ave | 0.44mi | 4/4.0 | 3,500 (-8%) | 11mo | $235,000 | $67 | 57 |
| 3720 Winnebago St | 0.56mi | 4/4.0 | 3,340 (-12%) | 2mo | $280,000 | $84 | 51 |
| 4121 Michigan Ave | 0.43mi | 4/4.0 | 3,336 (-12%) | 14mo | $260,000 | $78 | 48 |
| 3246-48 Nebraska Ave | 0.68mi | 5/4.0 (+1) | 4,046 (+6%) | 8mo | $339,000 | $84 | 46 |
| 3420 Klocke St | 0.50mi | 4/4.0 | 3,344 (-12%) | 14mo | $225,000 | $67 | 44 |
| 4226 Dewey Ave | 0.68mi | 4/4.0 | 3,536 (-7%) | 15mo | $279,900 | $79 | 44 |
| 4102 California Ave | 0.53mi | 5/5.0 (+1) | 3,420 (-10%) | 9mo | $375,000 | $110 | 42 |
| 3706 Hydraulic Ave | 0.71mi | 4/4.0 | 3,294 (-14%) | 14mo | $250,000 | $76 | 33 |
Match score weights: distance 35% · size 25% · config 20% · recency 20%. Top-matched comps best support the ARV.
Projected returns pro-forma
-3.0% appreciation · 4.89% rent growth · sell at horizon
- IRR
- 6.1%
- Equity multiple
- 1.24×
- Total profit
- $15,118
- Equity at exit
- $33,399
- IRR
- 17.1%
- Equity multiple
- 2.53×
- Total profit
- $96,046
- Equity at exit
- $19,367
Cash invested: $62,720 (down + closing). Projections, not guarantees.
Landlord ↔ Tenant lean methodology
- Overall (STATE)
- 81 Strongly Landlord-Friendly
- State Missouri
- 81 Strongly Landlord-Friendly · R+10
- County
- — inherits STATE
- City
- — inherits STATE
ZIP-level market 63118
- Rents YoY
- 4.9%
- Active inventory
- 240
- Price-to-rent
- 13.0×
Monthly cashflow live
- Estimated rent
- $2,870 high interval (Pro) →
- Mortgage (P&I)
- −$1,175
- Tax est. 1.5%
- −$280 /mo · $3,360/yr
- Insurance
- −$93
- HOA
- −$0
- Vacancy / Maint / Mgmt
- −$603
- Net cashflow
- $719
Break-even live
2-unit breakdown (identical units grouped — click to expand)
| Units | Beds | Baths | Est. rent |
|---|---|---|---|
| 2× units | 2 | — | $2,870 |
| #1 | 2 | — | $1,435 |
| #2 | 2 | — | $1,435 |
| Total (2 units) | $2,870 | ||
UW: 25.0% down · 7.5% · 30yr · 1.5% tax · 5.0% vac · 8.0% maint · 8.0% mgmt
Financing live
Cash to close
- Down payment
- $56,000
- Closing costs
- $6,720
- Reserves months
- —
- Total cash needed
- —
Loan-product check · same deal, 3 products live
Conventional
25% down · 7.5% · 30yr
- Down + closing
- —
- Monthly P&I
- —
- Monthly cashflow
- —
- DSCR
- —
- Eligible?
- —
Personal DTI + credit; lowest rate.
DSCR
20% down · 8.5% · 30yr
- Down + closing
- —
- Monthly P&I
- —
- Monthly cashflow
- —
- DSCR
- —
- Eligible?
- —
No personal income docs; deal must DSCR.
Hard money
10% down · 12.0% · 12mo
- Down + closing
- —
- Monthly P&I
- —
- Monthly cashflow
- —
- DSCR
- —
- Eligible?
- —
Short-term bridge; refi at stabilization.
Rent comps 1 comps
| Address | Beds | Baths | Sqft | Rent | $/sqft | DOM | Units | Dist |
|---|---|---|---|---|---|---|---|---|
| 2811 Missouri Ave Saint Louis, MO | 4.0 | 2.5 | 2673 | $3,622 | $1.36 | 43d | 1 | 1.32mi |
Listing history 27 events
-
2026-06-18days on market $224,000 Active 81 DOM
-
2026-06-17days on market $224,000 Active 80 DOM
-
2026-06-16days on market $224,000 Active 79 DOM
-
2026-06-15days on market $224,000 Active 78 DOM
-
2026-06-13days on market $224,000 Active 76 DOM
-
2026-06-09days on market $224,000 Active 72 DOM
-
2026-06-08days on market $224,000 Active 71 DOM
-
2026-06-08days on market $224,000 Active 70 DOM
-
2026-06-05days on market $224,000 Active 67 DOM
-
2026-06-03days on market $224,000 Active 66 DOM
-
2026-06-02days on market $224,000 Active 65 DOM
-
2026-06-02price $224,000 Active 64 DOM
-
2026-06-01days on market $234,000 Active 64 DOM
-
2026-05-31days on market $234,000 Active 63 DOM
-
2026-04-25price $234,000 715-char remark
Show marketing remark (715 chars)
Welcome to 3135–3137 Chippewa St, a solid investment opportunity in the heart of South St. Louis. This well-located duplex offers strong rental potential with all four units currently occupied. Each unit features spacious layouts, functional floor plans, and great natural light. Conveniently located near major roadways, local shops, and dining, this is a great addition to any investor’s portfolio. Highlights: 4-unit brick building, all units occupied New Roof Two units with updated kitchens Two units with new furnaces New plumbing waste stack on 3137 side New fences and gates Recently tuck pointed Some updated windows New vinyl plank in one unit Four new refrigerators and four new stoves
-
2026-03-30$249,000 Active 715-char remark
Show marketing remark (715 chars)
Welcome to 3135–3137 Chippewa St, a solid investment opportunity in the heart of South St. Louis. This well-located duplex offers strong rental potential with all four units currently occupied. Each unit features spacious layouts, functional floor plans, and great natural light. Conveniently located near major roadways, local shops, and dining, this is a great addition to any investor’s portfolio. Highlights: 4-unit brick building, all units occupied New Roof Two units with updated kitchens Two units with new furnaces New plumbing waste stack on 3137 side New fences and gates Recently tuck pointed Some updated windows New vinyl plank in one unit Four new refrigerators and four new stoves
-
2026-01-30historical $625
-
2026-01-09$625
-
2025-12-17historical $625
-
2025-11-04$625
-
2025-09-22historical $675
-
2025-08-24price $675
-
2025-08-02$715
-
2025-07-21historical $625
-
2025-07-16$625
-
2025-07-02historical $625
-
2025-06-18$625
ⓘ Source: listings_history table (triggers on properties + properties_extension) + one-shot
backfill from property_details.listing_events for pre-trigger history.
Climate risk First Street
- Flood 1/10 Low FEMA zone X (unshaded) · 0% chance over 30 yrs
- Wildfire 1/10 Low
- Heat 6/10 Major 7 d/yr ≥108°F today · 21 d/yr by 30 yrs out
- Wind 2/10 Low 100% chance of damaging wind over 30 yrs
- Air quality 3/10 Moderate 3 unhealthy d/yr today · 4 by 30 yrs out
Nearby sold comps map
Loading sold comps map…
Walkable amenities ~0.75 mi
Loading nearby amenities…
Taxation est. · year 1
- Rental income
- $34,440
- − Mortgage interest
- −$12,547
- − Property taxes
- −$3,360
- − Insurance
- −$1,120
- − Repairs & maintenance
- −$2,755
- − Management
- −$2,755
- − Depreciation
- −$6,516
- Taxable income
- $5,386
- Est. tax owed @ 24.0%
- −$1,293
- After-tax cash flow
- $7,339/yr
For passive investors: Depreciation is non-cash, so a rental often shows a tax loss while cash-flowing — sheltering income. Rental losses are passive: they offset passive income freely, and up to $25,000/yr can offset ordinary (W-2) income if you actively participate and your MAGI is under $100k (phasing out to $0 by $150k); unused losses carry forward. On sale, claimed depreciation is recaptured at up to 25%, and gains may owe capital-gains tax (a 1031 exchange can defer both). Figures are a year-1 estimate at your 24.0% rate — not tax advice; consult a CPA.
Condition & rehab AI · 12 photos
This 4-unit brick building is in good condition with updated kitchens and bathrooms, new roof, and new furnaces. It offers strong rental potential and is ready for investors to move in.
Value-add opportunities
- Both Paint exterior brick — Enhances curb appeal and can increase both resale and rental value
- Both Replace ceiling fans with energy-efficient models — Saves on energy costs and improves comfort
- Both Install smart thermostats in each unit — Reduces energy consumption and can be marketed as energy-efficient
Renovation cost estimate screening
Value-add ROI direction
- Both Paint exterior brick — Enhances curb appeal and can increase both resale and rental value ↑
- Both Replace ceiling fans with energy-efficient models — Saves on energy costs and improves comfort ↑
- Both Install smart thermostats in each unit — Reduces energy consumption and can be marketed as energy-efficient ↑
ⓘ Cost ranges are severity-bucket heuristics (US national rule-of-thumb). Get contractor quotes + a written scope before underwriting a rehab budget.
Schools (NCES district)
- District
- St. Louis City
- NCES district ID
- 2929280
- Math proficiency
- 10% ▼ -6.00%
- Reading proficiency
- 18% ▼ -3.00%
- Median HH income
- $35,685
- Composite
- 11.54/100
- National rank
- #9699
- State rank
- #312 of 324 in MO
Livability — St. Louis
No livability data for this city. (Only ~50 U.S. cities are tracked.)
Census & demographics
- Census place
- St. Louis, MO
- County
- Saint Louis City · 254,015 people
- City population
- 283,259
- Metro
- St. Louis, MO-IL
- Population (ZIP)
- 25,913
- Household income
- $57,762
- Rent vs Own
- Severe rent burden
- 1495.0
Population outlook (St. Louis County) Hauer SSP2
- Today (2025)
- 315,737 people
- By 2030
- 313,865 · -0.6%
- By 2040
- 305,439 · -3.3%
- By 2050
- 296,529 · -6.1%
- By 2075
- 271,028 · -14.2%
- By 2100
- 255,359 · -19.1%
Race, ethnicity, and origin ACS 2023
- Neighborhood character
- Diverse neighborhood (Simpson 0.63)
- Race & ethnicity
- White 44% Black 41% Two or more races 8% Hispanic / Latino 8% Asian 2%
- Hispanic origin (detail)
- Mexican 6%
- Common ancestry
- Slovak 2% Lithuanian 2% Romanian 2%
- Foreign-born
- 6% · Canada, Vietnam
- Languages at home
- 90% English-only · Spanish 5% Vietnamese 1% French/Haitian/Cajun 1%
Political lean MEDSL · St. Louis
- 2024 margin
- Solid D (+64.7) · D 81.4% · R 16.7% · Other 2.0%
- 2008→2024 swing
- -3.5pp toward R · 2008: 68.2pp · 2024: 64.7pp
- All cycles
- 2024: D+64.7 2020: D+66.2 2016: D+63.7 2012: D+66.6 2008: D+68.2
Not yet ingested
- Civics
- —
Market trends
- HPI YoY
- ▼ -347.51%
- Current HPI
- 171.5963
- Rent YoY
- ▲ 4.89%
- Metro
- St. Louis, MO-IL
- State GDP YoY
- ▲ 1.84%
- F500 in state
- 20
Industry mix (Fortune 500 HQ in MO)
| Industry | F500 HQs | Revenue |
|---|---|---|
| Healthcare | 1 | $163B |
|
||
| Insurance | 1 | $21B |
|
||
| Industrial Technology | 1 | $17B |
|
||
| Retail | 1 | $16B |
|
||
| Industrial Distribution | 1 | $10B |
|
||
| Utilities | 1 | $9B |
|
||
Price history
-6.0% since first listed13 events — show timeline
- 2026-04-25 Price Changed $234,000 MARIS as Distributed by MLS Grid
- 2026-03-30 Listed $249,000 MARIS as Distributed by MLS Grid
- 2026-01-30 Rental Removed $625 MARIS
- 2026-01-09 Listed for Rent $625 MARIS
- 2025-12-17 Rental Removed $625 MARIS
- 2025-11-04 Listed for Rent $625 MARIS
- 2025-09-22 Rental Removed $675 MARIS
- 2025-08-24 Price Changed $675 MARIS
- 2025-08-02 Listed for Rent $715 MARIS
- 2025-07-21 Rental Removed $625 MARIS
- 2025-07-16 Listed for Rent $625 MARIS
- 2025-07-02 Rental Removed $625 MARIS
- 2025-06-18 Listed for Rent $625 MARIS
Cash-flow waterfall
monthlySold comps — $/sqft
last 12 mo · ≤1 miLoading sold comps…