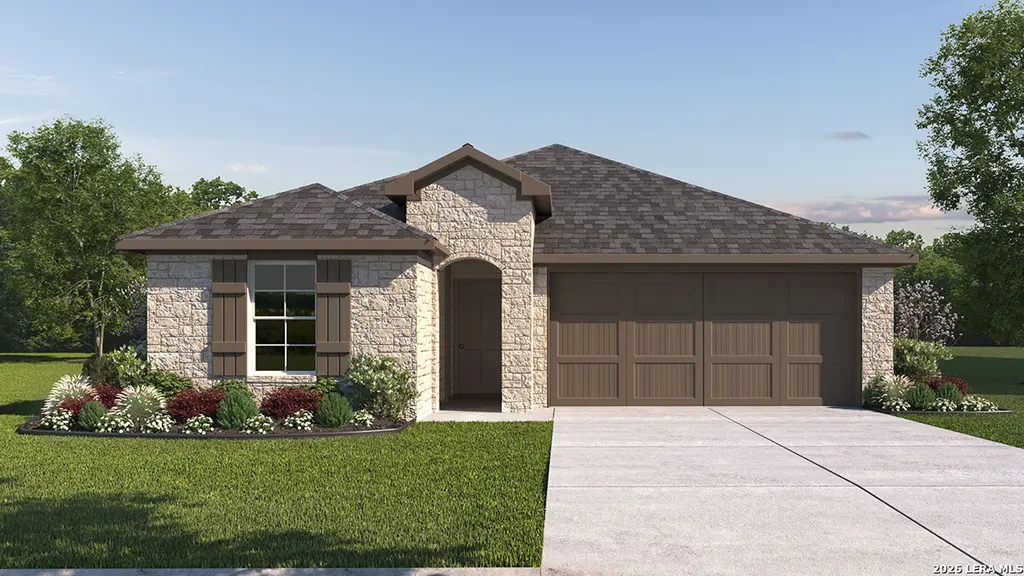
20925 Gravel Keep · San Antonio, TX
Flood risk No data
- FEMA flood zone
- —
- Chance of flooding over 30 yrs
- —
- Est. flood insurance / yr
- —
Fire risk No data
- Est. fire insurance / yr
- —
Heat risk No data
- Hot days now (above threshold)
- —
- Hot days in 30 yrs
- —
Wind risk No data
- Chance of severe wind over 30 yrs
- —
Air-quality risk No data
- Unhealthy air days now
- —
- Unhealthy air days in 30 yrs
- —
Risk factors via First Street. Map © Google.
Why this score? — see what drove the D- grade
The composite is a weighted blend of 9 inputs, each scored 0–100. Each bar is that input's sub-score; the figure is the points it added to the 100-point composite (weight × sub-score).
- Appreciation +10.0/10.0
- ARV discount +7.4/15.0
- Cash flow +6.7/30.0
- Livability +4.0/5.0
- Schools +3.8/10.0
- Rent growth +2.5/5.0
- Condition / age +2.5/5.0
- DSCR +1.0/10.0
- 1% rule +0.6/10.0
$401,000
🖨 Deal sheet (PDF) 📄 Offer letter ✓ Due diligence
Listing remarks MLS
The property is located at 20925 Gravel Keep SAN ANTONIO TX 78266 priced at 401000, the square foot and stories are 1595, 1.The number of bath is 2, halfbath is 0 there are 3 bedrooms and 2 garages. For more details please, call or email.
Key facts
- Quartz countertops
- Farmhouse sink
- Granite countertops
Tags
Property features AI
Finance
- Other: Subdivision: Brookstone Creek
- HOA & community: Mandatory HOA; Annual HOA fee of $960; Association transfer fee applies; Community amenities: pool, clubhouse, park/playground, sports court, basketball court, BBQ/grill
Exterior
- Parking: Attached 2-car garage
- Security: Security system (owned); Garage door opener
- Utilities: Water service (SAWS); Sewer system; Electricity supplied by CPS; Gas supplied by CPS; HERS rated
- Home design: New construction by D.R. Horton; Stone/rock and siding exterior with one side masonry; Slab foundation; Composition roof
- Construction: Built by D.R. Horton; New
- Exterior features: Covered patio; Privacy fence; Sprinkler system; Double pane windows; Street paved with curbs and sidewalks; Streetlights
Interior
- Kitchen: Island kitchen; Stove/Range (gas); Microwave; Dishwasher; Disposal; Ice maker connection
- Bedrooms: Primary bedroom with walk-in closet and full bath (13 x 17); Bedroom 2 (10 x 10); Bedroom 3 (10 x 10)
- Flooring: Carpeting; Laminate flooring
- Bathrooms: Two full bathrooms; Primary bath with shower only and single and double vanities (9 x 8)
- Heating & cooling: Central heating (natural gas); Central air conditioning
- Interior features: Open floor plan with living/dining combination; Eat-in kitchen with island and walk-in pantry; Utility room inside; Laundry on main level; Attic with pull-down stairs; Attic with radiant barrier decking; High-speed internet; All window coverings remain; Garage door opener; Water softener plumbing; Smoke alarms and carbon monoxide detector; Security system (owned); Gas water heater
- Laundry & utility: Washer and dryer connections; Laundry room on main level; Utility room inside
Neighborhood map
What this means for you Summary
Snapshot
- This is a 3-bed/2.0-bath single-family listed at $401k.
Deal economics
- At list price, monthly cash flow is $-641 ($-8k/yr) — negative.
- To cash-flow at today's rent, offer at most $288k (28.2% below list).
- To meet the 1% rule (rent ≥ 1% of price), the offer needs to be $225k (43.9% below list).
- Recommended offer: $225k (43.9% below list) — sets the bar for 1% rule.
Location & tenants
- Location reads 80/100 on livability (#31 in TX, #1,616 nationally) — a professional / high-income tenant draw. Strengths: amenities A+, commute A+, cost of living A+; Watch: crime F.
- North East ISD (urban): math 38% / reading 49% proficiency, ranked #276 of 826 in TX (top 33%) — families likely to look elsewhere, expect single-tenant / working-renter base with shorter leases.
- Zoned schools: Bulverde Creek (math 51% / reading 58%, grade C, #621 of 4,322 statewide, top 15%, 1,003 students, 39% FRL); Hill Middle (math 51% / reading 64%, grade B, #206 of 1,662 statewide, top 13%, 1,044 students, 28% FRL); Johnson H S (math 69% / reading 80%, grade B+, #82 of 1,632 statewide, top 6%, 3,202 students, 24% FRL).
- Zoned-school proficiency averages 62% at this address vs 44% district-wide (+19 pts) — the actual schools serving this property are materially stronger than the North East ISD average implies; a family-tenant draw the district grade alone would hide.
- Market conditions: 230 active listings in the ZIP; 27 comparable units currently listed for rent nearby; rentals at typical pace (median 16d on market — plan ~3-4 weeks tenant-placement turnaround); 8,308 units permitted in Bexar County in 2024 (2,506 in 5+ unit buildings).
Forward outlook
- In year one you build about $43k of equity ($3k loan paydown + $40k appreciation (10.0% local appreciation)).
- Bexar County population projected at +50% by 2050 — long-run rental-demand tailwind backs the buy-and-hold thesis.
- By year 2, paydown + projected appreciation supports a ~$69k cash-out refi (75% LTV) — recoverable capital for the next deal without selling this one.
Negotiation context
- It's been on market 15 days — a 2% lower offer ($395k) is reasonable based on typical stale-listing flexibility.
- 3 sale attempts with the ask held roughly flat each time — persistent listings suggest the price (not the market) is what's stuck; bring a comps-based counter.
Questions for the listing agent
- What do current leases actually rent for vs. the listed asking? Can we see a recent rent roll and the last 12 months of T-12 income?
- What does the HOA fee cover, when was the last increase, and are there any pending special assessments or reserve-fund shortfalls?
- Is there a deadline driving the sale (1031 exchange, divorce, estate, relocation)? That informs how much negotiation room exists.
- Crime grade is F in this area — have there been break-ins, vandalism, or insurance claims at this property in the last 3 years? What carrier currently insures it and at what premium?
- The area grade is low — what's the realistic commute time and amenity access for the typical tenant pool here? Any planned neighborhood developments (good or bad) we should know about?
- What's the average days-on-market for RENTAL listings here right now (not sales)? A rising rental-DOM trend means longer vacancies and softer asking-rent achievability than the comps imply.
- What's the recent tenant-quality profile in this submarket — average credit score on applications, eviction rate, late-payment / NSF rate, and stable-employment percentage? A property-management company in the area should have these aggregated.
- How much new for-sale + rental construction is in the pipeline within 1–3 miles? Heavy new supply typically softens prices + rents 12–24 months out; constrained supply supports both.
Investment metrics
- 1% rule
- 0.56% ✗
- Cap rate
- 4.38%
- Cash-on-cash
- -6.85%
- DSCR
- 0.70
- GRM
- 14.9
CMA / ARV
- ARV (median comp)
- $400,328
- List price
- $401,000
- Delta
- 0.17%
- Verdict
- FAIR
- Comps
- 20 within 1.0 mi
Show comp detail 12 sales within ~0.75 mi
| Address | Dist | Beds/Ba | Sqft | Sold | Price | $/sf | Match |
|---|---|---|---|---|---|---|---|
| 21126 Boulder Flts | 0.14mi | 3/2.0 | 1,595 (0%) | 0mo | $379,950 | $238 | 93 |
| 21118 Boulder Flts | 0.13mi | 4/2.0 (+1) | 1,680 (+5%) | 1mo | $367,950 | $219 | 79 |
| 21162 Boulder Flts | 0.21mi | 4/2.0 (+1) | 1,680 (+5%) | 1mo | $368,950 | $220 | 75 |
| 20921 Gravel Keep | 0.01mi | 4/2.5 (+1) | 1,823 (+14%) | 0mo | $424,105 | $233 | 68 |
| 21130 Boulder Flts | 0.15mi | 4/2.0 (+1) | 1,778 (+12%) | 1mo | $387,950 | $218 | 68 |
| 21150 Boulder Flts | 0.19mi | 4/2.0 (+1) | 1,778 (+12%) | 1mo | $384,950 | $217 | 66 |
| 20944 Gravel Keep | 0.06mi | 4/2.5 (+1) | 1,823 (+14%) | 0mo | $417,500 | $229 | 66 |
| 21117 Boulder Flts | 0.11mi | 4/2.5 (+1) | 1,823 (+14%) | 3mo | $415,000 | $228 | 62 |
| 21129 Boulder Flts | 0.13mi | 4/2.5 (+1) | 1,823 (+14%) | 3mo | $415,001 | $228 | 61 |
| 21138 Boulder Flts | 0.17mi | 4/2.5 (+1) | 1,823 (+14%) | 2mo | $393,950 | $216 | 60 |
| 21154 Boulder Flts | 0.20mi | 4/2.5 (+1) | 1,823 (+14%) | 2mo | $391,950 | $215 | 58 |
| 21170 Boulder Flts | 0.23mi | 4/2.5 (+1) | 1,823 (+14%) | 3mo | $390,950 | $214 | 56 |
Match score weights: distance 35% · size 25% · config 20% · recency 20%. Top-matched comps best support the ARV.
Projected returns pro-forma
10.0% appreciation · 3.0% rent growth · sell at horizon
- IRR
- 19.4%
- Equity multiple
- 2.58×
- Total profit
- $177,413
- Equity at exit
- $361,253
- IRR
- 17.9%
- Equity multiple
- 5.94×
- Total profit
- $554,171
- Equity at exit
- $779,055
Cash invested: $112,280 (down + closing). Projections, not guarantees.
Landlord ↔ Tenant lean methodology
- Overall (STATE)
- 87 Strongly Landlord-Friendly
- State Texas
- 87 Strongly Landlord-Friendly · R+5
- County
- — inherits STATE
- City
- — inherits STATE
ZIP-level market 78266
- Home prices YoY
- 3.9%
- Active inventory
- 230
- Price-to-rent
- 14.9×
Monthly cashflow live
- Estimated rent
- $2,249 high interval (Pro) →
- Mortgage (P&I)
- −$2,103
- Tax from tax record
- −$68 /mo · $811/yr
- Insurance
- −$167
- HOA
- −$80
- Vacancy / Maint / Mgmt
- −$472
- Net cashflow
- $-641
Break-even live
Sensitivity live
| Price | -10% $-414 | -5% $-527 | +0% $-641 | +5% $-1,213 | +10% $-1,351 |
|---|---|---|---|---|---|
| Rent | -10% $-818 | -5% $-729 | +0% $-641 | +5% $-552 | +10% $-463 |
| Rate | -1.0pp $-439 | -0.5pp $-539 | base $-641 | +0.5pp $-744 | +1.0pp $-850 |
UW: 25.0% down · 7.5% · 30yr · 1.5% tax · 5.0% vac · 8.0% maint · 8.0% mgmt
Financing live
Cash to close
- Down payment
- $100,250
- Closing costs
- $12,030
- Reserves months
- —
- Total cash needed
- —
Loan-product check · same deal, 3 products live
Conventional
25% down · 7.5% · 30yr
- Down + closing
- —
- Monthly P&I
- —
- Monthly cashflow
- —
- DSCR
- —
- Eligible?
- —
Personal DTI + credit; lowest rate.
DSCR
20% down · 8.5% · 30yr
- Down + closing
- —
- Monthly P&I
- —
- Monthly cashflow
- —
- DSCR
- —
- Eligible?
- —
No personal income docs; deal must DSCR.
Hard money
10% down · 12.0% · 12mo
- Down + closing
- —
- Monthly P&I
- —
- Monthly cashflow
- —
- DSCR
- —
- Eligible?
- —
Short-term bridge; refi at stabilization.
Rent comps 27 comps
| Address | Beds | Baths | Sqft | Rent | $/sqft | DOM | Units | Dist |
|---|---|---|---|---|---|---|---|---|
| 20859 Rindle Ln San Antonio, TX | 4.0 | 3.0 | 2032 | $2,500 | $1.23 | 21d | 1 | 0.28mi |
| 5103 Gully Way San Antonio, TX | 4.0 | 2.0 | 1778 | $2,200 | $1.24 | 14d | 1 | 0.31mi |
| 21027 Watercourse Way San Antonio, TX | 4.0 | 2.5 | 1823 | $2,195 | $1.20 | 22d | 1 | 0.32mi |
| 5015 Gully Way San Antonio, TX | 4.0 | 2.5 | 2023 | $2,400 | $1.19 | 0d | 1 | 0.34mi |
| 5536 Jewel Curv San Antonio, TX | 4.0 | 2.0 | 1750 | $2,500 | $1.43 | 45d | 1 | 0.39mi |
| 5518 Stormie Keep San Antonio, TX | 4.0 | 2.0 | 1779 | $2,250 | $1.26 | 4d | 1 | 0.44mi |
| 5518 Stormie Keep San Antonio, TX | 4.0 | 2.0 | 1778 | $2,250 | $1.27 | 3d | 1 | 0.44mi |
| 21339 Watercourse Way San Antonio, TX | 4.0 | 2.5 | 2171 | $2,300 | $1.06 | 46d | 1 | 0.45mi |
| 5714 Pin Pt San Antonio, TX | 4.0 | 2.5 | 2146 | $2,400 | $1.12 | 0d | 1 | 0.45mi |
| 5602 Chestnut Xing San Antonio, TX | 3.0 | 2.5 | 1958 | $2,250 | $1.15 | 25d | 1 | 0.54mi |
| 21514 Thunder Basin San Antonio, TX | 3.0 | 2.5 | 1928 | $2,100 | $1.09 | 19d | 1 | 0.79mi |
| 4610 Sebastian Oak San Antonio, TX | 3.0 | 2.0 | 2094 | $2,095 | $1.00 | 19d | 1 | 0.82mi |
| 4526 Bexley Trl San Antonio, TX | 3.0 | 2.0 | 1657 | $1,975 | $1.19 | 3d | 1 | 0.89mi |
| 20803 Cape Coral San Antonio, TX | 4.0 | 2.0 | 1699 | $2,200 | $1.29 | 15d | 1 | 0.97mi |
| 22507 Green Jacket San Antonio, TX | 3.0 | 2.0 | 1535 | $2,100 | $1.37 | 45d | 1 | 1.03mi |
| 5707 Tpc Pkwy San Antonio, TX | 4.0 | 1.0–3.0 | 1013 | $1,564 | $1.54 | 3d | 19 | 1.07mi |
| 22618 Double Bogey San Antonio, TX | 4.0 | 2.0 | 1720 | $1,950 | $1.13 | 5d | 1 | 1.08mi |
| 5131 Blind Shot San Antonio, TX | 4.0 | 2.0 | 1572 | $2,100 | $1.34 | 45d | 1 | 1.10mi |
| 5951 Southern Knl San Antonio, TX | 3.0 | 2.0 | 1648 | $2,500 | $1.52 | 0d | 1 | 1.11mi |
| 5714 Agave Spine San Antonio, TX | 4.0 | 3.0 | 2011 | $2,600 | $1.29 | 45d | 1 | 1.21mi |
| 5505 TPC Pkwy Unit 3213 San Antonio, TX | 3.0 | 2.0 | 1895 | $2,438 | $1.29 | 0d | 1 | 1.24mi |
| 5505 TPC Pkwy Unit 2213 San Antonio, TX | 2.0 | 2.0 | 1141 | $1,628 | $1.43 | 0d | 1 | 1.24mi |
| 6015 Akin Stroll San Antonio, TX | 3.0 | 2.0 | 1534 | $2,100 | $1.37 | 45d | 1 | 1.26mi |
| 22763 Tee Shot San Antonio, TX | 3.0 | 2.5 | 2041 | $2,300 | $1.13 | 45d | 1 | 1.27mi |
| 5819 Akin Pl San Antonio, TX | 4.0 | 2.0 | 1648 | $1,800 | $1.09 | 25d | 1 | 1.34mi |
| 23215 Langdon Lndg San Antonio, TX | 4.0 | 2.5 | 2075 | $2,550 | $1.23 | 4d | 1 | 1.39mi |
| 6035 Akin Pl San Antonio, TX | 3.0 | 2.0 | 1690 | $2,100 | $1.24 | 6d | 1 | 1.50mi |
HOA detail
- Monthly dues
- $80 · $960/yr
Listing history 2 events
-
2026-05-11$401,000 New 1678-char remark
-
2026-04-17$401,000 Active 238-char remark
Show marketing remark (238 chars)
The property is located at 20925 Gravel Keep SAN ANTONIO TX 78266 priced at 401000, the square foot and stories are 1595, 1.The number of bath is 2, halfbath is 0 there are 3 bedrooms and 2 garages. For more details please, call or email.
ⓘ Source: listings_history table (triggers on properties + properties_extension) + one-shot
backfill from property_details.listing_events for pre-trigger history.
Tax reassessment forecast TX · Resets to sale price
- Current annual tax
- $811 · $68/mo
- Projected year-2 tax
- $7,338 · $612/mo
- Expected delta
- +$6,527/yr (+$544/mo · 804.9%)
ⓘ Screening estimate from a state-policy table — verify with the county assessor before closing.
Nearby sold comps map
Loading sold comps map…
Walkable amenities ~0.75 mi
Loading nearby amenities…
Taxation est. · year 1
- Rental income
- $26,992
- − Mortgage interest
- −$22,462
- − Property taxes
- −$811
- − Insurance
- −$2,005
- − Repairs & maintenance
- −$2,159
- − Management
- −$2,159
- − HOA
- −$960
- − Depreciation
- −$11,665
- Taxable loss
- −$15,230
- Est. tax savings @ 24.0%
- +$3,655
- After-tax cash flow
- $-4,032/yr
For passive investors: Depreciation is non-cash, so a rental often shows a tax loss while cash-flowing — sheltering income. Rental losses are passive: they offset passive income freely, and up to $25,000/yr can offset ordinary (W-2) income if you actively participate and your MAGI is under $100k (phasing out to $0 by $150k); unused losses carry forward. On sale, claimed depreciation is recaptured at up to 25%, and gains may owe capital-gains tax (a 1031 exchange can defer both). Figures are a year-1 estimate at your 24.0% rate — not tax advice; consult a CPA.
Schools (NCES district)
- District
- North East ISD
- NCES district ID
- 4832940
- Math proficiency
- 38% ▼ -14.00%
- Reading proficiency
- 49% ▼ -4.00%
- Median HH income
- $57,715
- Composite
- 38.1/100
- National rank
- #4276
- State rank
- #276 of 826 in TX
Livability — San Antonio
- Score
- 80/100
- State rank
- #31
- US rank
- #1616
Category grades
Schools grade is shown separately in the Schools card above.
Census & demographics
- City population
- 1,806,925
- Population (ZIP)
- 7,274
Population outlook (Bexar County) Hauer SSP2
- Today (2025)
- 2,336,851 people
- By 2030
- 2,560,728 · +9.6%
- By 2040
- 3,020,569 · +29.3%
- By 2050
- 3,493,522 · +49.5%
- By 2075
- 4,668,459 · +99.8%
- By 2100
- 5,533,242 · +136.8%
Race, ethnicity, and origin ACS 2023
- Neighborhood character
- Diverse neighborhood (Simpson 0.65)
- Race & ethnicity
- White 44% Hispanic / Latino 36% Two or more races 25% Black 14%
- Hispanic origin (detail)
- Mexican 30%
- Common ancestry
- Romanian 3% Serbian 2% Lithuanian 1%
- Foreign-born
- 6% · Canada, South Korea
- Languages at home
- 85% English-only · Spanish 11% German/W. Germanic 2% Korean 1%
Political lean MEDSL · Bexar
- 2024 margin
- Lean D (+9.8) · D 54.3% · R 44.6% · Other 1.1%
- 2008→2024 swing
- +4.2pp toward D · 2008: 5.6pp · 2024: 9.8pp
- All cycles
- 2024: D+9.8 2020: D+18.2 2016: D+13.5 2012: D+4.6 2008: D+5.6
Not yet ingested
- Civics
- —
Market trends
- HPI YoY
- ▲ 13.56%
- Current HPI
- 361.01
- Rent YoY
- —
- Metro
- —
- State GDP YoY
- ▲ 3.95%
- F500 in state
- 110
Industry mix (Fortune 500 HQ in TX)
| Industry | F500 HQs | Revenue |
|---|---|---|
| Energy | 16 | $1,198B |
|
||
| Technology | 5 | $198B |
|
||
| Engineering / Construction | 4 | $72B |
|
||
| Energy Services | 3 | $60B |
|
||
| Utilities | 3 | $41B |
|
||
| Healthcare | 2 | $330B |
|
||
Price history
+0.0% since first listed5 events — show timeline
- 2026-05-26 Pending — LERA
- 2026-05-21 Relisted — Zillow
- 2026-05-20 Delisted — Zillow
- 2026-05-11 Listed $401,000 LERA
- 2026-04-17 Listed $401,000 Zillow
Property tax history
+1.9%/yrLatest (2025): $811 · +1.9% YoY. Source: county tax records.
Cash-flow waterfall
monthlySold comps — $/sqft
last 12 mo · ≤1 miLoading sold comps…