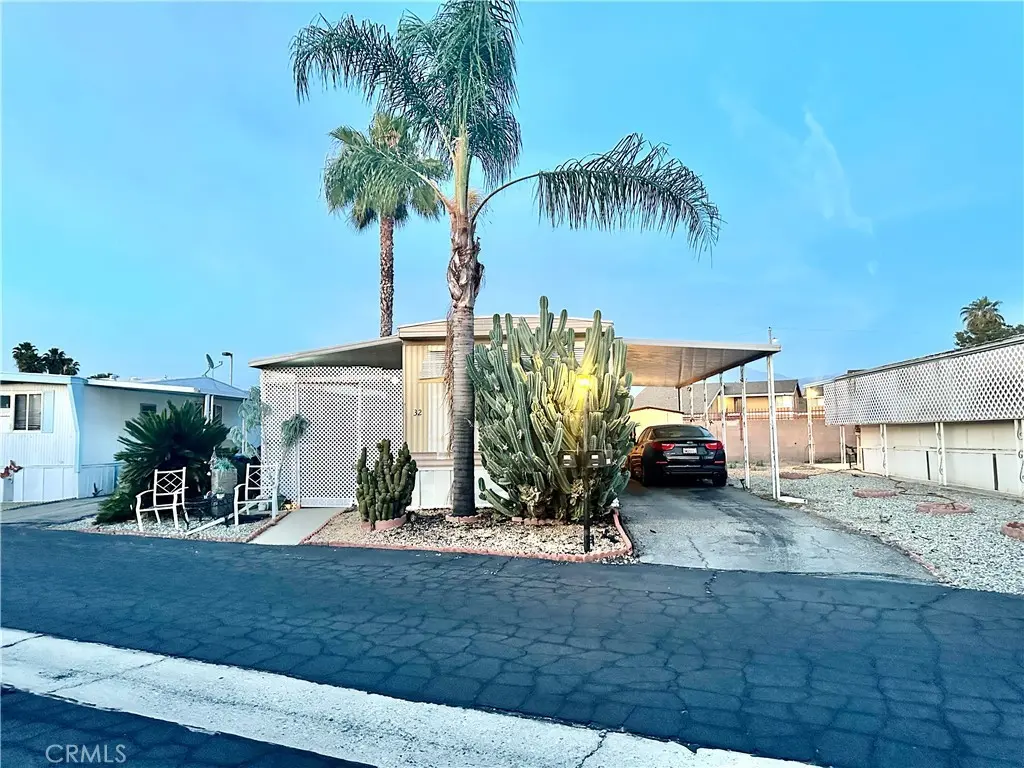
332 N LYON Ave #32 · Hemet, CA
Flood risk 1/10 · Minimal
- FEMA flood zone
- X (unshaded)
- Chance of flooding over 30 yrs
- 0.0%
- Est. flood insurance / yr
- $507 – $1,088
Fire risk 1/10 · Minimal
- Est. fire insurance / yr
- $659 – $1,223
Heat risk 7/10 · Major
- Hot days now (above 104°F)
- 6 days/yr
- Hot days in 30 yrs
- 16 days/yr
Wind risk 1/10 · Minimal
- Chance of severe wind over 30 yrs
- —
Air-quality risk 6/10 · Moderate
- Unhealthy air days now
- 12 days/yr
- Unhealthy air days in 30 yrs
- 14 days/yr
Risk factors via First Street. Map © Google.
Why this score? — see what drove the D grade
The composite is a weighted blend of 9 inputs, each scored 0–100. Each bar is that input's sub-score; the figure is the points it added to the 100-point composite (weight × sub-score).
- Cash flow +15.0/30.0
- ARV discount +7.5/15.0
- 1% rule +5.0/10.0
- DSCR +5.0/10.0
- Rent growth +2.9/5.0
- Livability +2.6/5.0
- Schools +2.5/10.0
- Condition / age +2.5/5.0
- Appreciation +0.0/10.0
$18,500
🖨 Deal sheet (PDF) 📄 Offer letter ✓ Due diligence
Listing remarks
Situated in a safe, peaceful, well-maintained senior gated community of EDEN ROC VILLAS, located in the heart of Hemet, walking distance to Commercial centers, where restaurants, shopping and Medical facilities are located. A 1/bedroom, 1/bath manufactured home, with spacious living, dining and kitchen area with open layout. It has AC unit plus centralized heater, a bathroom with tub and ample cabinetry and linen closet. Bedroom has wall-to-wall cabinetry and an evaporative cooler, an AC unit, lights with ceiling fans. It has a Patio from front entrance extending to the length of the property. It possesses a spacious lot around the property, can be developed into a beautiful garden, or a dr
Key facts
- 2 garage spots
- Community pool
- Built 1975
Property features AI
Finance
- Other: Assessments: buyer to verify; Exclusions: land
- Financial info: Monthly land lease of $850 (park-provided)
- HOA & community: Senior community; Park name: EDEN ROC VILLAS; Community features include biking and street lighting; Manager approval required; Pets allowed with breed restrictions
Exterior
- Parking: Attached garage; 2 garage spaces; 2 carport spaces (carport attached); Covered parking; Concrete driveway with direct garage access and front-entry garage; Private on-site parking (4 total spaces); Driveway level
- Security: Security lights; Gated community with automatic gate; Resident manager
- Utilities: Public/district water (water connected/available); Public sewer (sewer connected/available); Natural gas connected/available; Electricity connected/available; standard electric on property
- Home design: Mobile home (Skyline Hillcreed model); Single-story; Faces west; Patio home; Lot level/flat; irregular lot shape
- Construction: Aluminum and glass construction with drywall walls; Mobile width 12 ft and length 56 ft; Mobile home remains; One story; Repairs cosmetic
- Exterior features: Covered, screened and enclosed front and rear porch; stone patio; Awning; Rain gutters; Exterior lighting; TV antenna and satellite dish; Community heated tile pool; Storage building (shed); No landscaping; Back yard and yard; Park nearby; Walkstreet
Interior
- Kitchen: Gas cooktop; Built-in range; Electric oven; Double oven; Range/stove hood; Trash compactor; Corian counters; Pots & pan drawers; Water heater central (gas)
- Bedrooms: Main floor primary bedroom
- Flooring: Carpet
- Bathrooms: Full bath with soaking tub and shower-in-tub; Vanity area, linen closet/storage, exhaust fan, privacy toilet door, closet in bathroom
- Heating & cooling: Natural gas heating; Electric heating; Forced air / central furnace; Whole house fan; Wall/window cooling; Evaporative cooling
- Interior features: Ceiling fan; Open floor plan; Storage space; Formica counters; Double pane windows; Entry at 332 N Lyon Ave; One level
- Laundry & utility: Laundry located in carport
Neighborhood map
What this means for you Summary
Snapshot
- This is a 1-bed/1.0-bath manufactured listed at $18k.
Deal economics
- At list price, monthly cash flow is $1k ($14k/yr) — positive.
- The deal already cash-flows at list — no discount required.
- Meets the 1% rule at list price ($2k rent vs $18k).
- Recommended offer: $18k (3.0% below list) — sets the bar for market timing.
- Cap rate 82.7% vs local median 4.8% in Hemet — top-decile yield for the area; either an underpriced asset or a hidden risk that comps aren't pricing in. Stress-test before assuming the spread holds.
Location & tenants
- Location reads 51/100 on livability (#1,056 in CA) — a working-class tenant base; expect higher turnover. Strengths: housing A+; Watch: crime D+, amenities F, commute F.
- Hemet Unified (suburban): math 19% / reading 41% proficiency, ranked #360 of 517 in CA (top 70%) — families likely to look elsewhere, expect single-tenant / working-renter base with shorter leases; 66% free/reduced lunch — lower-income household profile, screen leases tightly.
- Zoned schools: Fruitvale Elementary (805 students, 88% FRL); Rancho Viejo Middle (math 24% / reading 24%, grade F, #277 of 498 statewide, top 73%, 975 students, 88% FRL); Hemet High (math 21% / reading 46%, grade F, #656 of 1,170 statewide, top 57%, 2,438 students, 82% FRL) — zoned schools average 86% FRL vs 66% district-wide (20 pts higher); higher-poverty schools than district average — tighter screening recommended.
- Market conditions: Rents rising (+1.8%/yr); 273 active listings in the ZIP; 40 comparable units currently listed for rent nearby; rentals at typical pace (median 26d on market — plan ~3-4 weeks tenant-placement turnaround); 9,195 units permitted in Riverside County in 2024 (1,512 in 5+ unit buildings).
- This rent runs 40% of the median local income ($49k/yr) — at the standard rent-burdened threshold; future hikes will face affordability resistance.
Forward outlook
- Local home prices are declining (-3.0%/yr); year-one equity from $128 of loan paydown is wiped out by about $555 of value loss. Plan a longer hold.
- Riverside County population projected at +22% by 2050 — long-run rental-demand tailwind backs the buy-and-hold thesis.
- At projected returns (-3.0% appreciation + 1.8% rent growth), your $5k cash investment doubles in ~1 year — after that, you're playing with house money.
Negotiation context
- It's been on market 45 days — a 3% lower offer ($18k) is reasonable based on typical stale-listing flexibility.
Risks & watch-outs
- Climate carrying-cost: extreme-heat days projected 6→16/yr by 2055 (HVAC capex compounding) — expect insurance premiums to compound above CPI over the hold.
Questions for the listing agent
- It's been on market 45 days. Have you received any prior offers? Is the seller open to a 3% concession, seller financing, or rate buy-down credit?
- Built in 1975 — when were the roof, HVAC, electrical panel, plumbing, and water heater last replaced?
- Is there a deadline driving the sale (1031 exchange, divorce, estate, relocation)? That informs how much negotiation room exists.
- Schools are F-rated, which usually means shorter tenancies and higher turnover. Who's the typical renter profile here, and what's been the actual vacancy rate?
- Crime grade is D in this area — have there been break-ins, vandalism, or insurance claims at this property in the last 3 years? What carrier currently insures it and at what premium?
- The area grade is low — what's the realistic commute time and amenity access for the typical tenant pool here? Any planned neighborhood developments (good or bad) we should know about?
- What's the average days-on-market for RENTAL listings here right now (not sales)? A rising rental-DOM trend means longer vacancies and softer asking-rent achievability than the comps imply.
- What's the recent tenant-quality profile in this submarket — average credit score on applications, eviction rate, late-payment / NSF rate, and stable-employment percentage? A property-management company in the area should have these aggregated.
- How much new for-sale + rental construction is in the pipeline within 1–3 miles? Heavy new supply typically softens prices + rents 12–24 months out; constrained supply supports both.
Investment metrics
- 1% rule
- 8.82% ✓
- Cap rate
- 82.71%
- Cash-on-cash
- 272.90%
- DSCR
- 13.14
- GRM
- 0.9
CMA / ARV
- ARV (median comp)
- $43,179
- List price
- $18,500
- Delta
- -57.15%
- Verdict
- UNDERPRICED
- Comps
- 20 within 1.0 mi
Show comp detail 12 sales within ~0.75 mi
| Address | Dist | Beds/Ba | Sqft | Sold | Price | $/sf | Match |
|---|---|---|---|---|---|---|---|
| 332 N Lyon Ave #25 | 0.00mi | 2/1.0 (+1) | 800 (0%) | 8mo | $30,000 | $38 | 88 |
| 332 N Lyon Ave #17 | 0.11mi | 2/1.0 (+1) | 800 (0%) | 8mo | $26,000 | $33 | 83 |
| 260 N Lyon Ave #120 | 0.13mi | 2/1.0 (+1) | 800 (0%) | 16mo | $44,000 | $55 | 76 |
| 260 N Lyon Ave #12 | 0.19mi | 2/1.0 (+1) | 800 (0%) | 14mo | $75,000 | $94 | 74 |
| 332 N Lyon Ave #16 | 0.36mi | 2/1.0 (+1) | 800 (0%) | 6mo | $31,000 | $39 | 73 |
| 1895 W Devonshire Ave #93 | 0.28mi | 2/1.0 (+1) | 800 (0%) | 13mo | $35,000 | $44 | 71 |
| 332 N Lyon Ave #145 | 0.00mi | 2/2.0 (+1) | 880 (+10%) | 7mo | $28,600 | $33 | 69 |
| 430 N Palm Ave #103 | 0.46mi | 2/1.0 (+1) | 832 (+4%) | 2mo | $47,000 | $56 | 65 |
| 260 N Lyon Ave #6 | 0.11mi | 2/1.0 (+1) | 900 (+12%) | 16mo | $39,000 | $43 | 56 |
| 530 W Devonshire Ave #37 | 0.57mi | 2/2.0 (+1) | 840 (+5%) | 1mo | $55,000 | $65 | 56 |
| 1895 W Devonshire Ave #135 | 0.39mi | 2/1.0 (+1) | 696 (-13%) | 6mo | $26,000 | $37 | 50 |
| 601 N Gilbert St | 0.69mi | 1/1.0 | 720 (-10%) | 8mo | $145,000 | $201 | 44 |
Match score weights: distance 35% · size 25% · config 20% · recency 20%. Top-matched comps best support the ARV.
Projected returns pro-forma
-3.0% appreciation · 1.76% rent growth · sell at horizon
- IRR
- —
- Equity multiple
- 14.52×
- Total profit
- $70,034
- Equity at exit
- $2,758
- IRR
- —
- Equity multiple
- 29.88×
- Total profit
- $149,605
- Equity at exit
- $1,600
Cash invested: $5,180 (down + closing). Projections, not guarantees.
Landlord ↔ Tenant lean methodology
- Overall (STATE)
- 18 Strongly Tenant-Friendly
- State California
- 18 Strongly Tenant-Friendly · D+13
- County
- — inherits STATE
- City
- — inherits STATE
ZIP-level market 92543
- Home prices YoY
- -26.7%
- Rents YoY
- 1.8%
- Active inventory
- 273
- Price-to-rent
- 0.9×
Monthly cashflow live
- Estimated rent
- $1,632 high interval (Pro) →
- Mortgage (P&I)
- −$97
- Tax from tax record
- −$6 /mo · $76/yr
- Insurance
- −$8
- HOA
- −$0
- Vacancy / Maint / Mgmt
- −$343
- Net cashflow
- $1,178
Break-even live
Sensitivity live
| Price | -10% $1,188 | -5% $1,183 | +0% $1,178 | +5% $1,173 | +10% $1,168 |
|---|---|---|---|---|---|
| Rent | -10% $1,049 | -5% $1,114 | +0% $1,178 | +5% $1,242 | +10% $1,307 |
| Rate | -1.0pp $1,187 | -0.5pp $1,183 | base $1,178 | +0.5pp $1,173 | +1.0pp $1,168 |
UW: 25.0% down · 7.5% · 30yr · 1.5% tax · 5.0% vac · 8.0% maint · 8.0% mgmt
Financing live
Cash to close
- Down payment
- $4,625
- Closing costs
- $555
- Reserves months
- —
- Total cash needed
- —
Loan-product check · same deal, 3 products live
Conventional
25% down · 7.5% · 30yr
- Down + closing
- —
- Monthly P&I
- —
- Monthly cashflow
- —
- DSCR
- —
- Eligible?
- —
Personal DTI + credit; lowest rate.
DSCR
20% down · 8.5% · 30yr
- Down + closing
- —
- Monthly P&I
- —
- Monthly cashflow
- —
- DSCR
- —
- Eligible?
- —
No personal income docs; deal must DSCR.
Hard money
10% down · 12.0% · 12mo
- Down + closing
- —
- Monthly P&I
- —
- Monthly cashflow
- —
- DSCR
- —
- Eligible?
- —
Short-term bridge; refi at stabilization.
Rent comps 40 comps
| Address | Beds | Baths | Sqft | Rent | $/sqft | DOM | Units | Dist |
|---|---|---|---|---|---|---|---|---|
| 1270 Rosalia Ave Unit 1 Hemet, CA | 2.0 | 1.0 | 900 | $1,800 | $2.00 | 45d | 1 | 0.17mi |
| 250 N Elk St Hemet, CA | 2.0 | 1.0 | 900 | $1,625 | $1.81 | 15d | 1 | 0.19mi |
| 446 N Elk St Unit D Hemet, CA | 2.0 | 1.0 | 980 | $1,675 | $1.71 | 26d | 1 | 0.20mi |
| 1887 Calle Amargosa Hemet, CA | 2.0 | 1.0 | 827 | $1,545 | $1.87 | 26d | 1 | 0.21mi |
| 201 N Valley View Dr Hemet, CA | 1.0 | 1.0 | 552 | $1,500 | $2.72 | 45d | 1 | 0.25mi |
| 1862 Pueblo Dr Hemet, CA | 2.0 | 2.0 | 977 | $1,900 | $1.94 | 45d | 1 | 0.28mi |
| 1862 Pueblo Dr Unit 1862 Hemet, CA | 2.0 | 2.0 | 977 | $1,750 | $1.79 | 26d | 1 | 0.28mi |
| 165 N Hamilton Ave Unit 4 Hemet, CA | 1.0 | 1.0 | 768 | $1,525 | $1.99 | 23d | 1 | 0.31mi |
| 165 N Hamilton Ave Unit 3 Hemet, CA | 1.0 | 1.0 | 768 | $1,450 | $1.89 | 7d | 1 | 0.31mi |
| 1964 W Oakland Ave Hemet, CA | 2.0 | 2.0 | 977 | $1,695 | $1.73 | 19d | 1 | 0.35mi |
| 2054 Avenida Olivos Hemet, CA | 2.0 | 1.0 | 820 | $1,500 | $1.83 | 45d | 1 | 0.36mi |
| 627 Solano Dr Hemet, CA | 2.0 | 2.0 | 882 | $1,800 | $2.04 | 20d | 1 | 0.36mi |
| 601 Corona St Hemet, CA | 2.0 | 2.0 | 882 | $1,700 | $1.93 | 0d | 1 | 0.37mi |
| 341 Calle Nogales Hemet, CA | 2.0 | 1.0 | 827 | $1,395 | $1.69 | 45d | 1 | 0.37mi |
| 2120 San Bernardo Ave Hemet, CA | 2.0 | 1.0 | 827 | $2,100 | $2.54 | 45d | 1 | 0.41mi |
| 1931 Nuevo St Hemet, CA | 2.0 | 1.0 | 820 | $1,600 | $1.95 | 45d | 1 | 0.46mi |
| 1933 Nuevo St Hemet, CA | 2.0 | 1.0 | 827 | $1,700 | $2.06 | 26d | 1 | 0.46mi |
| 2269 San Bernardo Ave Hemet, CA | 2.0 | 1.0 | 827 | $1,650 | $2.00 | 45d | 1 | 0.50mi |
| 528 San Marino St Hemet, CA | 2.0 | 1.0 | 827 | $1,900 | $2.30 | 45d | 1 | 0.50mi |
| 682 San Marino St Hemet, CA | 2.0 | 1.0 | 827 | $1,600 | $1.93 | 45d | 1 | 0.58mi |
| 2098 W Acacia Ave Hemet, CA | 1.0–3.0 | 1.0–2.0 | 895 | $1,595 | $1.78 | 0d | 1 | 0.65mi |
| 2488 San Padre Ct Hemet, CA | 2.0 | 1.0 | 827 | $1,599 | $1.93 | 1d | 1 | 0.69mi |
| 2488 San Padre Ct Hemet, CA | 2.0 | 1.0 | 827 | $1,599 | $1.93 | 15d | 1 | 0.69mi |
| 2422 San Padre Ct Hemet, CA | 2.0 | 1.0 | 827 | $1,800 | $2.18 | 26d | 1 | 0.72mi |
| 233 N Alessandro St Hemet, CA | 1.0 | 1.0 | 690 | $1,400 | $2.03 | 45d | 1 | 0.75mi |
| 2770 W Devonshire Ave Hemet, CA | 1.0–2.0 | 1.0–2.0 | 707 | $1,575 | $2.23 | 0d | 10 | 0.78mi |
| 471 Whitney Dr Hemet, CA | 2.0 | 2.0 | 1085 | $1,800 | $1.66 | 7d | 1 | 0.78mi |
| 2403 W Acacia Ave Hemet, CA | 2.0 | 2.0 | 910 | $1,995 | $2.19 | 9d | 1 | 0.81mi |
| 2469 W Acacia Ave Hemet, CA | 2.0 | 2.0 | 910 | $1,750 | $1.92 | 26d | 1 | 0.82mi |
| 1461 W Mayberry Ave Hemet, CA | 2.0 | 2.0 | 1044 | $1,750 | $1.68 | 45d | 1 | 0.83mi |
| 199 N Inez St Apt D Hemet, CA | 1.0 | 1.0 | 650 | $1,300 | $2.00 | 1d | 1 | 0.83mi |
| 199 N Inez St Apt D Hemet, CA | 1.0 | 1.0 | 650 | $1,300 | $2.00 | 9d | 1 | 0.83mi |
| 471 S Simpson Ave Unit D Hemet, CA | 2.0 | 2.0 | 900 | $1,750 | $1.94 | 45d | 1 | 0.89mi |
| 3030 W Acacia Ave Hemet, CA | 1.0–2.0 | 1.0–2.0 | 807 | $1,585 | $1.96 | 0d | 8 | 1.06mi |
| 426 N Buena Vista St Apt 1 Hemet, CA | 2.0 | 1.0 | 680 | $1,550 | $2.28 | 9d | 1 | 1.15mi |
| 426 N Buena Vista St Hemet, CA | 2.0 | 1.0 | 680 | $1,550 | $2.28 | 5d | 1 | 1.15mi |
| 560 E Oakland Ave Apt P Hemet, CA | 1.0 | 1.0 | 550 | $1,325 | $2.41 | 18d | 1 | 1.19mi |
| 526 Greystone Ln Hemet, CA | 2.0 | 1.0 | 700 | $1,600 | $2.29 | 19d | 1 | 1.20mi |
| 526 Greystone Ln Apt 3 Hemet, CA | 2.0 | 1.0 | 700 | $1,650 | $2.36 | 45d | 1 | 1.20mi |
| 526 Greystone Ln Hemet, CA | 2.0 | 1.0 | 700 | $1,600 | $2.29 | 45d | 1 | 1.20mi |
Listing history 15 events
-
2026-06-21days on market $18,500 Active 45 DOM
-
2026-06-18days on market $18,500 Active 42 DOM
-
2026-06-17days on market $18,500 Active 41 DOM
-
2026-06-16days on market $18,500 Active 40 DOM
-
2026-06-15days on market $18,500 Active 39 DOM
-
2026-06-13days on market $18,500 Active 37 DOM
-
2026-06-09days on market $18,500 Active 33 DOM
-
2026-06-08days on market $18,500 Active 32 DOM
-
2026-06-07days on market $18,500 Active 31 DOM
-
2026-06-04days on market $18,500 Active 28 DOM
-
2026-06-03days on market $18,500 Active 27 DOM
-
2026-06-02pricedays on market $18,500 Active 26 DOM
-
2026-06-01days on market $32,000 Active 25 DOM
-
2026-05-31days on market $32,000 Active 24 DOM
-
2026-05-07$32,000 Active 1226-char remark
ⓘ Source: listings_history table (triggers on properties + properties_extension) + one-shot
backfill from property_details.listing_events for pre-trigger history.
Tax reassessment forecast CA · Resets to sale price
- Current annual tax
- $76 · $6/mo
- Projected year-2 tax
- $141 · $12/mo
- Expected delta
- +$64/yr (+$5/mo · 84.5%)
ⓘ Screening estimate from a state-policy table — verify with the county assessor before closing.
Climate risk First Street
- Flood 1/10 Low FEMA zone X (unshaded) · 0% chance over 30 yrs
- Wildfire 1/10 Low
- Heat 7/10 Severe 6 d/yr ≥104°F today · 16 d/yr by 30 yrs out
- Wind 1/10 Low
- Air quality 6/10 Major 12 unhealthy d/yr today · 14 by 30 yrs out
Nearby sold comps map
Loading sold comps map…
Walkable amenities ~0.75 mi
Loading nearby amenities…
Taxation est. · year 1
- Rental income
- $19,581
- − Mortgage interest
- −$1,036
- − Property taxes
- −$76
- − Insurance
- −$92
- − Repairs & maintenance
- −$1,566
- − Management
- −$1,566
- − Depreciation
- −$538
- Taxable income
- $14,705
- Est. tax owed @ 24.0%
- −$3,529
- After-tax cash flow
- $10,607/yr
For passive investors: Depreciation is non-cash, so a rental often shows a tax loss while cash-flowing — sheltering income. Rental losses are passive: they offset passive income freely, and up to $25,000/yr can offset ordinary (W-2) income if you actively participate and your MAGI is under $100k (phasing out to $0 by $150k); unused losses carry forward. On sale, claimed depreciation is recaptured at up to 25%, and gains may owe capital-gains tax (a 1031 exchange can defer both). Figures are a year-1 estimate at your 24.0% rate — not tax advice; consult a CPA.
Schools (NCES district)
- District
- Hemet Unified
- NCES district ID
- 0616920
- Math proficiency
- 19% ▼ -3.00%
- Reading proficiency
- 41% ▲ 4.00%
- Median HH income
- $39,962
- Composite
- 25.16/100
- National rank
- #7517
- State rank
- #360 of 517 in CA
Livability — Hemet
- Score
- 51/100
- State rank
- #1056
- US rank
- #25208
Category grades
Schools grade is shown separately in the Schools card above.
Census & demographics
- Census place
- Hemet, CA
- County
- Riverside County · 2,287,001 people
- City population
- 137,670
- Metro
- Riverside-San Bernardino-Ontario, CA
- Population (ZIP)
- 39,937
- Household income
- $49,396
- Rent vs Own
- Severe rent burden
- 2144.0
Population outlook (Riverside County) Hauer SSP2
- Today (2025)
- 2,664,475 people
- By 2030
- 2,802,692 · +5.2%
- By 2040
- 3,050,904 · +14.5%
- By 2050
- 3,256,783 · +22.2%
- By 2075
- 3,655,058 · +37.2%
- By 2100
- 3,766,594 · +41.4%
Race, ethnicity, and origin ACS 2023
- Neighborhood character
- Diverse neighborhood (Simpson 0.61)
- Race & ethnicity
- Hispanic / Latino 54% White 30% Two or more races 18% Black 10% Native American 2% Asian 2%
- Hispanic origin (detail)
- Mexican 48% Puerto Rican 1%
- Common ancestry
- Slovak 1% Romanian 1% Portuguese 1%
- Foreign-born
- 21% · Canada
- Languages at home
- 59% English-only · Spanish 38% Arabic 1% Tagalog/Filipino 1%
Political lean MEDSL · Riverside
- 2024 margin
- Toss-up / Even · D 48.0% · R 49.3% · Other 2.6%
- 2008→2024 swing
- -3.6pp toward R · 2008: 2.3pp · 2024: -1.3pp
- All cycles
- 2024: R+1.3 2020: D+8.0 2016: D+4.3 2012: R+0.4 2008: D+2.3
Not yet ingested
- Civics
- —
Market trends
- HPI YoY
- ▼ -147.46%
- Current HPI
- 405.1277
- Rent YoY
- ▲ 1.76%
- Metro
- Riverside-San Bernardino-Ontario, CA
- State GDP YoY
- ▲ 3.21%
- F500 in state
- 116
Industry mix (Fortune 500 HQ in CA)
| Industry | F500 HQs | Revenue |
|---|---|---|
| Technology | 27 | $1,492B |
|
||
| Financial Services | 3 | $174B |
|
||
| Retail | 3 | $44B |
|
||
| Insurance | 3 | $26B |
|
||
| Media / Entertainment | 2 | $115B |
|
||
| Pharmaceuticals / Biotech | 2 | $62B |
|
||
Price history
-42.2% since first listed2 events — show timeline
- 2026-06-02 Price Changed $18,500 CRMLS
- 2026-05-07 Listed $32,000 CRMLS
Property tax history
+1.7%/yrLatest (2025): $76 · +2.0% YoY. Source: county tax records.
Cash-flow waterfall
monthlySold comps — $/sqft
last 12 mo · ≤1 miLoading sold comps…