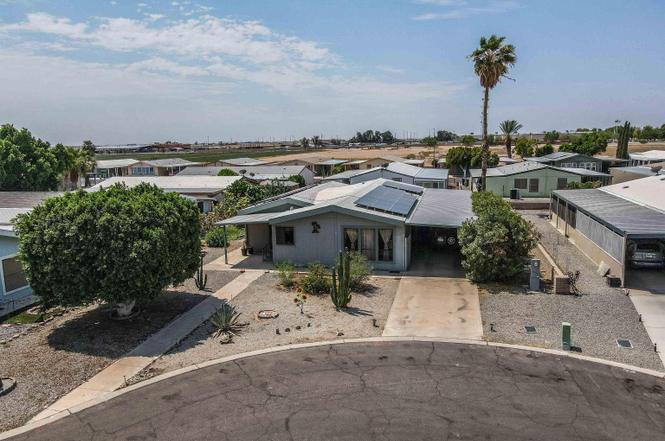
917 W Havasu Cir · Yuma, AZ
Flood risk 1/10 · Minimal
- FEMA flood zone
- X (shaded)
- Chance of flooding over 30 yrs
- 0.0%
- Est. flood insurance / yr
- $507 – $1,088
Fire risk 4/10 · Minor
- Est. fire insurance / yr
- $610 – $1,132
Heat risk 9/10 · Severe
- Hot days now (above 113°F)
- 7 days/yr
- Hot days in 30 yrs
- 19 days/yr
Wind risk 1/10 · Minimal
- Chance of severe wind over 30 yrs
- —
Air-quality risk 2/10 · Minimal
- Unhealthy air days now
- 2 days/yr
- Unhealthy air days in 30 yrs
- 2 days/yr
Risk factors via First Street. Map © Google.
Why this score? — see what drove the C+ grade
The composite is a weighted blend of 9 inputs, each scored 0–100. Each bar is that input's sub-score; the figure is the points it added to the 100-point composite (weight × sub-score).
- Cash flow +28.1/30.0
- DSCR +10.0/10.0
- 1% rule +6.7/10.0
- ARV discount +6.0/15.0
- Livability +3.6/5.0
- Condition / age +2.5/5.0
- Rent growth +2.4/5.0
- Schools +1.3/10.0
- Appreciation +0.0/10.0
$179,800
🖨 Deal sheet 📄 Offer letter ✓ Due diligence
Listing remarks MLS
GREAT PROPERTY IN AN EXCELLENT 55+ NEIGHBORHOOD. WELCOME TO YUMA'S DESERT LAKES. THIS GORGEOUS HOME FEATURES VAULTED CEILINGS, NEW CARPET, A BONUS ROOM WHICH COULD EASILY BE A THIRD BEDROOM, PLENTY OF COVERED PARKING AND SHADE. LET'S NOT FORGET THE COMMUNITY POOL AND CLUBHOUSE!
Key facts
- Walking distance
- Double lot
- Room for gardening
Tags
Property features AI
Finance
- HOA & community: Senior community
Exterior
- Parking: 2 total parking spaces; 2 covered spaces; Attached carport
- Security: Smoke detector(s)
- Utilities: Public water; Public sewer
- Home design: Single-story manufactured home; Located in the Desert Lakes subdivision; Paved road access; Senior community
- Construction: Manufactured home construction
- Exterior features: Covered patio; Shed(s); Curbs
Interior
- Kitchen: Disposal; Refrigerator; Microwave; Dishwasher; Cooktop; Oven
- Bedrooms: Manufactured home bedrooms (details on room levels not provided)
- Flooring: Tile flooring; Carpet
- Bathrooms: 1 full bathroom; 1 three-quarter bathroom
- Heating & cooling: Heating; Cooling
- Interior features: Double-pane windows with blinds and drapes; Smoke detectors
- Laundry & utility: Washer and dryer included
Neighborhood map
What this means for you Summary
Snapshot
- This is a 3-bed/2.0-bath manufactured listed at $180k.
Deal economics
- At list price, monthly cash flow is $568 ($7k/yr) — positive.
- The deal already cash-flows at list — no discount required.
- Meets the 1% rule at list price ($2k rent vs $180k).
- Recommended offer: $158k (12.0% below list) — sets the bar for market timing.
- Cap rate 10.1% vs local median 3.9% in Yuma — top-decile yield for the area; either an underpriced asset or a hidden risk that comps aren't pricing in. Stress-test before assuming the spread holds.
Location & tenants
- Location reads 71/100 on livability (#30 in AZ) — a middle-class / working-renter tenant base. Strengths: cost of living A+, housing A+, health & safety A+; Watch: schools C-, crime C-, employment D.
- Yuma Union High School District (4507) (urban): math 14% / reading 16% proficiency, ranked #212 of 249 in AZ (top 85%) — low school quality limits family demand, transient renter base, plan for 1-2y turnover.
- Market conditions: Rents soft (-0.4%/yr); 472 active listings in the ZIP; 6 comparable units currently listed for rent nearby; rentals leasing fast (median 13d on market — plan ~1-2 weeks tenant-placement turnaround); 1,399 units permitted in Yuma County in 2024 (180 in 5+ unit buildings).
- This rent runs 36% of the median local income ($70k/yr) — at the standard rent-burdened threshold; future hikes will face affordability resistance.
Forward outlook
- Local home prices are declining (-3.0%/yr); year-one equity from $1k of loan paydown is wiped out by about $5k of value loss. Plan a longer hold.
- Yuma County population projected at +4% by 2050 — modest demand growth; plan on rents tracking national, not racing it.
Negotiation context
- It's been on market 319 days — a 12% lower offer ($158k) is reasonable based on typical stale-listing flexibility.
- 5 sale attempts since 4y ago; this cycle's ask has dropped $15k (8%) from the opening price — seller is motivated, your offer sets the floor, not the list.
- Current owner paid $155k; 16% above their basis — modest negotiation headroom, anchor on the comps not their cost.
Risks & watch-outs
- Climate carrying-cost: extreme-heat days projected 7→19/yr by 2055 (HVAC capex compounding) — expect insurance premiums to compound above CPI over the hold.
Questions for the listing agent
- It's been on market 319 days. Have you received any prior offers? Is the seller open to a 12% concession, seller financing, or rate buy-down credit?
- Why hasn't it sold? Are there any deal-killer items the seller is aware of (foundation, flood, title, zoning, code violations)?
- Is there a deadline driving the sale (1031 exchange, divorce, estate, relocation)? That informs how much negotiation room exists.
- What's the average days-on-market for RENTAL listings here right now (not sales)? A rising rental-DOM trend means longer vacancies and softer asking-rent achievability than the comps imply.
- What's the recent tenant-quality profile in this submarket — average credit score on applications, eviction rate, late-payment / NSF rate, and stable-employment percentage? A property-management company in the area should have these aggregated.
- How much new for-sale + rental construction is in the pipeline within 1–3 miles? Heavy new supply typically softens prices + rents 12–24 months out; constrained supply supports both.
Investment metrics
- 1% rule
- 1.17% ✓
- Cap rate
- 10.08%
- Cash-on-cash
- 13.53%
- DSCR
- 1.60
- GRM
- 7.1
CMA / ARV
- ARV (on-the-fly)
- $173,821
- Comps found
- 11
Show comp detail 11 sales within ~0.75 mi
| Address | Dist | Beds/Ba | Sqft | Sold | Price | $/sf | Match |
|---|---|---|---|---|---|---|---|
| 3671 S 9 Ave | 0.22mi | 3/2.0 | 1,666 (-3%) | 2mo | $219,000 | $131 | 83 |
| 3717 S 8 Ave | 0.16mi | 3/2.0 | 1,780 (+3%) | 6mo | $243,900 | $137 | 82 |
| 914 W Lakeside Cir | 0.12mi | 3/2.0 | 1,638 (-5%) | 20mo | $207,500 | $127 | 69 |
| 3689 S Pitahaya Dr | 0.41mi | 2/2.0 (-1) | 1,608 (-7%) | 1mo | $107,000 | $67 | 64 |
| 3733 S Parkview Cir | 0.11mi | 2/2.0 (-1) | 1,534 (-11%) | 18mo | $179,000 | $117 | 57 |
| 689 W Ocotillo Ln | 0.27mi | 2/2.0 (-1) | 1,464 (-15%) | 5mo | $138,000 | $94 | 54 |
| 3619 S Pitahaya Dr | 0.44mi | 3/2.0 | 1,536 (-11%) | 13mo | $155,000 | $101 | 51 |
| 3692 S Senita Dr | 0.36mi | 2/2.5 (-1) | 1,464 (-15%) | 1mo | $110,000 | $75 | 50 |
| 585 W Ocotillo Ln | 0.32mi | 2/2.0 (-1) | 1,464 (-15%) | 13mo | $138,500 | $95 | 45 |
| 3611 S Cereus Dr | 0.36mi | 2/2.0 (-1) | 1,488 (-14%) | 18mo | $208,000 | $140 | 41 |
| 3480 S Hermosa Rd | 0.63mi | 2/2.0 (-1) | 1,512 (-12%) | 14mo | $145,000 | $96 | 33 |
Match score weights: distance 35% · size 25% · config 20% · recency 20%. Top-matched comps best support the ARV.
Projected returns pro-forma
-3.0% appreciation · 0.0% rent growth · sell at horizon
- IRR
- 0.4%
- Equity multiple
- 1.02×
- Total profit
- $790
- Equity at exit
- $26,809
- IRR
- 7.0%
- Equity multiple
- 1.46×
- Total profit
- $23,161
- Equity at exit
- $15,546
Cash invested: $50,344 (down + closing). Projections, not guarantees.
Landlord ↔ Tenant lean methodology
- Overall (STATE)
- 87 Strongly Landlord-Friendly
- State Arizona
- 87 Strongly Landlord-Friendly · R+3
- County
- — inherits STATE
- City
- — inherits STATE
ZIP-level market 85365
- Home prices YoY
- -23.6%
- Rents YoY
- -0.4%
- Active inventory
- 472
- Price-to-rent
- 7.1×
Monthly cashflow live
- Estimated rent
- $2,105 high interval (Pro) →
- Mortgage (P&I)
- −$943
- Tax from tax record
- −$78 /mo · $931/yr
- Insurance
- −$75
- HOA
- −$0
- Vacancy / Maint / Mgmt
- −$442
- Net cashflow
- $568
Break-even live
UW: 25.0% down · 7.5% · 30yr · 1.5% tax · 5.0% vac · 8.0% maint · 8.0% mgmt
Financing live
Cash to close
- Down payment
- $44,950
- Closing costs
- $5,394
- Reserves months
- —
- Total cash needed
- —
Loan-product check · same deal, 3 products live
Conventional
25% down · 7.5% · 30yr
- Down + closing
- —
- Monthly P&I
- —
- Monthly cashflow
- —
- DSCR
- —
- Eligible?
- —
Personal DTI + credit; lowest rate.
DSCR
20% down · 8.5% · 30yr
- Down + closing
- —
- Monthly P&I
- —
- Monthly cashflow
- —
- DSCR
- —
- Eligible?
- —
No personal income docs; deal must DSCR.
Hard money
10% down · 12.0% · 12mo
- Down + closing
- —
- Monthly P&I
- —
- Monthly cashflow
- —
- DSCR
- —
- Eligible?
- —
Short-term bridge; refi at stabilization.
Rent comps 6 comps
| Address | Beds | Baths | Sqft | Rent | $/sqft | DOM | Units | Dist |
|---|---|---|---|---|---|---|---|---|
| 3539 S Cholla Dr Yuma, AZ | 3.0 | 2.0 | 1973 | $2,150 | $1.09 | 13d | 1 | 0.38mi |
| 3533 S Cholla Dr Yuma, AZ | 2.0 | 2.0 | 1814 | $2,495 | $1.38 | 21d | 1 | 0.39mi |
| 1169 W 34th St Yuma, AZ | 3.0 | 1.5 | 1430 | $1,750 | $1.22 | 13d | 1 | 0.48mi |
| 1900 W 30th St Yuma, AZ | 2.0–3.0 | 2.0 | 1024 | $1,136 | $1.11 | 13d | 1 | 1.29mi |
| 1778 W 28th St Yuma, AZ | 3.0 | 2.0 | 1200 | $3,300 | $2.75 | 13d | 1 | 1.40mi |
| 143 W 27th Pl Yuma, AZ | 3.0 | 2.0 | 1277 | $1,500 | $1.17 | 21d | 1 | 1.48mi |
Listing history 45 events
-
2026-06-19days on market $179,800 Active 319 DOM
-
2026-06-18days on market $179,800 Active 318 DOM
-
2026-06-17days on market $179,800 Active 317 DOM
-
2026-06-16days on market $179,800 Active 316 DOM
-
2026-06-15days on market $179,800 Active 315 DOM
-
2026-06-14days on market $179,800 Active 313 DOM
-
2026-06-13days on market $179,800 Active 312 DOM
-
2026-06-10days on market $179,800 Active 310 DOM
-
2026-06-09days on market $179,800 Active 309 DOM
-
2026-06-08days on market $179,800 Active 308 DOM
-
2026-06-07days on market $179,800 Active 307 DOM
-
2026-06-05days on market $179,800 Active 304 DOM
-
2026-06-02days on market $179,800 Active 302 DOM
-
2026-06-01pricedays on market $179,800 Active 301 DOM
-
2026-05-31days on market $179,900 Active 300 DOM
-
2026-05-30days on market $179,900 Active 299 DOM
-
2026-01-02status Active
-
2025-12-23status Pending
-
2025-11-22price $179,900
-
2025-08-23price $185,000
-
2025-07-24$195,000 Active
-
2023-01-31soldstatus $155,000 Closed 278-char remark
Show marketing remark (278 chars)
GREAT PROPERTY IN AN EXCELLENT 55+ NEIGHBORHOOD. WELCOME TO YUMA'S DESERT LAKES. THIS GORGEOUS HOME FEATURES VAULTED CEILINGS, NEW CARPET, A BONUS ROOM WHICH COULD EASILY BE A THIRD BEDROOM, PLENTY OF COVERED PARKING AND SHADE. LET'S NOT FORGET THE COMMUNITY POOL AND CLUBHOUSE!
-
2023-01-31soldstatus $155,000
Show marketing remark (278 chars)
GREAT PROPERTY IN AN EXCELLENT 55+ NEIGHBORHOOD. WELCOME TO YUMA'S DESERT LAKES. THIS GORGEOUS HOME FEATURES VAULTED CEILINGS, NEW CARPET, A BONUS ROOM WHICH COULD EASILY BE A THIRD BEDROOM, PLENTY OF COVERED PARKING AND SHADE. LET'S NOT FORGET THE COMMUNITY POOL AND CLUBHOUSE!
-
2023-01-16status Pending 278-char remark
Show marketing remark (278 chars)
GREAT PROPERTY IN AN EXCELLENT 55+ NEIGHBORHOOD. WELCOME TO YUMA'S DESERT LAKES. THIS GORGEOUS HOME FEATURES VAULTED CEILINGS, NEW CARPET, A BONUS ROOM WHICH COULD EASILY BE A THIRD BEDROOM, PLENTY OF COVERED PARKING AND SHADE. LET'S NOT FORGET THE COMMUNITY POOL AND CLUBHOUSE!
-
2023-01-04$149,950 Active 278-char remark
Show marketing remark (278 chars)
GREAT PROPERTY IN AN EXCELLENT 55+ NEIGHBORHOOD. WELCOME TO YUMA'S DESERT LAKES. THIS GORGEOUS HOME FEATURES VAULTED CEILINGS, NEW CARPET, A BONUS ROOM WHICH COULD EASILY BE A THIRD BEDROOM, PLENTY OF COVERED PARKING AND SHADE. LET'S NOT FORGET THE COMMUNITY POOL AND CLUBHOUSE!
-
2022-12-30price $165,000
-
2022-12-19price $157,500
-
2022-12-12price $159,500
-
2022-12-07price $159,900
-
2022-11-29$159,999 Active
-
2022-11-21price $159,900
-
2022-11-17price $169,500
-
2022-11-10price $169,750
-
2022-11-07price $169,900
-
2022-11-03price $179,500
-
2022-11-01price $179,900
-
2022-10-28price $179,950
-
2022-10-25price $184,500
-
2022-10-18$185,000 Active
-
2005-07-12soldstatus $125,000
-
2004-02-20soldstatus $99,000
-
2000-12-21soldstatus $101,000
-
1999-10-27soldstatus $95,000
-
1989-11-07soldstatus $65,000
-
1989-10-01soldstatus $65,000
ⓘ Source: listings_history table (triggers on properties + properties_extension) + one-shot
backfill from property_details.listing_events for pre-trigger history.
Tax reassessment forecast AZ · Resets to sale price
- Current annual tax
- $931 · $78/mo
- Projected year-2 tax
- $1,187 · $99/mo
- Expected delta
- +$256/yr (+$21/mo · 27.5%)
ⓘ Screening estimate from a state-policy table — verify with the county assessor before closing.
Climate risk First Street
- Flood 1/10 Low FEMA zone X (shaded) · 0% chance over 30 yrs
- Wildfire 4/10 Moderate
- Heat 9/10 Extreme 7 d/yr ≥113°F today · 19 d/yr by 30 yrs out
- Wind 1/10 Low
- Air quality 2/10 Low 2 unhealthy d/yr today · 2 by 30 yrs out
Nearby sold comps map
Loading sold comps map…
Walkable amenities ~0.75 mi
Loading nearby amenities…
Taxation est. · year 1
- Rental income
- $25,261
- − Mortgage interest
- −$10,072
- − Property taxes
- −$931
- − Insurance
- −$899
- − Repairs & maintenance
- −$2,021
- − Management
- −$2,021
- − Depreciation
- −$5,231
- Taxable income
- $4,087
- Est. tax owed @ 24.0%
- −$981
- After-tax cash flow
- $5,831/yr
For passive investors: Depreciation is non-cash, so a rental often shows a tax loss while cash-flowing — sheltering income. Rental losses are passive: they offset passive income freely, and up to $25,000/yr can offset ordinary (W-2) income if you actively participate and your MAGI is under $100k (phasing out to $0 by $150k); unused losses carry forward. On sale, claimed depreciation is recaptured at up to 25%, and gains may owe capital-gains tax (a 1031 exchange can defer both). Figures are a year-1 estimate at your 24.0% rate — not tax advice; consult a CPA.
Schools (NCES district)
- District
- Yuma Union High School District (4507)
- NCES district ID
- 0409630
- Math proficiency
- 14% ▼ -12.00%
- Reading proficiency
- 16% ▼ -10.00%
- Median HH income
- $40,512
- Composite
- 12.86/100
- National rank
- #9592
- State rank
- #212 of 249 in AZ
Livability — Yuma
- Score
- 71/100
- State rank
- #30
- US rank
- #6635
Category grades
Schools grade is shown separately in the Schools card above.
Census & demographics
- Census place
- Yuma, AZ
- County
- Yuma County · 149,809 people
- City population
- 149,809
- Metro
- Yuma, AZ
- Population (ZIP)
- 54,775
- Household income
- $70,331
- Rent vs Own
- Severe rent burden
- 766.0
Population outlook (Yuma County) Hauer SSP2
- Today (2025)
- 211,633 people
- By 2030
- 214,114 · +1.2%
- By 2040
- 217,856 · +2.9%
- By 2050
- 220,276 · +4.1%
- By 2075
- 222,359 · +5.1%
- By 2100
- 198,880 · -6.0%
Race, ethnicity, and origin ACS 2023
- Neighborhood character
- Diverse neighborhood (Simpson 0.58)
- Race & ethnicity
- Hispanic / Latino 47% White 44% Two or more races 23% Black 2% Asian 1% Native American 1%
- Hispanic origin (detail)
- Mexican 43%
- Common ancestry
- Lithuanian 2% Italian 1% Romanian 1%
- Foreign-born
- 17% · Canada
- Languages at home
- 62% English-only · Spanish 36% Tagalog/Filipino 1% Other Asian/Pacific 1%
Political lean MEDSL · Yuma
- 2024 margin
- Strong R (+20.4) · D 39.3% · R 59.8%
- 2008→2024 swing
- -6.6pp toward R · 2008: -13.8pp · 2024: -20.4pp
- All cycles
- 2024: R+20.4 2020: R+6.2 2016: R+5.5 2012: R+16.1 2008: R+13.8
Not yet ingested
- Civics
- —
Market trends
- HPI YoY
- ▼ -75.03%
- Current HPI
- 242.8651
- Rent YoY
- ▼ -0.38%
- Metro
- Yuma, AZ
- State GDP YoY
- ▲ 4.54%
- F500 in state
- 20
Industry mix (Fortune 500 HQ in AZ)
| Industry | F500 HQs | Revenue |
|---|---|---|
| Technology | 2 | $13B |
|
||
| Mining / Metals | 1 | $23B |
|
||
| Environmental Services | 1 | $16B |
|
||
| Metals / Steel | 1 | $14B |
|
||
| Technology Distribution | 1 | $9B |
|
||
| Homebuilding | 1 | $8B |
|
||
Price history
+176.8% since first listed29 events — show timeline
- 2026-01-02 Relisted — YAR
- 2025-12-23 Pending — YAR
- 2025-11-22 Price Changed $179,900 YAR
- 2025-08-23 Price Changed $185,000 YAR
- 2025-07-24 Listed $195,000 YAR
- 2023-01-31 Sold (Public Records) $155,000 Public Records
- 2023-01-31 Sold (MLS) $155,000 YAR
- 2023-01-16 Pending — YAR
- 2023-01-04 Listed $149,950 YAR
- 2022-12-30 Price Changed $165,000 YAR
- 2022-12-19 Price Changed $157,500 YAR
- 2022-12-12 Price Changed $159,500 YAR
- 2022-12-07 Price Changed $159,900 YAR
- 2022-11-29 Listed $159,999 YAR
- 2022-11-21 Price Changed $159,900 YAR
- 2022-11-17 Price Changed $169,500 YAR
- 2022-11-10 Price Changed $169,750 YAR
- 2022-11-07 Price Changed $169,900 YAR
- 2022-11-03 Price Changed $179,500 YAR
- 2022-11-01 Price Changed $179,900 YAR
- 2022-10-28 Price Changed $179,950 YAR
- 2022-10-25 Price Changed $184,500 YAR
- 2022-10-18 Listed $185,000 YAR
- 2005-07-12 Sold (Public Records) $125,000 Public Records
- 2004-02-20 Sold (Public Records) $99,000 Public Records
- 2000-12-21 Sold (Public Records) $101,000 Public Records
- 1999-10-27 Sold (Public Records) $95,000 Public Records
- 1989-11-07 Sold (Public Records) $65,000 Public Records
- 1989-10-01 Sold (Public Records) $65,000 Public Records
Property tax history
+3.4%/yrLatest (2025): $931 · +3.6% YoY. Source: county tax records.
Cash-flow waterfall
monthlySold comps — $/sqft
last 12 mo · ≤1 miLoading sold comps…