 6-Plex
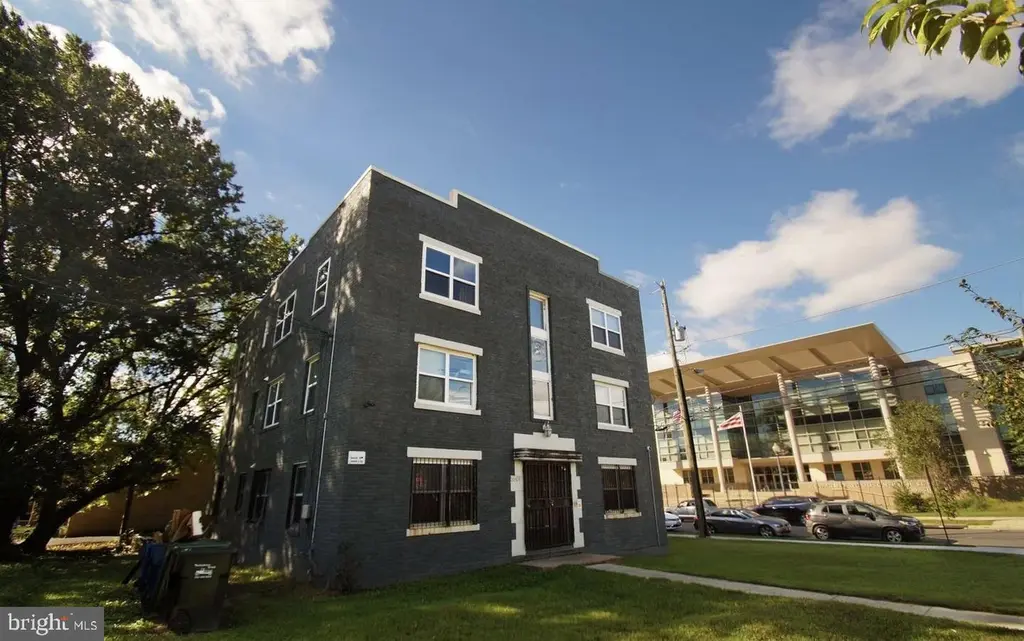
5501 Foote St NE · Washington, DC
Flood risk No data
- FEMA flood zone
- —
- Chance of flooding over 30 yrs
- —
- Est. flood insurance / yr
- —
Fire risk No data
- Est. fire insurance / yr
- —
Heat risk No data
- Hot days now (above threshold)
- —
- Hot days in 30 yrs
- —
Wind risk No data
- Chance of severe wind over 30 yrs
- —
Air-quality risk No data
- Unhealthy air days now
- —
- Unhealthy air days in 30 yrs
- —
Risk factors via First Street. Map © Google.
Why this score? — see what drove the B grade
The composite is a weighted blend of 9 inputs, each scored 0–100. Each bar is that input's sub-score; the figure is the points it added to the 100-point composite (weight × sub-score).
- Cash flow +30.0/30.0
- 1% rule +10.0/10.0
- DSCR +10.0/10.0
- ARV discount +7.5/15.0
- Rent growth +4.0/5.0
- Livability +3.7/5.0
- Schools +3.6/10.0
- Condition / age +2.5/5.0
- Appreciation +0.0/10.0
$1,150,000
🖨 Deal sheet 📄 Offer letter ✓ Due diligence
Multi-family units
County records classify this as Multi-Family (5+ Unit). Listing-text estimate: 6 units. confirmed
5+ unit building — per-unit beds/baths from public records are typically unavailable; the breakdown below (if shown) is an estimate from the listing text.
Listing remarks MLS
This property is a 6-unit multifamily asset, not 4 as listed.
Key facts
- Multi-family asset
- Deanwood corridor
- Market-rate units
Tags
Property features AI
Finance
- Other: Fee simple ownership
- Financial info: Net operating income approximately $65,100; Total actual rent approximately $82,800; Income includes apartment rentals; Operating expenses include trash; Existing long-term leases; No rent control
Exterior
- Parking: On-street parking
- Utilities: Public water; Public sewer
- Home design: Detached structure; Above-grade finished area (estimated 3,540)
- Construction: Masonry construction; Brick/mortar foundation; Other above-grade structures
- Exterior features: Annually paid ground rent; No tidal water
Interior
- Bedrooms: Six two-bedroom units (multi-unit property)
- Heating & cooling: Central heating (electric); Central air conditioning (electric)
- Interior features: Estimated living area
- Laundry & utility: Multi-tank hot water
Neighborhood map
What this means for you Summary
Snapshot
- This is a 6 × 8-bed/4.0-bath units multifamily listed at $1.15M.
Deal economics
- At list price, monthly cash flow is $8k ($97k/yr) — positive. Per door: $1k/mo.
- The deal already cash-flows at list — no discount required.
- Meets the 1% rule at list price ($19k rent vs $1.15M).
- Recommended offer: $1.12M (3.0% below list) — sets the bar for market timing.
- Cap rate 14.7% vs local median 2.5% in Washington — top-decile yield for the area; either an underpriced asset or a hidden risk that comps aren't pricing in. Stress-test before assuming the spread holds.
Location & tenants
- Location reads 73/100 on livability (#1 in DC) — a middle-class / working-renter tenant base. Strengths: amenities A+, commute A+, employment A+; Watch: crime F, cost of living F.
- District Of Columbia Public Schools (urban): math 33% / reading 40% proficiency, ranked #8 of 32 in DC (top 25%) — families likely to look elsewhere, expect single-tenant / working-renter base with shorter leases; 65% free/reduced lunch — lower-income household profile, screen leases tightly.
- Zoned schools: H.D. Woodson Hs (543 students, 0% FRL) — zoned schools average 0% FRL vs 65% district-wide (65 pts lower); this property's tenant base skews higher-income than the district average.
- Market conditions: Rents rising fast (+6.1%/yr); 276 active listings in the ZIP; 1,737 units permitted in District of Columbia in 2024 (1,506 in 5+ unit buildings).
- At $18,847/mo this rent would consume 388% of the median local household income ($58k/yr) (locally 5115% of renters already pay >50% of income on rent) — very limited rent-growth headroom before tenants either downsize or default.
Forward outlook
- Local home prices are declining (-3.0%/yr); year-one equity from $8k of loan paydown is wiped out by about $34k of value loss. Plan a longer hold.
- District of Columbia County population projected at +50% by 2050 — long-run rental-demand tailwind backs the buy-and-hold thesis.
- At projected returns (-3.0% appreciation + 6.1% rent growth), your $322k cash investment doubles in ~4 years — after that, you're playing with house money.
Negotiation context
- It's been on market 45 days — a 3% lower offer ($1.12M) is reasonable based on typical stale-listing flexibility.
- 7 sale attempts since 30y ago with the ask held roughly flat each time — persistent listings suggest the price (not the market) is what's stuck; bring a comps-based counter.
- Current owner paid $950k; 21% above their basis — modest negotiation headroom, anchor on the comps not their cost.
Questions for the listing agent
- It's been on market 45 days. Have you received any prior offers? Is the seller open to a 3% concession, seller financing, or rate buy-down credit?
- Can we see the unit-by-unit rent roll, current vacancy, and any below-market leases? What's the average tenancy length?
- What capital expenditures (roof, boiler, parking lot, exteriors) have been made in the last 5 years, and what's planned in the next 2?
- Built in 1960 — when were the roof, HVAC, electrical panel, plumbing, and water heater last replaced?
- Is there a deadline driving the sale (1031 exchange, divorce, estate, relocation)? That informs how much negotiation room exists.
- Crime grade is F in this area — have there been break-ins, vandalism, or insurance claims at this property in the last 3 years? What carrier currently insures it and at what premium?
- What's the average days-on-market for RENTAL listings here right now (not sales)? A rising rental-DOM trend means longer vacancies and softer asking-rent achievability than the comps imply.
- What's the recent tenant-quality profile in this submarket — average credit score on applications, eviction rate, late-payment / NSF rate, and stable-employment percentage? A property-management company in the area should have these aggregated.
- How much new apartment / multifamily construction is in the pipeline within 1–3 miles? Heavy new supply (>2% of stock underway) typically softens rents 12–24 months out; light construction supports rent growth.
Investment metrics
- 1% rule
- 1.64% ✓
- Cap rate
- 14.72%
- Cash-on-cash
- 30.09%
- DSCR
- 2.34
- GRM
- 5.1
CMA / ARV
No comps found within radius.
Projected returns pro-forma
-3.0% appreciation · 6.06% rent growth · sell at horizon
- IRR
- 27.9%
- Equity multiple
- 2.20×
- Total profit
- $387,301
- Equity at exit
- $171,469
- IRR
- 37.0%
- Equity multiple
- 4.91×
- Total profit
- $1,259,104
- Equity at exit
- $99,431
Cash invested: $322,000 (down + closing). Projections, not guarantees.
Landlord ↔ Tenant lean methodology
- Overall (CITY)
- 0 Strongly Tenant-Friendly
- State District of Columbia
- 12 Strongly Tenant-Friendly · D+43
- County
- — inherits STATE
- City Washington
- 0 Strongly Tenant-Friendly · D+43
ZIP-level market 20019
- Rents YoY
- 6.1%
- Active inventory
- 276
- Price-to-rent
- 30.5×
Monthly cashflow live
- Estimated rent
- $18,847 medium interval (Pro) →
- Mortgage (P&I)
- −$6,031
- Tax from tax record
- −$305 /mo · $3,659/yr
- Insurance
- −$479
- HOA
- −$0
- Vacancy / Maint / Mgmt
- −$3,958
- Net cashflow
- $8,074
Break-even live
6-unit breakdown (identical units grouped — click to expand)
| Units | Beds | Baths | Est. rent |
|---|---|---|---|
| 6× units | 8 | 4 | $18,846 |
| #1 | 8 | 4 | $3,141 |
| #2 | 8 | 4 | $3,141 |
| #3 | 8 | 4 | $3,141 |
| #4 | 8 | 4 | $3,141 |
| #5 | 8 | 4 | $3,141 |
| #6 | 8 | 4 | $3,141 |
| Total (6 units) | $18,847 | ||
UW: 25.0% down · 7.5% · 30yr · 1.5% tax · 5.0% vac · 8.0% maint · 8.0% mgmt
Financing live
Cash to close
- Down payment
- $287,500
- Closing costs
- $34,500
- Reserves months
- —
- Total cash needed
- —
Loan-product check · same deal, 3 products live
Conventional
25% down · 7.5% · 30yr
- Down + closing
- —
- Monthly P&I
- —
- Monthly cashflow
- —
- DSCR
- —
- Eligible?
- —
Personal DTI + credit; lowest rate.
DSCR
20% down · 8.5% · 30yr
- Down + closing
- —
- Monthly P&I
- —
- Monthly cashflow
- —
- DSCR
- —
- Eligible?
- —
No personal income docs; deal must DSCR.
Hard money
10% down · 12.0% · 12mo
- Down + closing
- —
- Monthly P&I
- —
- Monthly cashflow
- —
- DSCR
- —
- Eligible?
- —
Short-term bridge; refi at stabilization.
Listing history 37 events
-
2026-06-18days on market $1,150,000 Active 45 DOM
-
2026-06-17days on market $1,150,000 Active 44 DOM
-
2026-06-16days on market $1,150,000 Active 43 DOM
-
2026-06-15days on market $1,150,000 Active 42 DOM
-
2026-06-13days on market $1,150,000 Active 40 DOM
-
2026-06-09days on market $1,150,000 Active 36 DOM
-
2026-06-08days on market $1,150,000 Active 35 DOM
-
2026-06-07days on market $1,150,000 Active 34 DOM
-
2026-06-04days on market $1,150,000 Active 31 DOM
-
2026-06-03days on market $1,150,000 Active 30 DOM
-
2026-06-02days on market $1,150,000 Active 29 DOM
-
2026-06-02price $1,150,000 Active 28 DOM
-
2026-06-01days on market $1,200,000 Active 28 DOM
-
2026-05-31days on market $1,200,000 Active 27 DOM
-
2026-05-04$1,200,000 Active
-
2019-09-18soldstatus $950,000
-
2019-08-14soldstatus $950,000 Closed 61-char remark
Show marketing remark (61 chars)
This property is a 6-unit multifamily asset, not 4 as listed.
-
2019-04-25status Pending 61-char remark
Show marketing remark (61 chars)
This property is a 6-unit multifamily asset, not 4 as listed.
-
2019-04-03historical Active Under Contract 61-char remark
Show marketing remark (61 chars)
This property is a 6-unit multifamily asset, not 4 as listed.
-
2019-01-22status Pending 61-char remark
Show marketing remark (61 chars)
This property is a 6-unit multifamily asset, not 4 as listed.
-
2018-12-19$1,000,000 Active 61-char remark
Show marketing remark (61 chars)
This property is a 6-unit multifamily asset, not 4 as listed.
-
2010-10-01historical Expired
-
2010-10-01historical
-
2010-05-11price
-
2010-02-12price
-
2009-06-04status
-
2009-06-01historical
-
2009-05-28price
-
2009-02-14
-
2009-02-13$290,000
-
2007-11-14soldstatus $250,000
-
2007-11-01historical
-
2007-02-05
-
2001-06-28soldstatus $117,000
-
1997-04-19historical
-
1996-05-05
-
1990-04-27soldstatus $75,000
ⓘ Source: listings_history table (triggers on properties + properties_extension) + one-shot
backfill from property_details.listing_events for pre-trigger history.
Tax reassessment forecast DC · Partial reset (capped growth)
- Current annual tax
- $3,659 · $305/mo
- Projected year-2 tax
- $5,337 · $445/mo
- Expected delta
- +$1,678/yr (+$140/mo · 45.9%)
ⓘ Screening estimate from a state-policy table — verify with the county assessor before closing.
Nearby sold comps map
Loading sold comps map…
Walkable amenities ~0.75 mi
Loading nearby amenities…
Taxation est. · year 1
- Rental income
- $226,164
- − Mortgage interest
- −$64,418
- − Property taxes
- −$3,659
- − Insurance
- −$5,750
- − Repairs & maintenance
- −$18,093
- − Management
- −$18,093
- − Depreciation
- −$33,455
- Taxable income
- $82,697
- Est. tax owed @ 24.0%
- −$19,847
- After-tax cash flow
- $77,045/yr
For passive investors: Depreciation is non-cash, so a rental often shows a tax loss while cash-flowing — sheltering income. Rental losses are passive: they offset passive income freely, and up to $25,000/yr can offset ordinary (W-2) income if you actively participate and your MAGI is under $100k (phasing out to $0 by $150k); unused losses carry forward. On sale, claimed depreciation is recaptured at up to 25%, and gains may owe capital-gains tax (a 1031 exchange can defer both). Figures are a year-1 estimate at your 24.0% rate — not tax advice; consult a CPA.
Schools (NCES district)
- District
- District Of Columbia Public Schools
- NCES district ID
- 1100030
- Math proficiency
- 33% ▲ 3.00%
- Reading proficiency
- 40% ▲ 5.00%
- Median HH income
- $67,671
- Composite
- 35.84/100
- National rank
- #9606
- State rank
- #8 of 32 in DC
Livability — Washington
- Score
- 73/100
- State rank
- #1
- US rank
- #5327
Category grades
Schools grade is shown separately in the Schools card above.
Census & demographics
- Census place
- Washington, DC
- County
- District of Columbia · 671,873 people
- City population
- 671,873
- Metro
- Washington-Arlington-Alexandria, DC-VA-MD-WV
- Population (ZIP)
- 63,380
- Household income
- $58,296
- Rent vs Own
- Severe rent burden
- 5115.0
Population outlook (District of Columbia County) Hauer SSP2
- Today (2025)
- 821,926 people
- By 2030
- 899,517 · +9.4%
- By 2040
- 1,061,162 · +29.1%
- By 2050
- 1,231,493 · +49.8%
- By 2075
- 1,603,312 · +95.1%
- By 2100
- 1,847,141 · +124.7%
Race, ethnicity, and origin ACS 2023
- Neighborhood character
- Predominantly Black (87%)
- Race & ethnicity
- Black 87% Hispanic / Latino 7% Two or more races 4% White 2%
- Hispanic origin (detail)
- Mexican 1% Dominican 1%
- Foreign-born
- 6% · Canada
- Languages at home
- 91% English-only · Spanish 6% French/Haitian/Cajun 1%
Political lean MEDSL · District of Columbia
- 2024 margin
- Solid D (+86.1) · D 91.2% · R 5.1% · Other 3.8%
- 2008→2024 swing
- +0.1pp no change · 2008: 85.9pp · 2024: 86.1pp
- All cycles
- 2024: D+86.1 2020: D+86.8 2016: D+88.7 2012: D+84.2 2008: D+85.9
Not yet ingested
- Civics
- —
Market trends
- HPI YoY
- ▼ -416.91%
- Current HPI
- 326.4481
- Rent YoY
- ▲ 6.06%
- Metro
- Washington-Arlington-Alexandria, DC-VA-MD-WV
- State GDP YoY
- ▲ 1.33%
- F500 in state
- 6
Industry mix (Fortune 500 HQ in DC)
| Industry | F500 HQs | Revenue |
|---|---|---|
| Financial Services | 1 | $153B |
|
||
| Life Sciences / Industrials | 1 | $25B |
|
||
| Industrial Machinery | 1 | $8B |
|
||
Price history
+1500.0% since first listed23 events — show timeline
- 2026-05-04 Listed $1,200,000 BRIGHT MLS
- 2019-09-18 Sold (Public Records) $950,000 Public Records
- 2019-08-14 Sold (MLS) $950,000 BRIGHT MLS
- 2019-04-25 Pending — BRIGHT MLS
- 2019-04-03 Contingent — BRIGHT MLS
- 2019-01-22 Pending — BRIGHT MLS
- 2018-12-19 Listed $1,000,000 BRIGHT MLS
- 2010-10-01 Delisted — MRIS
- 2010-10-01 Listing Removed — BRIGHT MLS
- 2010-05-11 Price Changed — MRIS
- 2010-02-12 Price Changed — MRIS
- 2009-06-04 Relisted — MRIS
- 2009-06-01 Delisted — MRIS
- 2009-05-28 Price Changed — MRIS
- 2009-02-14 Listed — MRIS
- 2009-02-13 Listed $290,000 BRIGHT MLS
- 2007-11-14 Sold (Public Records) $250,000 Public Records
- 2007-11-01 Delisted — MRIS
- 2007-02-05 Listed — MRIS
- 2001-06-28 Sold (Public Records) $117,000 Public Records
- 1997-04-19 Delisted — MRIS
- 1996-05-05 Listed — MRIS
- 1990-04-27 Sold (Public Records) $75,000 Public Records
Property tax history
+2.2%/yrLatest (2025): $3,659 · -24.9% YoY. Source: county tax records.
Cash-flow waterfall
monthlySold comps — $/sqft
last 12 mo · ≤1 miLoading sold comps…