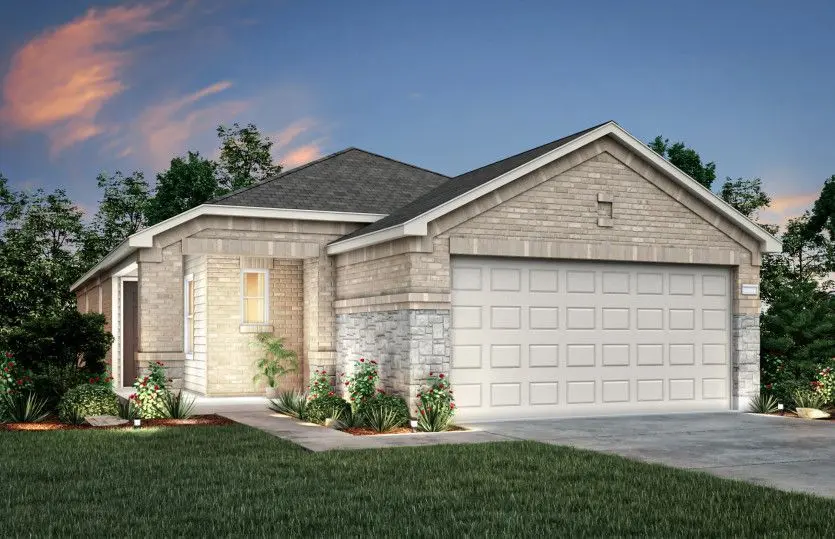
15869 Blass Valley Dr · Grangerland, TX
Flood risk No data
- FEMA flood zone
- —
- Chance of flooding over 30 yrs
- —
- Est. flood insurance / yr
- —
Fire risk No data
- Est. fire insurance / yr
- —
Heat risk No data
- Hot days now (above threshold)
- —
- Hot days in 30 yrs
- —
Wind risk No data
- Chance of severe wind over 30 yrs
- —
Air-quality risk No data
- Unhealthy air days now
- —
- Unhealthy air days in 30 yrs
- —
Risk factors via First Street. Map © Google.
Why this score? — see what drove the D grade
The composite is a weighted blend of 9 inputs, each scored 0–100. Each bar is that input's sub-score; the figure is the points it added to the 100-point composite (weight × sub-score).
- Cash flow +12.2/30.0
- ARV discount +6.1/15.0
- Schools +5.1/10.0
- Condition / age +4.0/5.0
- DSCR +3.6/10.0
- 1% rule +3.5/10.0
- Rent growth +3.3/5.0
- Livability +2.5/5.0
- Appreciation +0.0/10.0
$247,159
🖨 Deal sheet (PDF) 📄 Offer letter ✓ Due diligence
Listing remarks
Contact Sales for Details
Key facts
- 2 garage spots
- Built 2026
- Listed 14 days
Property features AI
Finance
- Other: Address: 15869 Blass Valley Dr, Conroe TX 77302; Status: Active; Last modified: 2026-06-07
- Financial info: List price $247,159
Exterior
- Parking: 2 total parking spaces; 2-car garage
- Home design: Spec inventory, Plan name: Adams
Interior
- Bedrooms: 3 bedrooms
- Bathrooms: 2 bathrooms
- Interior features: Living area of 1204
Neighborhood map
What this means for you Summary
Snapshot
- This is a 3-bed/2.0-bath single-family listed at $247k. Condition is rated good.
Deal economics
- At list price, monthly cash flow is $-51 ($-611/yr) — negative.
- To cash-flow at today's rent, offer at most $240k (3.0% below list).
- To meet the 1% rule (rent ≥ 1% of price), the offer needs to be $210k (15.1% below list).
- Recommended offer: $210k (15.1% below list) — sets the bar for 1% rule.
Location & tenants
- Location reads: area grade D — affects rentability + tenant quality, not the cash-flow math above.
- Conroe ISD (other): math 57% / reading 57% proficiency, ranked #69 of 826 in TX (top 8%) — acceptable for families but not a draw, mixed tenant base, ~2y average lease.
- Zoned schools: San Jacinto El (math 35% / reading 37%, grade F, #1,921 of 4,322 statewide, top 45%, 547 students, 81% FRL); Moorhead J H (math 35% / reading 42%, grade F, #704 of 1,662 statewide, top 43%, 1,391 students, 82% FRL); Conroe H S (math 32% / reading 51%, grade F, #767 of 1,632 statewide, top 47%, 4,915 students, 61% FRL) — zoned schools average 75% FRL vs 34% district-wide (40 pts higher); higher-poverty schools than district average — tighter screening recommended.
- Zoned-school proficiency averages 39% at this address vs 57% district-wide (-18 pts) — the specific schools serving this property underperform the Conroe ISD average; the district grade overstates school quality for this exact location.
- Market conditions: Rents rising (+3.3%/yr); 1117 active listings in the ZIP; solid renter incomes; 13,259 units permitted in Montgomery County in 2024 (1,402 in 5+ unit buildings).
Forward outlook
- Local home prices are declining (-3.0%/yr); year-one equity from $2k of loan paydown is wiped out by about $7k of value loss. Plan a longer hold.
- Montgomery County population projected at +65% by 2050 — long-run rental-demand tailwind backs the buy-and-hold thesis.
Negotiation context
- It's been on market 15 days — a 2% lower offer ($243k) is reasonable based on typical stale-listing flexibility.
Questions for the listing agent
- What do current leases actually rent for vs. the listed asking? Can we see a recent rent roll and the last 12 months of T-12 income?
- Is there a deadline driving the sale (1031 exchange, divorce, estate, relocation)? That informs how much negotiation room exists.
- The area grade is low — what's the realistic commute time and amenity access for the typical tenant pool here? Any planned neighborhood developments (good or bad) we should know about?
- What's the average days-on-market for RENTAL listings here right now (not sales)? A rising rental-DOM trend means longer vacancies and softer asking-rent achievability than the comps imply.
- What's the recent tenant-quality profile in this submarket — average credit score on applications, eviction rate, late-payment / NSF rate, and stable-employment percentage? A property-management company in the area should have these aggregated.
- How much new for-sale + rental construction is in the pipeline within 1–3 miles? Heavy new supply typically softens prices + rents 12–24 months out; constrained supply supports both.
Investment metrics
- 1% rule
- 0.85% ✗
- Cap rate
- 6.05%
- Cash-on-cash
- -0.88%
- DSCR
- 0.96
- GRM
- 9.8
CMA / ARV
- ARV (on-the-fly)
- $239,596
- Comps found
- 12
Show comp detail 12 sales within ~0.75 mi
| Address | Dist | Beds/Ba | Sqft | Sold | Price | $/sf | Match |
|---|---|---|---|---|---|---|---|
| 16125 Sepia Manor St | 0.15mi | 3/2.0 | 1,204 (0%) | 3mo | $239,840 | $199 | 90 |
| 16408 Windy Cove Ct | 0.21mi | 3/2.0 | 1,204 (0%) | 6mo | $234,460 | $195 | 85 |
| 16181 Sepia Manor St | 0.15mi | 3/2.5 | 1,204 (0%) | 7mo | $239,990 | $199 | 85 |
| 15229 Canyon Rapids Rd | 0.19mi | 3/2.0 | 1,204 (0%) | 10mo | $239,990 | $199 | 83 |
| 16956 Juniper Blossom Bnd | 0.33mi | 3/2.0 | 1,206 (+0%) | 6mo | $228,485 | $189 | 79 |
| 16944 Juniper Blossom Bnd | 0.33mi | 3/2.0 | 1,204 (0%) | 8mo | $248,847 | $207 | 78 |
| 16317 Sun View Ln | 0.37mi | 3/2.0 | 1,154 (-4%) | 5mo | $190,000 | $165 | 72 |
| 16293 Sun View Ln | 0.36mi | 3/2.0 | 1,264 (+5%) | 5mo | $189,000 | $150 | 70 |
| 16675 Sterling Cliff St | 0.29mi | 3/2.0 | 1,287 (+7%) | 7mo | $261,690 | $203 | 69 |
| 16371 Long Valley Ct | 0.42mi | 3/2.0 | 1,264 (+5%) | 6mo | $190,000 | $150 | 67 |
| 16228 Sun View Ln | 0.45mi | 3/2.0 | 1,145 (-5%) | 5mo | $180,000 | $157 | 67 |
| 16699 Sterling Cliff St | 0.33mi | 3/2.0 | 1,287 (+7%) | 10mo | $266,440 | $207 | 65 |
Match score weights: distance 35% · size 25% · config 20% · recency 20%. Top-matched comps best support the ARV.
Projected returns pro-forma
-3.0% appreciation · 3.3% rent growth · sell at horizon
- IRR
- -17.4%
- Equity multiple
- 0.38×
- Total profit
- $-42,628
- Equity at exit
- $36,852
- IRR
- -8.8%
- Equity multiple
- 0.44×
- Total profit
- $-38,546
- Equity at exit
- $21,370
Cash invested: $69,205 (down + closing). Projections, not guarantees.
Landlord ↔ Tenant lean methodology
- Overall (STATE)
- 87 Strongly Landlord-Friendly
- State Texas
- 87 Strongly Landlord-Friendly · R+5
- County
- — inherits STATE
- City
- — inherits STATE
ZIP-level market 77302
- Rents YoY
- 3.3%
- Active inventory
- 1117
- Price-to-rent
- 9.8×
Monthly cashflow live
- Estimated rent
- $2,098 medium interval (Pro) →
- Mortgage (P&I)
- −$1,296
- Tax est. 1.5%
- −$309 /mo · $3,707/yr
- Insurance
- −$103
- HOA
- −$0
- Vacancy / Maint / Mgmt
- −$441
- Net cashflow
- $-51
Break-even live
Sensitivity live
| Price | -10% $120 | -5% $34 | +0% $-51 | +5% $-136 | +10% $-222 |
|---|---|---|---|---|---|
| Rent | -10% $-217 | -5% $-134 | +0% $-51 | +5% $32 | +10% $115 |
| Rate | -1.0pp $74 | -0.5pp $12 | base $-51 | +0.5pp $-115 | +1.0pp $-180 |
UW: 25.0% down · 7.5% · 30yr · 1.5% tax · 5.0% vac · 8.0% maint · 8.0% mgmt
Financing live
Cash to close
- Down payment
- $61,790
- Closing costs
- $7,415
- Reserves months
- —
- Total cash needed
- —
Loan-product check · same deal, 3 products live
Conventional
25% down · 7.5% · 30yr
- Down + closing
- —
- Monthly P&I
- —
- Monthly cashflow
- —
- DSCR
- —
- Eligible?
- —
Personal DTI + credit; lowest rate.
DSCR
20% down · 8.5% · 30yr
- Down + closing
- —
- Monthly P&I
- —
- Monthly cashflow
- —
- DSCR
- —
- Eligible?
- —
No personal income docs; deal must DSCR.
Hard money
10% down · 12.0% · 12mo
- Down + closing
- —
- Monthly P&I
- —
- Monthly cashflow
- —
- DSCR
- —
- Eligible?
- —
Short-term bridge; refi at stabilization.
Listing history 10 events
-
2026-06-21days on market $247,159 Active 15 DOM
-
2026-06-18days on market $247,159 Active 12 DOM
-
2026-06-17days on market $247,159 Active 11 DOM
-
2026-06-16days on market $247,159 Active 10 DOM
-
2026-06-15days on market $247,159 Active 9 DOM
-
2026-06-13days on market $247,159 Active 7 DOM
-
2026-06-09days on market $247,159 Active 3 DOM
-
2026-06-08days on market $247,159 Active 2 DOM
-
2026-06-07remarks 25-char remark
-
2026-06-07$247,159 Active 1 DOM
ⓘ Source: listings_history table (triggers on properties + properties_extension) + one-shot
backfill from property_details.listing_events for pre-trigger history.
Nearby sold comps map
Loading sold comps map…
Walkable amenities ~0.75 mi
Loading nearby amenities…
Taxation est. · year 1
- Rental income
- $25,172
- − Mortgage interest
- −$13,845
- − Property taxes
- −$3,707
- − Insurance
- −$1,236
- − Repairs & maintenance
- −$2,014
- − Management
- −$2,014
- − Depreciation
- −$7,190
- Taxable loss
- −$4,834
- Est. tax savings @ 24.0%
- +$1,160
- After-tax cash flow
- $549/yr
For passive investors: Depreciation is non-cash, so a rental often shows a tax loss while cash-flowing — sheltering income. Rental losses are passive: they offset passive income freely, and up to $25,000/yr can offset ordinary (W-2) income if you actively participate and your MAGI is under $100k (phasing out to $0 by $150k); unused losses carry forward. On sale, claimed depreciation is recaptured at up to 25%, and gains may owe capital-gains tax (a 1031 exchange can defer both). Figures are a year-1 estimate at your 24.0% rate — not tax advice; consult a CPA.
Condition & rehab AI · 9 photos
This home is in good condition with a good exterior and interior. It has a good layout and is move-in ready. Potential buyers and renters would appreciate updates to the exterior, kitchen, and lighting to further enhance its value.
Value-add opportunities
- Both Painting the exterior — Fresh paint can enhance curb appeal and property value.
- Both Landscaping improvements — Enhanced landscaping can improve curb appeal and attract potential buyers/tenants.
- Resale Updating the kitchen backsplash — A fresh backsplash can modernize the kitchen and appeal to potential buyers.
- Resale Updating the flooring in the bathrooms — Fresh flooring can make bathrooms more appealing and increase the property's resale value.
- Resale Updating the paint in the bedrooms — Fresh paint can make bedrooms more inviting and increase the property's resale value.
- Both Upgrading the lighting fixtures — Modern lighting can enhance the overall aesthetic and increase the property's rental value.
- Both Adding smart home features — Smart home features can increase the property's appeal and value, both for resale and rental.
Renovation cost estimate screening
Value-add ROI direction
- Both Painting the exterior — Fresh paint can enhance curb appeal and property value. ↑
- Both Landscaping improvements — Enhanced landscaping can improve curb appeal and attract potential buyers/tenants. ↑
- Resale Updating the kitchen backsplash — A fresh backsplash can modernize the kitchen and appeal to potential buyers. ↑
- Resale Updating the flooring in the bathrooms — Fresh flooring can make bathrooms more appealing and increase the property's resale value. ↑
- Resale Updating the paint in the bedrooms — Fresh paint can make bedrooms more inviting and increase the property's resale value. ↑
- Both Upgrading the lighting fixtures — Modern lighting can enhance the overall aesthetic and increase the property's rental value. ↑
- Both Adding smart home features — Smart home features can increase the property's appeal and value, both for resale and rental. ↑
ⓘ Cost ranges are severity-bucket heuristics (US national rule-of-thumb). Get contractor quotes + a written scope before underwriting a rehab budget.
Schools (NCES district)
- District
- Conroe ISD
- NCES district ID
- 4815000
- Math proficiency
- 57% ▼ -6.00%
- Reading proficiency
- 57% ▼ -1.00%
- Median HH income
- $71,541
- Composite
- 50.65/100
- National rank
- #1833
- State rank
- #69 of 826 in TX
Livability — Grangerland
No livability data for this city. (Only ~50 U.S. cities are tracked.)
Census & demographics
- County
- Montgomery County · 663,713 people
- Metro
- Houston-The Woodlands-Sugar Land, TX
- Population (ZIP)
- 21,546
- Household income
- $84,673
- Rent vs Own
- Severe rent burden
- 205.0
Population outlook (Montgomery County) Hauer SSP2
- Today (2025)
- 713,896 people
- By 2030
- 805,263 · +12.8%
- By 2040
- 992,708 · +39.1%
- By 2050
- 1,179,590 · +65.2%
- By 2075
- 1,628,084 · +128.1%
- By 2100
- 1,937,880 · +171.5%
Race, ethnicity, and origin ACS 2023
- Neighborhood character
- Majority White (63%)
- Race & ethnicity
- White 63% Hispanic / Latino 29% Two or more races 19% Black 3% Asian 1%
- Hispanic origin (detail)
- Mexican 26% Puerto Rican 1%
- Common ancestry
- Lithuanian 3% Italian 2% Slovak 2%
- Foreign-born
- 13% · Canada, Vietnam, China
- Languages at home
- 78% English-only · Spanish 20% Russian/Polish/Slavic 1% Other Indo-European 0%
Political lean MEDSL · Montgomery
- 2024 margin
- Solid R (+45.5) · D 26.8% · R 72.3%
- 2008→2024 swing
- +7.2pp toward D · 2008: -52.7pp · 2024: -45.5pp
- All cycles
- 2024: R+45.5 2020: R+43.8 2016: R+51.4 2012: R+60.7 2008: R+52.7
Not yet ingested
- Civics
- —
Market trends
- HPI YoY
- ▼ -187.56%
- Current HPI
- 262.1879
- Rent YoY
- ▲ 3.30%
- Metro
- Houston-The Woodlands-Sugar Land, TX
- State GDP YoY
- ▲ 3.95%
- F500 in state
- 110
Industry mix (Fortune 500 HQ in TX)
| Industry | F500 HQs | Revenue |
|---|---|---|
| Energy | 16 | $1,198B |
|
||
| Technology | 5 | $198B |
|
||
| Engineering / Construction | 4 | $72B |
|
||
| Energy Services | 3 | $60B |
|
||
| Utilities | 3 | $41B |
|
||
| Healthcare | 2 | $330B |
|
||
Cash-flow waterfall
monthlySold comps — $/sqft
last 12 mo · ≤1 miLoading sold comps…