 5-Plex
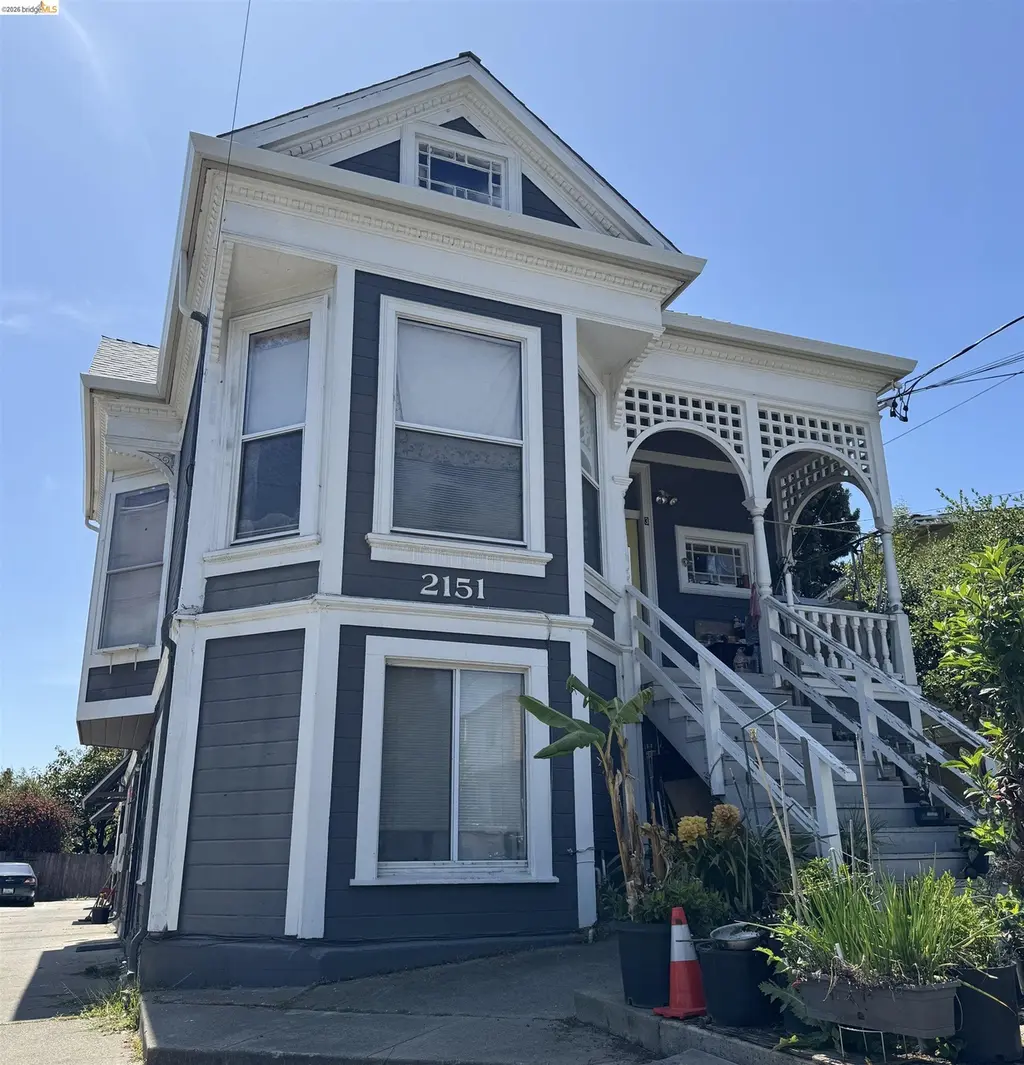
2151 E 24th St · Oakland, CA
Flood risk 1/10 · Minimal
- FEMA flood zone
- X (unshaded)
- Chance of flooding over 30 yrs
- 0.0%
- Est. flood insurance / yr
- $507 – $1,088
Fire risk 1/10 · Minimal
- Est. fire insurance / yr
- $659 – $1,223
Heat risk 3/10 · Minor
- Hot days now (above 84°F)
- 7 days/yr
- Hot days in 30 yrs
- 15 days/yr
Wind risk 1/10 · Minimal
- Chance of severe wind over 30 yrs
- —
Air-quality risk 8/10 · Major
- Unhealthy air days now
- 14 days/yr
- Unhealthy air days in 30 yrs
- 14 days/yr
Risk factors via First Street. Map © Google.
Why this score? — see what drove the B- grade
The composite is a weighted blend of 9 inputs, each scored 0–100. Each bar is that input's sub-score; the figure is the points it added to the 100-point composite (weight × sub-score).
- Cash flow +25.4/30.0
- ARV discount +12.4/15.0
- DSCR +8.4/10.0
- 1% rule +7.5/10.0
- Livability +3.6/5.0
- Rent growth +3.0/5.0
- Schools +3.0/10.0
- Condition / age +2.5/5.0
- Appreciation +0.0/10.0
$795,000
🖨 Deal sheet 📄 Offer letter ✓ Due diligence
Multi-family units
County records classify this as Multi-Family (5+ Unit). Listing-text estimate: 5 units. confirmed
5+ unit building — per-unit beds/baths from public records are typically unavailable; the breakdown below (if shown) is an estimate from the listing text.
Listing remarks MLS
2151 E 24th Street is a well-maintained Victorian-style 5-unit building in Oakland's desirable Highland Terrace neighborhood known for accessibility in a central location. Featuring (4) Two Bed/One Bath units and (1) One Bed/One Bath with desirable floor plans that attract and maintain long-term, reliable tenants. Built in 1940, the ±3,452 sq. ft. building features classic wood construction and siding on a concrete perimeter foundation and a pitched composition shingle roof. The ±7,000 sq. ft. parcel features ample parking with 5 assigned spaces to the rear of the property plus 2 tandem parking spaces on the right side of the building and the minimal landscaping makes for easy maintenance. 2151 E 24th Street presents a strong value-add opportunity with substantial income upside in a high-demand rental market. Each unit has a private entrance and the property has shared laundry facilities for added convenience and income. Garfield Elementary, Roosevelt Middle School, and Oakland High School are nearby. Quick access to I-880 & I-580 plus San Antonio & Peralta Parks.
Key facts
- Ample parking
- Private entrance
- 7,000 sq ft lot
Tags
Neighborhood map
What this means for you Summary
Snapshot
- This is a 4×2bd/1ba + 1×1bd/1ba units multifamily listed at $795k.
Deal economics
- At list price, monthly cash flow is $2k ($22k/yr) — positive. Per door: $367/mo.
- The deal already cash-flows at list — no discount required.
- Meets the 1% rule at list price ($10k rent vs $795k).
- Recommended offer: $747k (6.0% below list) — sets the bar for market timing.
- Cap rate 9.1% vs local median 2.4% in Oakland — top-decile yield for the area; either an underpriced asset or a hidden risk that comps aren't pricing in. Stress-test before assuming the spread holds.
Location & tenants
- Location reads 71/100 on livability (#224 in CA) — a middle-class / working-renter tenant base. Strengths: amenities A+, commute A+, employment A+; Watch: schools C-, crime F, cost of living F.
- Oakland Unified (urban): math 27% / reading 33% proficiency, ranked #1,007 of 1,400 in CA (top 72%) — families likely to look elsewhere, expect single-tenant / working-renter base with shorter leases; 68% free/reduced lunch — lower-income household profile, screen leases tightly.
- Market conditions: Rents rising (+1.9%/yr); 127 active listings in the ZIP; 1,742 units permitted in Alameda County in 2024 (856 in 5+ unit buildings).
- At $9,915/mo this rent would consume 164% of the median local household income ($72k/yr) (locally 3757% of renters already pay >50% of income on rent) — very limited rent-growth headroom before tenants either downsize or default.
Forward outlook
- Local home prices are declining (-3.0%/yr); year-one equity from $5k of loan paydown is wiped out by about $24k of value loss. Plan a longer hold.
- Alameda County population projected at +34% by 2050 — long-run rental-demand tailwind backs the buy-and-hold thesis.
Negotiation context
- It's been on market 77 days — a 6% lower offer ($747k) is reasonable based on typical stale-listing flexibility.
- 5 sale attempts since 15y ago with the ask held roughly flat each time — persistent listings suggest the price (not the market) is what's stuck; bring a comps-based counter.
Risks & watch-outs
- Watch-outs: built in 1940 — expect roof / HVAC / electrical / plumbing capex.
Questions for the listing agent
- It's been on market 77 days. Have you received any prior offers? Is the seller open to a 6% concession, seller financing, or rate buy-down credit?
- Can we see the unit-by-unit rent roll, current vacancy, and any below-market leases? What's the average tenancy length?
- What capital expenditures (roof, boiler, parking lot, exteriors) have been made in the last 5 years, and what's planned in the next 2?
- Built in 1940 — when were the roof, HVAC, electrical panel, plumbing, and water heater last replaced?
- Why hasn't it sold? Are there any deal-killer items the seller is aware of (foundation, flood, title, zoning, code violations)?
- Is there a deadline driving the sale (1031 exchange, divorce, estate, relocation)? That informs how much negotiation room exists.
- Crime grade is F in this area — have there been break-ins, vandalism, or insurance claims at this property in the last 3 years? What carrier currently insures it and at what premium?
- What's the average days-on-market for RENTAL listings here right now (not sales)? A rising rental-DOM trend means longer vacancies and softer asking-rent achievability than the comps imply.
- What's the recent tenant-quality profile in this submarket — average credit score on applications, eviction rate, late-payment / NSF rate, and stable-employment percentage? A property-management company in the area should have these aggregated.
- How much new apartment / multifamily construction is in the pipeline within 1–3 miles? Heavy new supply (>2% of stock underway) typically softens rents 12–24 months out; light construction supports rent growth.
Investment metrics
- 1% rule
- 1.25% ✓
- Cap rate
- 9.06%
- Cash-on-cash
- 9.90%
- DSCR
- 1.44
- GRM
- 6.7
CMA / ARV
- ARV (median comp)
- $891,131
- List price
- $795,000
- Delta
- -10.79%
- Verdict
- UNDERPRICED
- Comps
- 20 within 1.0 mi
Show comp detail 6 sales within ~0.75 mi
| Address | Dist | Beds/Ba | Sqft | Sold | Price | $/sf | Match |
|---|---|---|---|---|---|---|---|
| 2231 E 28th St | 0.30mi | 8/4.0 (+1) | 3,378 (-2%) | 9mo | $1,300,000 | $385 | 66 |
| 2670 25th Ave | 0.40mi | 8/4.0 (+1) | 3,476 (+1%) | 20mo | $804,000 | $231 | 55 |
| 2748 Garden St | 0.47mi | 8/6.0 (+1) | 3,456 (+0%) | 22mo | $880,000 | $255 | 51 |
| 2619 E 16th St | 0.62mi | 8/5.0 (+1) | 3,569 (+3%) | 17mo | $1,100,000 | $308 | 46 |
| 2819 Garden St | 0.51mi | 8/4.0 (+1) | 3,364 (-2%) | 23mo | $985,000 | $293 | 44 |
| 2808 25th Ave | 0.49mi | 8/4.0 (+1) | 3,816 (+10%) | 15mo | $600,000 | $157 | 38 |
Match score weights: distance 35% · size 25% · config 20% · recency 20%. Top-matched comps best support the ARV.
Projected returns pro-forma
-3.0% appreciation · 1.86% rent growth · sell at horizon
- IRR
- -2.7%
- Equity multiple
- 0.90×
- Total profit
- $-22,692
- Equity at exit
- $118,537
- IRR
- 5.6%
- Equity multiple
- 1.39×
- Total profit
- $87,559
- Equity at exit
- $68,737
Cash invested: $222,600 (down + closing). Projections, not guarantees.
Landlord ↔ Tenant lean methodology
- Overall (CITY)
- 0 Strongly Tenant-Friendly
- State California
- 18 Strongly Tenant-Friendly · D+13
- County
- — inherits STATE
- City Oakland
- 0 Strongly Tenant-Friendly · D+62
ZIP-level market 94606
- Rents YoY
- 1.9%
- Active inventory
- 127
- Price-to-rent
- 32.9×
Monthly cashflow live
- Estimated rent
- $9,915 high interval (Pro) →
- Mortgage (P&I)
- −$4,169
- Tax from tax record
- −$1,497 /mo · $17,961/yr
- Insurance
- −$331
- HOA
- −$0
- Vacancy / Maint / Mgmt
- −$2,082
- Net cashflow
- $1,836
Break-even live
5-unit breakdown (identical units grouped — click to expand)
| Units | Beds | Baths | Est. rent |
|---|---|---|---|
| 4× units | 2 | 1 | $8,052 |
| #1 | 2 | 1 | $2,013 |
| #2 | 2 | 1 | $2,013 |
| #3 | 2 | 1 | $2,013 |
| #4 | 2 | 1 | $2,013 |
| 1× unit | 1 | 1 | $1,861 |
| Total (5 units) | $9,915 | ||
UW: 25.0% down · 7.5% · 30yr · 1.5% tax · 5.0% vac · 8.0% maint · 8.0% mgmt
Financing live
Cash to close
- Down payment
- $198,750
- Closing costs
- $23,850
- Reserves months
- —
- Total cash needed
- —
Loan-product check · same deal, 3 products live
Conventional
25% down · 7.5% · 30yr
- Down + closing
- —
- Monthly P&I
- —
- Monthly cashflow
- —
- DSCR
- —
- Eligible?
- —
Personal DTI + credit; lowest rate.
DSCR
20% down · 8.5% · 30yr
- Down + closing
- —
- Monthly P&I
- —
- Monthly cashflow
- —
- DSCR
- —
- Eligible?
- —
No personal income docs; deal must DSCR.
Hard money
10% down · 12.0% · 12mo
- Down + closing
- —
- Monthly P&I
- —
- Monthly cashflow
- —
- DSCR
- —
- Eligible?
- —
Short-term bridge; refi at stabilization.
Listing history 30 events
-
2026-06-18days on market $795,000 Active 77 DOM
-
2026-06-17days on market $795,000 Active 76 DOM
-
2026-06-16days on market $795,000 Active 75 DOM
-
2026-06-15days on market $795,000 Active 74 DOM
-
2026-06-13days on market $795,000 Active 72 DOM
-
2026-06-13days on market $795,000 Active 71 DOM
-
2026-06-09days on market $795,000 Active 68 DOM
-
2026-06-08days on market $795,000 Active 67 DOM
-
2026-06-07days on market $795,000 Active 66 DOM
-
2026-06-04days on market $795,000 Active 63 DOM
-
2026-06-03days on market $795,000 Active 62 DOM
-
2026-06-02days on market $795,000 Active 61 DOM
-
2026-06-01days on market $795,000 Active 60 DOM
-
2026-05-31days on market $795,000 Active 59 DOM
-
2026-04-02$795,000 Active 1104-char remark
Show marketing remark (1104 chars)
2151 E 24th Street is a well-maintained Victorian-style 5-unit building in Oakland's desirable Highland Terrace neighborhood known for accessibility in a central location. Featuring (4) Two Bed/One Bath units and (1) One Bed/One Bath with desirable floor plans that attract and maintain long-term, reliable tenants. Built in 1940, the ±3,452 sq. ft. building features classic wood construction and siding on a concrete perimeter foundation and a pitched composition shingle roof. The ±7,000 sq. ft. parcel features ample parking with 5 assigned spaces to the rear of the property plus 2 tandem parking spaces on the right side of the building and the minimal landscaping makes for easy maintenance. 2151 E 24th Street presents a strong value-add opportunity with substantial income upside in a high-demand rental market. Each unit has a private entrance and the property has shared laundry facilities for added convenience and income. Garfield Elementary, Roosevelt Middle School, and Oakland High School are nearby. Quick access to I-880 & I-580 plus San Antonio & Peralta Parks.
-
2017-08-23status Pending (Do Not Show) 274-char remark
Show marketing remark (274 chars)
Well maintained 5-unit Victorian Style building with desirable floor plans and great location close to shopping, transportation and Hwy 580 & 880. All units are fully occupied by excellent long term tenants. Existing rents are very low & lots of room for increase.
-
2017-08-23soldstatus $887,000 Sold 274-char remark
Show marketing remark (274 chars)
Well maintained 5-unit Victorian Style building with desirable floor plans and great location close to shopping, transportation and Hwy 580 & 880. All units are fully occupied by excellent long term tenants. Existing rents are very low & lots of room for increase.
-
2017-08-23soldstatus $887,000 Closed
Show marketing remark (274 chars)
Well maintained 5-unit Victorian Style building with desirable floor plans and great location close to shopping, transportation and Hwy 580 & 880. All units are fully occupied by excellent long term tenants. Existing rents are very low & lots of room for increase.
-
2017-08-23soldstatus $887,000
Show marketing remark (274 chars)
Well maintained 5-unit Victorian Style building with desirable floor plans and great location close to shopping, transportation and Hwy 580 & 880. All units are fully occupied by excellent long term tenants. Existing rents are very low & lots of room for increase.
-
2017-07-21$848,000 Active
Show marketing remark (274 chars)
Well maintained 5-unit Victorian Style building with desirable floor plans and great location close to shopping, transportation and Hwy 580 & 880. All units are fully occupied by excellent long term tenants. Existing rents are very low & lots of room for increase.
-
2017-07-21$848,000 Active 274-char remark
Show marketing remark (274 chars)
Well maintained 5-unit Victorian Style building with desirable floor plans and great location close to shopping, transportation and Hwy 580 & 880. All units are fully occupied by excellent long term tenants. Existing rents are very low & lots of room for increase.
-
2017-07-20$848,000
-
2011-09-09soldstatus $376,000
-
2011-09-08soldstatus $376,000
-
2011-05-29$399,500
-
2001-09-28soldstatus $370,000
-
1993-10-29soldstatus $240,000
-
1986-12-29soldstatus $179,000
-
1986-12-29soldstatus $179,000
ⓘ Source: listings_history table (triggers on properties + properties_extension) + one-shot
backfill from property_details.listing_events for pre-trigger history.
Tax reassessment forecast CA · Resets to sale price
- Current annual tax
- $17,961 · $1,497/mo
- Projected year-2 tax
- $17,961 · $1,497/mo
- Expected delta
- $0/yr ($0/mo · 0.0%)
ⓘ Screening estimate from a state-policy table — verify with the county assessor before closing.
Climate risk First Street
- Flood 1/10 Low FEMA zone X (unshaded) · 0% chance over 30 yrs
- Wildfire 1/10 Low
- Heat 3/10 Moderate 7 d/yr ≥84°F today · 15 d/yr by 30 yrs out
- Wind 1/10 Low
- Air quality 8/10 Severe 14 unhealthy d/yr today · 14 by 30 yrs out
Nearby sold comps map
Loading sold comps map…
Walkable amenities ~0.75 mi
Loading nearby amenities…
Taxation est. · year 1
- Rental income
- $118,980
- − Mortgage interest
- −$44,532
- − Property taxes
- −$17,961
- − Insurance
- −$3,975
- − Repairs & maintenance
- −$9,518
- − Management
- −$9,518
- − Depreciation
- −$23,127
- Taxable income
- $10,347
- Est. tax owed @ 24.0%
- −$2,483
- After-tax cash flow
- $19,546/yr
For passive investors: Depreciation is non-cash, so a rental often shows a tax loss while cash-flowing — sheltering income. Rental losses are passive: they offset passive income freely, and up to $25,000/yr can offset ordinary (W-2) income if you actively participate and your MAGI is under $100k (phasing out to $0 by $150k); unused losses carry forward. On sale, claimed depreciation is recaptured at up to 25%, and gains may owe capital-gains tax (a 1031 exchange can defer both). Figures are a year-1 estimate at your 24.0% rate — not tax advice; consult a CPA.
Schools (NCES district)
- District
- Oakland Unified
- NCES district ID
- 0628050
- Math proficiency
- 27% ▬ 0.00%
- Reading proficiency
- 33% ▬ 0.00%
- Median HH income
- $55,194
- Composite
- 29.52/100
- National rank
- #11769
- State rank
- #1007 of 1400 in CA
Livability — Oakland
- Score
- 71/100
- State rank
- #224
- US rank
- #7245
Category grades
Schools grade is shown separately in the Schools card above.
Census & demographics
- Census place
- Oakland, CA
- County
- Alameda County · 1,614,355 people
- City population
- 385,993
- Metro
- San Francisco-Oakland-Berkeley, CA
- Population (ZIP)
- 39,966
- Household income
- $72,470
- Rent vs Own
- Severe rent burden
- 3757.0
Population outlook (Alameda County) Hauer SSP2
- Today (2025)
- 1,928,884 people
- By 2030
- 2,069,146 · +7.3%
- By 2040
- 2,338,405 · +21.2%
- By 2050
- 2,586,608 · +34.1%
- By 2075
- 3,061,911 · +58.7%
- By 2100
- 3,234,133 · +67.7%
Race, ethnicity, and origin ACS 2023
- Neighborhood character
- Highly diverse neighborhood (Simpson 0.77)
- Race & ethnicity
- Asian 32% Hispanic / Latino 25% White 20% Black 16% Two or more races 10% Native American 2%
- Hispanic origin (detail)
- Mexican 15%
- Common ancestry
- Italian 1% Romanian 1% Lithuanian 1%
- Foreign-born
- 38% · Canada, Vietnam, China
- Languages at home
- 47% English-only · Spanish 19% Chinese 14% Vietnamese 7%
Political lean MEDSL · Alameda
- 2024 margin
- Solid D (+53.6) · D 74.6% · R 21.0% · Other 4.4%
- 2008→2024 swing
- -5.9pp toward R · 2008: 59.5pp · 2024: 53.6pp
- All cycles
- 2024: D+53.6 2020: D+62.5 2016: D+64.4 2012: D+59.8 2008: D+59.5
Not yet ingested
- Civics
- —
Market trends
- HPI YoY
- ▼ -798.52%
- Current HPI
- 334.5111
- Rent YoY
- ▲ 1.86%
- Metro
- San Francisco-Oakland-Berkeley, CA
- State GDP YoY
- ▲ 3.21%
- F500 in state
- 116
Industry mix (Fortune 500 HQ in CA)
| Industry | F500 HQs | Revenue |
|---|---|---|
| Technology | 27 | $1,492B |
|
||
| Financial Services | 3 | $174B |
|
||
| Retail | 3 | $44B |
|
||
| Insurance | 3 | $26B |
|
||
| Media / Entertainment | 2 | $115B |
|
||
| Pharmaceuticals / Biotech | 2 | $62B |
|
||
Price history
+344.1% since first listed16 events — show timeline
- 2026-04-02 Listed $795,000 bridgeMLS, Bay East AOR, or Contra Costa AOR
- 2017-08-23 Pending — MLSListings
- 2017-08-23 Sold (Public Records) $887,000 Public Records
- 2017-08-23 Sold (MLS) $887,000 bridgeMLS, Bay East AOR, or Contra Costa AOR
- 2017-08-23 Sold (MLS) $887,000 San Francisco MLS
- 2017-08-23 Sold (MLS) $887,000 MLSListings
- 2017-07-21 Listed $848,000 San Francisco MLS
- 2017-07-21 Listed $848,000 MLSListings
- 2017-07-20 Listed $848,000 bridgeMLS, Bay East AOR, or Contra Costa AOR
- 2011-09-09 Sold (MLS) $376,000 bridgeMLS, Bay East AOR, or Contra Costa AOR
- 2011-09-08 Sold (Public Records) $376,000 Public Records
- 2011-05-29 Listed $399,500 bridgeMLS, Bay East AOR, or Contra Costa AOR
- 2001-09-28 Sold (Public Records) $370,000 Public Records
- 1993-10-29 Sold (Public Records) $240,000 Public Records
- 1986-12-29 Sold (Public Records) $179,000 Public Records
- 1986-12-29 Sold (Public Records) $179,000 Public Records
Property tax history
+1.0%/yrLatest (2025): $17,961 · +4.4% YoY. Source: county tax records.
Cash-flow waterfall
monthlySold comps — $/sqft
last 12 mo · ≤1 miLoading sold comps…