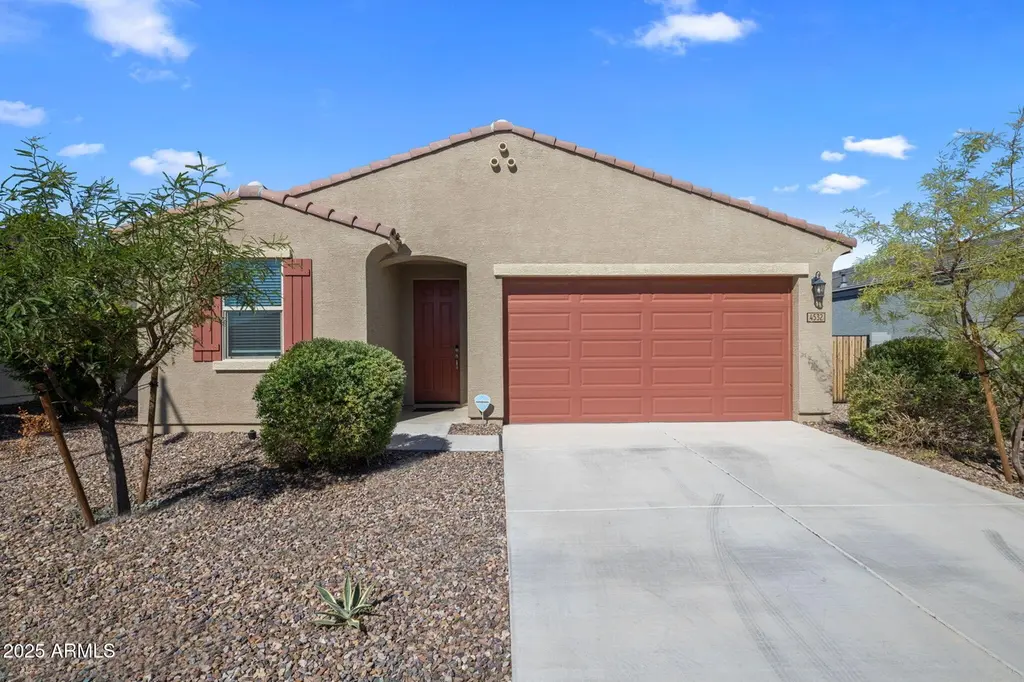
4532 W Sweetbush Way · San Tan Valley, AZ
Flood risk 1/10 · Minimal
- FEMA flood zone
- X (unshaded)
- Chance of flooding over 30 yrs
- 0.0%
- Est. flood insurance / yr
- $507 – $1,088
Fire risk 3/10 · Minor
- Est. fire insurance / yr
- $610 – $1,132
Heat risk 9/10 · Severe
- Hot days now (above 111°F)
- 7 days/yr
- Hot days in 30 yrs
- 20 days/yr
Wind risk 1/10 · Minimal
- Chance of severe wind over 30 yrs
- —
Air-quality risk 2/10 · Minimal
- Unhealthy air days now
- 1 days/yr
- Unhealthy air days in 30 yrs
- 1 days/yr
Risk factors via First Street. Map © Google.
Why this score? — see what drove the D- grade
The composite is a weighted blend of 9 inputs, each scored 0–100. Each bar is that input's sub-score; the figure is the points it added to the 100-point composite (weight × sub-score).
- ARV discount +12.0/15.0
- Appreciation +10.0/10.0
- Cash flow +6.2/30.0
- Livability +2.7/5.0
- Rent growth +2.5/5.0
- Condition / age +2.5/5.0
- Schools +1.8/10.0
- DSCR +0.5/10.0
- 1% rule +0.4/10.0
$379,900
🖨 Deal sheet (PDF) 📄 Offer letter ✓ Due diligence
Listing remarks MLS
Wonderful energy-efficient recently constructed home with front and back yard mountain views. You'll love the beautiful chef's kitchen with built-in oven and gas stovetop burners, staggered cabinets with crown molding, granite counters, farmhouse sink, all stainless appliances, breakfast bar, and well-placed pantry. Open floorplan connects kitchen and great room for entertaining, and your back yard is professionally landscaped with green easy to maintain turf and hardscape pavers. Your spacious 2-car garage provides room for storage and has a soft water loop. Neighborhood parks, playgrounds, and walking paths provide opportunities for outdoor activity, and you're conveniently close to downtown Queen Creek with its abundant shopping and restaurants. Welcome home!
Key facts
- Staggered cabinets
- Gas stovetop burners
- Crown molding
Tags
Neighborhood map
What this means for you Summary
Snapshot
- This is a 3-bed/2.0-bath single-family listed at $380k.
Deal economics
- At list price, monthly cash flow is $-700 ($-8k/yr) — negative.
- To cash-flow at today's rent, offer at most $256k (32.6% below list).
- To meet the 1% rule (rent ≥ 1% of price), the offer needs to be $206k (45.7% below list).
- Recommended offer: $206k (45.7% below list) — sets the bar for 1% rule.
- Cap rate 4.1% vs local median 3.2% in San Tan Valley — meaningfully above typical; check what's discounted (condition, days-on-market, listing class) to confirm the premium yield is real.
Location & tenants
- Location reads 54/100 on livability (#282 in AZ) — a working-class tenant base; expect higher turnover. Strengths: housing A+, employment B+; Watch: crime D+, schools D, amenities F.
- Florence Unified School District (4437) (rural): math 16% / reading 24% proficiency, ranked #178 of 249 in AZ (top 72%) — low school quality limits family demand, transient renter base, plan for 1-2y turnover.
- Market conditions: 488 active listings in the ZIP; 40 comparable units currently listed for rent nearby; rentals at typical pace (median 25d on market — plan ~3-4 weeks tenant-placement turnaround); 42% of comp listings sitting > 30 days — soft ceiling on asking rent; 9,504 units permitted in Pinal County in 2024 (776 in 5+ unit buildings).
Forward outlook
- In year one you build about $41k of equity ($3k loan paydown + $38k appreciation (10.0% local appreciation)).
- By year 2, paydown + projected appreciation supports a ~$65k cash-out refi (75% LTV) — recoverable capital for the next deal without selling this one.
Negotiation context
- It's been on market 246 days — a 12% lower offer ($334k) is reasonable based on typical stale-listing flexibility.
- 3 sale attempts with the ask held roughly flat each time — persistent listings suggest the price (not the market) is what's stuck; bring a comps-based counter.
Risks & watch-outs
- Climate carrying-cost: extreme-heat days projected 7→20/yr by 2055 (HVAC capex compounding) — expect insurance premiums to compound above CPI over the hold.
Questions for the listing agent
- What do current leases actually rent for vs. the listed asking? Can we see a recent rent roll and the last 12 months of T-12 income?
- It's been on market 246 days. Have you received any prior offers? Is the seller open to a 46% concession, seller financing, or rate buy-down credit?
- What does the HOA fee cover, when was the last increase, and are there any pending special assessments or reserve-fund shortfalls?
- Why hasn't it sold? Are there any deal-killer items the seller is aware of (foundation, flood, title, zoning, code violations)?
- Is there a deadline driving the sale (1031 exchange, divorce, estate, relocation)? That informs how much negotiation room exists.
- Schools are D-rated, which usually means shorter tenancies and higher turnover. Who's the typical renter profile here, and what's been the actual vacancy rate?
- Crime grade is D in this area — have there been break-ins, vandalism, or insurance claims at this property in the last 3 years? What carrier currently insures it and at what premium?
- The area grade is low — what's the realistic commute time and amenity access for the typical tenant pool here? Any planned neighborhood developments (good or bad) we should know about?
- What's the average days-on-market for RENTAL listings here right now (not sales)? A rising rental-DOM trend means longer vacancies and softer asking-rent achievability than the comps imply.
- What's the recent tenant-quality profile in this submarket — average credit score on applications, eviction rate, late-payment / NSF rate, and stable-employment percentage? A property-management company in the area should have these aggregated.
- How much new for-sale + rental construction is in the pipeline within 1–3 miles? Heavy new supply typically softens prices + rents 12–24 months out; constrained supply supports both.
Investment metrics
- 1% rule
- 0.54% ✗
- Cap rate
- 4.08%
- Cash-on-cash
- -7.90%
- DSCR
- 0.65
- GRM
- 15.4
CMA / ARV
- ARV (median comp)
- $421,618
- List price
- $379,900
- Delta
- -9.89%
- Verdict
- FAIR
- Comps
- 20 within 1.0 mi
Show comp detail 12 sales within ~0.75 mi
| Address | Dist | Beds/Ba | Sqft | Sold | Price | $/sf | Match |
|---|---|---|---|---|---|---|---|
| 4041 W Copperleaf Dr | 0.32mi | 3/2.0 | 1,615 (+3%) | 3mo | $374,900 | $232 | 78 |
| 3830 W Santa Cruz Ave | 0.47mi | 3/2.0 | 1,506 (-4%) | 2mo | $338,000 | $224 | 70 |
| 4418 W Kirkland Ave | 0.51mi | 2/2.0 (-1) | 1,571 (+0%) | 1mo | $390,000 | $248 | 70 |
| 3728 W Carlos Ln | 0.55mi | 3/2.0 | 1,504 (-4%) | 0mo | $329,000 | $219 | 67 |
| 3823 W Dancer Ln | 0.46mi | 4/2.0 (+1) | 1,521 (-3%) | 2mo | $339,000 | $223 | 67 |
| 4528 W Crescent Rd | 0.66mi | 3/2.0 | 1,536 (-2%) | 1mo | $350,000 | $228 | 66 |
| 4447 W Mountain Laural Dr | 0.34mi | 3/2.0 | 1,735 (+11%) | 0mo | $395,000 | $228 | 65 |
| 4366 W White Canyon Rd | 0.72mi | 3/2.0 | 1,536 (-2%) | 0mo | $362,000 | $236 | 63 |
| 4589 W Horsenettle Dr | 0.30mi | 4/2.0 (+1) | 1,754 (+12%) | 2mo | $377,500 | $215 | 59 |
| 4547 W Foldwing Dr | 0.44mi | 3/2.0 | 1,784 (+14%) | 2mo | $379,000 | $212 | 54 |
| 4169 W Erik Ln | 0.68mi | 3/2.0 | 1,424 (-9%) | 1mo | $414,990 | $291 | 53 |
| 33025 N Mildred Ln | 0.73mi | 3/2.5 | 1,759 (+12%) | 2mo | $325,000 | $185 | 42 |
Match score weights: distance 35% · size 25% · config 20% · recency 20%. Top-matched comps best support the ARV.
Projected returns pro-forma
10.0% appreciation · 3.0% rent growth · sell at horizon
- IRR
- 18.7%
- Equity multiple
- 2.52×
- Total profit
- $162,138
- Equity at exit
- $342,244
- IRR
- 17.3%
- Equity multiple
- 5.82×
- Total profit
- $512,253
- Equity at exit
- $738,062
Cash invested: $106,372 (down + closing). Projections, not guarantees.
Landlord ↔ Tenant lean methodology
- Overall (STATE)
- 87 Strongly Landlord-Friendly
- State Arizona
- 87 Strongly Landlord-Friendly · R+3
- County
- — inherits STATE
- City
- — inherits STATE
ZIP-level market 85144
- Home prices YoY
- 7.2%
- Active inventory
- 488
- Price-to-rent
- 15.4×
Monthly cashflow live
- Estimated rent
- $2,061 high interval (Pro) →
- Mortgage (P&I)
- −$1,992
- Tax from tax record
- −$116 /mo · $1,395/yr
- Insurance
- −$158
- HOA
- −$62
- Vacancy / Maint / Mgmt
- −$433
- Net cashflow
- $-700
Break-even live
Sensitivity live
| Price | -10% $-485 | -5% $-593 | +0% $-700 | +5% $-808 | +10% $-916 |
|---|---|---|---|---|---|
| Rent | -10% $-863 | -5% $-782 | +0% $-700 | +5% $-619 | +10% $-538 |
| Rate | -1.0pp $-509 | -0.5pp $-604 | base $-700 | +0.5pp $-799 | +1.0pp $-899 |
UW: 25.0% down · 7.5% · 30yr · 1.5% tax · 5.0% vac · 8.0% maint · 8.0% mgmt
Financing live
Cash to close
- Down payment
- $94,975
- Closing costs
- $11,397
- Reserves months
- —
- Total cash needed
- —
Loan-product check · same deal, 3 products live
Conventional
25% down · 7.5% · 30yr
- Down + closing
- —
- Monthly P&I
- —
- Monthly cashflow
- —
- DSCR
- —
- Eligible?
- —
Personal DTI + credit; lowest rate.
DSCR
20% down · 8.5% · 30yr
- Down + closing
- —
- Monthly P&I
- —
- Monthly cashflow
- —
- DSCR
- —
- Eligible?
- —
No personal income docs; deal must DSCR.
Hard money
10% down · 12.0% · 12mo
- Down + closing
- —
- Monthly P&I
- —
- Monthly cashflow
- —
- DSCR
- —
- Eligible?
- —
Short-term bridge; refi at stabilization.
Rent comps 40 comps
| Address | Beds | Baths | Sqft | Rent | $/sqft | DOM | Units | Dist |
|---|---|---|---|---|---|---|---|---|
| 4504 W Stonecrop Dr San Tan Valley, AZ | 4.0 | 2.0 | 1810 | $2,075 | $1.15 | 6d | 1 | 0.09mi |
| 33948 N Beeblossom Trl San Tan Valley, AZ | 3.0 | 2.0 | 1348 | $1,850 | $1.37 | 17d | 1 | 0.19mi |
| 4590 W Foldwing DR Queen Creek, AZ | 4.0 | 2.0 | 1806 | $2,449 | $1.36 | 3d | 1 | 0.41mi |
| 3877 W Naomi Ln San Tan Valley, AZ | 4.0 | 2.5 | 2010 | $1,850 | $0.92 | 6d | 1 | 0.43mi |
| 33810 N Mercedes Dr San Tan Valley, AZ | 4.0 | 2.0 | 1504 | $1,925 | $1.28 | 44d | 1 | 0.48mi |
| 3854 W Carlos Ln San Tan Valley, AZ | 3.0 | 2.0 | 1527 | $1,825 | $1.20 | 6d | 1 | 0.50mi |
| 3792 W Santa Cruz Ave San Tan Valley, AZ | 4.0 | 2.0 | 1852 | $1,795 | $0.97 | 44d | 1 | 0.51mi |
| 3809 W Five Mile Peak Dr San Tan Valley, AZ | 3.0 | 2.0 | 1343 | $1,895 | $1.41 | 6d | 1 | 0.60mi |
| 3569 W Morgan Ln San Tan Valley, AZ | 4.0 | 2.0 | 1700 | $1,550 | $0.91 | 25d | 1 | 0.62mi |
| 33889 N Barbara Dr San Tan Valley, AZ | 4.0 | 2.0 | 1868 | $1,975 | $1.06 | 6d | 1 | 0.65mi |
| 3541 Dreamy Draw Dr Queen Creek, AZ | 4.0 | 2.5 | 1918 | $2,700 | $1.41 | 25d | 1 | 0.70mi |
| 35032 N Barrel Rd San Tan Valley, AZ | 3.0 | 2.5 | 2213 | $3,900 | $1.76 | 2d | 1 | 0.70mi |
| 4165 W Monika Ln San Tan Valley, AZ | 4.0 | 3.0 | 2049 | $2,450 | $1.20 | 44d | 1 | 0.71mi |
| 33993 N Danja Dr San Tan Valley, AZ | 3.0 | 2.0 | 1998 | $2,450 | $1.23 | 44d | 1 | 0.73mi |
| 3439 W Oil Well Rd San Tan Valley, AZ | 3.0 | 2.0 | 1595 | $2,500 | $1.57 | 44d | 1 | 0.76mi |
| 4287 W Jeanette Ln San Tan Valley, AZ | 4.0 | 3.0 | 2049 | $2,450 | $1.20 | 19d | 1 | 0.84mi |
| 4265 W Janie St San Tan Valley, AZ | 4.0 | 2.0 | 1838 | $2,100 | $1.14 | 25d | 1 | 0.90mi |
| 3194 W Yellow Peak Dr San Tan Valley, AZ | 4.0 | 2.0 | 1925 | $1,908 | $0.99 | 44d | 1 | 0.90mi |
| 35623 N Seedling St San Tan Valley, AZ | 4.0 | 2.0 | 1832 | $2,000 | $1.09 | 11d | 1 | 0.91mi |
| 35623 N Seedling St San Tan Valley, AZ | 4.0 | 2.0 | 1838 | $2,450 | $1.33 | 44d | 1 | 0.91mi |
| 3102 W Belle Ave San Tan Valley, AZ | 4.0 | 2.0 | 1909 | $1,900 | $1.00 | 13d | 1 | 0.92mi |
| 3102 W Belle Ave San Tan Valley, AZ | 4.0 | 2.0 | 1909 | $1,900 | $1.00 | 16d | 1 | 0.92mi |
| 3560 W Mesquite Ave San Tan Valley, AZ | 3.0 | 2.0 | 1453 | $1,750 | $1.20 | 12d | 1 | 0.92mi |
| 3849 W South Butte Rd San Tan Valley, AZ | 4.0 | 2.0 | 1884 | $1,846 | $0.98 | 44d | 1 | 0.93mi |
| 3047 W Dancer Ln San Tan Valley, AZ | 3.0 | 2.0 | 1454 | $1,915 | $1.32 | 44d | 1 | 0.95mi |
| 2993 W Dancer Ln San Tan Valley, AZ | 3.0 | 2.0 | 1290 | $1,700 | $1.32 | 44d | 1 | 0.98mi |
| 33024 N Madison Way Dr San Tan Valley, AZ | 3.0 | 2.0 | 1500 | $1,700 | $1.13 | 16d | 1 | 1.01mi |
| 4332 W Hannah St San Tan Valley, AZ | 4.0 | 2.0 | 2150 | $2,450 | $1.14 | 44d | 1 | 1.02mi |
| 33897 N Wash View Rd San Tan Valley, AZ | 3.0 | 2.0 | 1721 | $1,980 | $1.15 | 3d | 1 | 1.02mi |
| 3162 W Sunshine Butte Dr San Tan Valley, AZ | 4.0 | 2.0 | 1600 | $1,850 | $1.16 | 22d | 1 | 1.06mi |
| 33856 N Cherry Creek Rd San Tan Valley, AZ | 3.0 | 2.0 | 1928 | $1,850 | $0.96 | 44d | 1 | 1.07mi |
| 2828 Patagonia Ct Queen Creek, AZ | 3.0 | 2.5 | 2230 | $2,500 | $1.12 | 44d | 1 | 1.07mi |
| 2924 W Allens Peak Dr San Tan Valley, AZ | 3.0 | 2.0 | 1765 | $1,955 | $1.11 | 11d | 1 | 1.14mi |
| 2924 W Allens Peak Dr San Tan Valley, AZ | 3.0 | 2.0 | 1765 | $1,880 | $1.07 | 3d | 1 | 1.14mi |
| 2822 W Blue River Dr San Tan Valley, AZ | 3.0 | 2.0 | 1609 | $2,395 | $1.49 | 44d | 1 | 1.18mi |
| 2574 W Sawtooth Way San Tan Valley, AZ | 3.0 | 2.0 | 1326 | $1,995 | $1.50 | 44d | 1 | 1.24mi |
| 2699 W Camp River Rd San Tan Valley, AZ | 3.0 | 2.0 | 1766 | $1,975 | $1.12 | 44d | 1 | 1.25mi |
| 2899 W White Canyon Rd San Tan Valley, AZ | 3.0 | 2.0 | 1981 | $1,950 | $0.98 | 3d | 1 | 1.31mi |
| 34437 N Picket Post Dr San Tan Valley, AZ | 4.0 | 3.0 | 1507 | $1,650 | $1.09 | 44d | 1 | 1.35mi |
| 2460 W Tanner Ranch Rd San Tan Valley, AZ | 4.0 | 2.0 | 1520 | $1,980 | $1.30 | 2d | 1 | 1.48mi |
HOA detail
- Monthly dues
- $62 · $744/yr
- Likely covers
- watergaslandscaping
Listing history 30 events
-
2026-06-21days on market $379,900 Active 246 DOM
-
2026-06-18days on market $379,900 Active 243 DOM
-
2026-06-17days on market $379,900 Active 242 DOM
-
2026-06-16days on market $379,900 Active 241 DOM
-
2026-06-15days on market $379,900 Active 240 DOM
-
2026-06-13days on market $379,900 Active 238 DOM
-
2026-06-13days on market $379,900 Active 237 DOM
-
2026-06-09days on market $379,900 Active 234 DOM
-
2026-06-08days on market $379,900 Active 233 DOM
-
2026-06-07days on market $379,900 Active 232 DOM
-
2026-06-04days on market $379,900 Active 229 DOM
-
2026-06-03days on market $379,900 Active 228 DOM
-
2026-06-02days on market $379,900 Active 227 DOM
-
2026-06-01days on market $379,900 Active 226 DOM
-
2026-05-31days on market $379,900 Active 225 DOM
-
2025-10-18$379,900 Active 772-char remark
Show marketing remark (772 chars)
Wonderful energy-efficient recently constructed home with front and back yard mountain views. You'll love the beautiful chef's kitchen with built-in oven and gas stovetop burners, staggered cabinets with crown molding, granite counters, farmhouse sink, all stainless appliances, breakfast bar, and well-placed pantry. Open floorplan connects kitchen and great room for entertaining, and your back yard is professionally landscaped with green easy to maintain turf and hardscape pavers. Your spacious 2-car garage provides room for storage and has a soft water loop. Neighborhood parks, playgrounds, and walking paths provide opportunities for outdoor activity, and you're conveniently close to downtown Queen Creek with its abundant shopping and restaurants. Welcome home!
-
2025-10-06historical
-
2025-10-01price $381,499
-
2025-10-01price $399,000
-
2025-09-26price $381,499
-
2025-09-24price $382,900
-
2025-09-23price $385,000
-
2025-09-16price $382,000
-
2025-09-16status Active
-
2025-09-12historical
-
2025-09-03price $382,900
-
2025-09-03price $385,000
-
2025-09-01price $382,900
-
2025-08-31price $387,000
-
2025-08-18$382,900 Active
ⓘ Source: listings_history table (triggers on properties + properties_extension) + one-shot
backfill from property_details.listing_events for pre-trigger history.
Tax reassessment forecast AZ · Resets to sale price
- Current annual tax
- $1,395 · $116/mo
- Projected year-2 tax
- $2,507 · $209/mo
- Expected delta
- +$1,113/yr (+$93/mo · 79.8%)
ⓘ Screening estimate from a state-policy table — verify with the county assessor before closing.
Climate risk First Street
- Flood 1/10 Low FEMA zone X (unshaded) · 0% chance over 30 yrs
- Wildfire 3/10 Moderate
- Heat 9/10 Extreme 7 d/yr ≥111°F today · 20 d/yr by 30 yrs out
- Wind 1/10 Low
- Air quality 2/10 Low 1 unhealthy d/yr today · 1 by 30 yrs out
Nearby sold comps map
Loading sold comps map…
Walkable amenities ~0.75 mi
Loading nearby amenities…
Taxation est. · year 1
- Rental income
- $24,733
- − Mortgage interest
- −$21,280
- − Property taxes
- −$1,395
- − Insurance
- −$1,900
- − Repairs & maintenance
- −$1,979
- − Management
- −$1,979
- − HOA
- −$744
- − Depreciation
- −$11,052
- Taxable loss
- −$15,594
- Est. tax savings @ 24.0%
- +$3,743
- After-tax cash flow
- $-4,663/yr
For passive investors: Depreciation is non-cash, so a rental often shows a tax loss while cash-flowing — sheltering income. Rental losses are passive: they offset passive income freely, and up to $25,000/yr can offset ordinary (W-2) income if you actively participate and your MAGI is under $100k (phasing out to $0 by $150k); unused losses carry forward. On sale, claimed depreciation is recaptured at up to 25%, and gains may owe capital-gains tax (a 1031 exchange can defer both). Figures are a year-1 estimate at your 24.0% rate — not tax advice; consult a CPA.
Schools (NCES district)
- District
- Florence Unified School District (4437)
- NCES district ID
- 0402920
- Math proficiency
- 16% ▼ -11.00%
- Reading proficiency
- 24% ▼ -7.00%
- Median HH income
- $54,426
- Composite
- 18.31/100
- National rank
- #8950
- State rank
- #178 of 249 in AZ
Livability — San Tan Valley
- Score
- 54/100
- State rank
- #282
- US rank
- #24192
Category grades
Schools grade is shown separately in the Schools card above.
Census & demographics
- Census place
- San Tan Valley, AZ
Population outlook (Pinal County) Hauer SSP2
- Today (2025)
- 437,574 people
- By 2030
- 446,903 · +2.1%
- By 2040
- 452,589 · +3.4%
- By 2050
- 444,126 · +1.5%
- By 2075
- 430,300 · -1.7%
- By 2100
- 393,536 · -10.1%
Not yet ingested
- Political lean
- —
- Race & ethnicity
- —
- Common origin
- —
- Civics
- —
Market trends
- HPI YoY
- ▲ 24.94%
- Current HPI
- 372.52
- Rent YoY
- —
- Metro
- —
- State GDP YoY
- ▲ 4.54%
- F500 in state
- 20
Industry mix (Fortune 500 HQ in AZ)
| Industry | F500 HQs | Revenue |
|---|---|---|
| Technology | 2 | $13B |
|
||
| Mining / Metals | 1 | $23B |
|
||
| Environmental Services | 1 | $16B |
|
||
| Metals / Steel | 1 | $14B |
|
||
| Technology Distribution | 1 | $9B |
|
||
| Homebuilding | 1 | $8B |
|
||
Price history
-0.8% since first listed15 events — show timeline
- 2025-10-18 Listed $379,900 ARMLS
- 2025-10-06 Listing Removed — ARMLS
- 2025-10-01 Price Changed $381,499 ARMLS
- 2025-10-01 Price Changed $399,000 ARMLS
- 2025-09-26 Price Changed $381,499 ARMLS
- 2025-09-24 Price Changed $382,900 ARMLS
- 2025-09-23 Price Changed $385,000 ARMLS
- 2025-09-16 Price Changed $382,000 ARMLS
- 2025-09-16 Relisted — ARMLS
- 2025-09-12 Listing Removed — ARMLS
- 2025-09-03 Price Changed $382,900 ARMLS
- 2025-09-03 Price Changed $385,000 ARMLS
- 2025-09-01 Price Changed $382,900 ARMLS
- 2025-08-31 Price Changed $387,000 ARMLS
- 2025-08-18 Listed $382,900 ARMLS
Property tax history
+94.1%/yrLatest (2025): $1,395 · +2.0% YoY. Source: county tax records.
Cash-flow waterfall
monthlySold comps — $/sqft
last 12 mo · ≤1 miLoading sold comps…