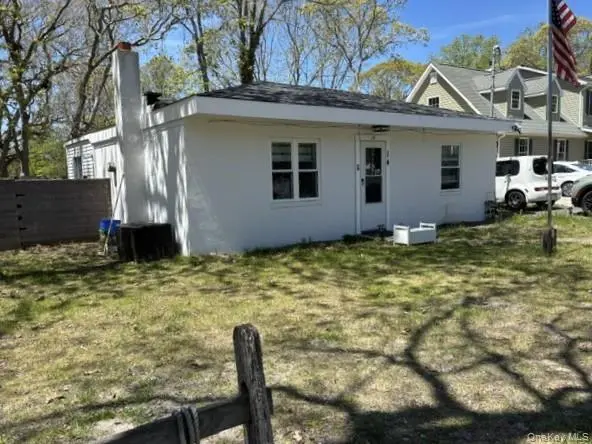
14 Coolidge Rd · Hampton Bays, NY
Flood risk 1/10 · Minimal
- FEMA flood zone
- X (unshaded)
- Chance of flooding over 30 yrs
- 0.0%
- Est. flood insurance / yr
- $507 – $1,088
Fire risk 1/10 · Minimal
- Est. fire insurance / yr
- $691 – $1,283
Heat risk 4/10 · Minor
- Hot days now (above 90°F)
- 7 days/yr
- Hot days in 30 yrs
- 20 days/yr
Wind risk 8/10 · Major
- Chance of severe wind over 30 yrs
- 80.0%
Air-quality risk 3/10 · Minor
- Unhealthy air days now
- 2 days/yr
- Unhealthy air days in 30 yrs
- 3 days/yr
Risk factors via First Street. Map © Google.
Why this score? — see what drove the B grade
The composite is a weighted blend of 9 inputs, each scored 0–100. Each bar is that input's sub-score; the figure is the points it added to the 100-point composite (weight × sub-score).
- Cash flow +30.0/30.0
- DSCR +10.0/10.0
- ARV discount +9.6/15.0
- 1% rule +8.8/10.0
- Rent growth +5.0/5.0
- Schools +4.0/10.0
- Livability +3.4/5.0
- Condition / age +2.5/5.0
- Appreciation +0.0/10.0
$599,000
🖨 Deal sheet (PDF) 📄 Offer letter ✓ Due diligence
Listing remarks
Welcome to your Hamptons Getaway, this lovely 2 Bedroom 1 Bath Ranch is located South of the Highway in a quiet area that is close to all that Hampton Bays has to offer. This home is just minutes away from the Ocean Beaches.
Key facts
- 6,060 sq ft lot
- Built 1956
- Listed 31 days
Property features AI
Exterior
- Parking: Driveway
- Utilities: Cesspool sewer; Cable connected; Electricity connected; Water connected
- Home design: Single family residence
- Construction: Block construction; Concrete perimeter foundation
- Exterior features: Block construction; Not waterfront
Interior
- Kitchen: Dishwasher; Gas oven; Range; Refrigerator; Stainless steel appliances
- Bedrooms: Total rooms: 4
- Flooring: Laminate
- Bathrooms: 1 full bathroom
- Heating & cooling: Hot water heating; Propane heating; No central cooling
- Interior features: First-floor bedroom; First-floor full bathroom; Eat-in kitchen; Tray ceilings; Washer/dryer hookup inside
- Laundry & utility: Washer (included); Washer hookup inside
Neighborhood map
What this means for you Summary
Snapshot
- This is a 2-bed/1.0-bath single-family listed at $599k.
Deal economics
- At list price, monthly cash flow is $3k ($35k/yr) — positive.
- The deal already cash-flows at list — no discount required.
- Meets the 1% rule at list price ($8k rent vs $599k).
- Recommended offer: $581k (3.0% below list) — sets the bar for market timing.
- Cap rate 12.1% vs local median 6.4% in Hampton Bays — top-decile yield for the area; either an underpriced asset or a hidden risk that comps aren't pricing in. Stress-test before assuming the spread holds.
Location & tenants
- Location reads 68/100 on livability (#551 in NY) — a middle-class / working-renter tenant base. Strengths: crime A+, employment A+, health & safety B+; Watch: amenities F, commute F, cost of living F.
- Hampton Bays Union Free School District (suburban): math 45% / reading 44% proficiency, ranked #434 of 590 in NY (top 74%) — families likely to look elsewhere, expect single-tenant / working-renter base with shorter leases.
- Zoned schools: Hampton Bays Elementary School (math 32% / reading 52%, grade F, #1,361 of 2,108 statewide, top 67%, 682 students, 55% FRL); Hampton Bays Middle School (math 25% / reading 38%, grade F, #522 of 729 statewide, top 73%, 597 students, 64% FRL); Hampton Bays High School (math 98% / reading 57%, grade A-, #580 of 1,100 statewide, top 53%, 769 students, 53% FRL) — zoned schools average 58% FRL vs 38% district-wide (20 pts higher); higher-poverty schools than district average — tighter screening recommended.
- Market conditions: Rents rising fast (+16.1%/yr); 174 active listings in the ZIP; 3 comparable units currently listed for rent nearby; rentals leasing fast (median 9d on market — plan ~1-2 weeks tenant-placement turnaround); high-income renter base; 1,366 units permitted in Suffolk County in 2024 (216 in 5+ unit buildings).
- At $8,279/mo this rent would consume 74% of the median local household income ($134k/yr) (locally 199% of renters already pay >50% of income on rent) — very limited rent-growth headroom before tenants either downsize or default.
Forward outlook
- Local home prices are declining (-3.0%/yr); year-one equity from $4k of loan paydown is wiped out by about $18k of value loss. Plan a longer hold.
- Suffolk County population projected to shrink 5% by 2050 — rents likely to lag national; underwrite the cash flow, not the appreciation.
- At projected returns (-3.0% appreciation + 8.0% rent growth), your $168k cash investment doubles in ~5 years — after that, you're playing with house money.
Negotiation context
- It's been on market 32 days — a 3% lower offer ($581k) is reasonable based on typical stale-listing flexibility.
- Current owner paid $283k; list at $599k implies a 111% gain — meaningful room to come down on a strong offer.
Risks & watch-outs
- Watch-outs: built in 1956 — expect roof / HVAC / electrical / plumbing capex.
- Climate carrying-cost: severe wind risk, 80% chance of damaging wind over 30y — expect insurance premiums to compound above CPI over the hold.
Questions for the listing agent
- It's been on market 32 days. Have you received any prior offers? Is the seller open to a 3% concession, seller financing, or rate buy-down credit?
- Built in 1956 — when were the roof, HVAC, electrical panel, plumbing, and water heater last replaced?
- Is there a deadline driving the sale (1031 exchange, divorce, estate, relocation)? That informs how much negotiation room exists.
- Schools are B-rated — typically a magnet for longer-tenancy family renters. What's the average tenant stay here, and is there a school-zone premium baked into asking?
- What's the average days-on-market for RENTAL listings here right now (not sales)? A rising rental-DOM trend means longer vacancies and softer asking-rent achievability than the comps imply.
- What's the recent tenant-quality profile in this submarket — average credit score on applications, eviction rate, late-payment / NSF rate, and stable-employment percentage? A property-management company in the area should have these aggregated.
- How much new for-sale + rental construction is in the pipeline within 1–3 miles? Heavy new supply typically softens prices + rents 12–24 months out; constrained supply supports both.
Investment metrics
- 1% rule
- 1.38% ✓
- Cap rate
- 12.05%
- Cash-on-cash
- 20.57%
- DSCR
- 1.92
- GRM
- 6.0
CMA / ARV
- ARV (on-the-fly)
- $628,712
- Comps found
- 3
Show comp detail 3 sales within ~0.75 mi
| Address | Dist | Beds/Ba | Sqft | Sold | Price | $/sf | Match |
|---|---|---|---|---|---|---|---|
| 207 Springville Rd | 0.10mi | 2/1.0 | 774 (+7%) | 14mo | $675,000 | $872 | 72 |
| 11 Shell Rd | 0.72mi | 2/1.0 | 648 (-10%) | 1mo | $680,000 | $1,049 | 49 |
| 119 Ponquogue Ave | 0.58mi | 2/1.0 | 824 (+14%) | 24mo | $480,000 | $583 | 30 |
Match score weights: distance 35% · size 25% · config 20% · recency 20%. Top-matched comps best support the ARV.
Projected returns pro-forma
-3.0% appreciation · 8.0% rent growth · sell at horizon
- IRR
- 18.1%
- Equity multiple
- 1.77×
- Total profit
- $129,675
- Equity at exit
- $89,313
- IRR
- 29.6%
- Equity multiple
- 4.26×
- Total profit
- $547,216
- Equity at exit
- $51,791
Cash invested: $167,720 (down + closing). Projections, not guarantees.
Landlord ↔ Tenant lean methodology
- Overall (STATE)
- 15 Strongly Tenant-Friendly
- State New York
- 15 Strongly Tenant-Friendly · D+10
- County
- — inherits STATE
- City
- — inherits STATE
ZIP-level market 11946
- Home prices YoY
- -20.3%
- Rents YoY
- 16.1%
- Active inventory
- 174
- Price-to-rent
- 6.0×
Monthly cashflow live
- Estimated rent
- $8,279 medium interval (Pro) →
- Mortgage (P&I)
- −$3,141
- Tax from tax record
- −$274 /mo · $3,287/yr
- Insurance
- −$250
- HOA
- −$0
- Lot rent
- −$0
- Vacancy / Maint / Mgmt
- −$1,739
- Net cashflow
- $2,876
Break-even live
Sensitivity live
| Price | -10% $3,215 | -5% $3,045 | +0% $2,876 | +5% $2,706 | +10% $2,537 |
|---|---|---|---|---|---|
| Rent | -10% $2,222 | -5% $2,549 | +0% $2,876 | +5% $3,203 | +10% $3,530 |
| Rate | -1.0pp $3,177 | -0.5pp $3,028 | base $2,876 | +0.5pp $2,720 | +1.0pp $2,563 |
UW: 25.0% down · 7.5% · 30yr · 1.5% tax · 5.0% vac · 8.0% maint · 8.0% mgmt
Financing live
Cash to close
- Down payment
- $149,750
- Closing costs
- $17,970
- Reserves months
- —
- Total cash needed
- —
Loan-product check · same deal, 3 products live
Conventional
25% down · 7.5% · 30yr
- Down + closing
- —
- Monthly P&I
- —
- Monthly cashflow
- —
- DSCR
- —
- Eligible?
- —
Personal DTI + credit; lowest rate.
DSCR
20% down · 8.5% · 30yr
- Down + closing
- —
- Monthly P&I
- —
- Monthly cashflow
- —
- DSCR
- —
- Eligible?
- —
No personal income docs; deal must DSCR.
Hard money
10% down · 12.0% · 12mo
- Down + closing
- —
- Monthly P&I
- —
- Monthly cashflow
- —
- DSCR
- —
- Eligible?
- —
Short-term bridge; refi at stabilization.
Rent comps 3 comps
| Address | Beds | Baths | Sqft | Rent | $/sqft | DOM | Units | Dist |
|---|---|---|---|---|---|---|---|---|
| 164 W Montauk Hwy Hampton Bays, NY | 1.0–2.0 | 1.0–1.5 | 610 | $4,195 | $6.88 | 46d | 1 | 1.28mi |
| 129 Lamplight Cir Hampton Bays, NY | 1.0 | 1.0 | 734 | $3,245 | $4.42 | 2d | 11 | 1.30mi |
| 49 Fanning Ave Hampton Bays, NY | 1.0 | 1.0 | 500 | $12,000 | $24.00 | 9d | 1 | 1.33mi |
Listing history 23 events
-
2026-06-22days on market $599,000 Active 32 DOM
-
2026-06-21days on market $599,000 Active 31 DOM
-
2026-06-18days on market $599,000 Active 28 DOM
-
2026-06-17days on market $599,000 Active 27 DOM
-
2026-06-16days on market $599,000 Active 26 DOM
-
2026-06-15days on market $599,000 Active 25 DOM
-
2026-06-13days on market $599,000 Active 23 DOM
-
2026-06-13days on market $599,000 Active 22 DOM
-
2026-06-09days on market $599,000 Active 19 DOM
-
2026-06-08days on market $599,000 Active 18 DOM
-
2026-06-07days on market $599,000 Active 17 DOM
-
2026-06-04days on market $599,000 Active 14 DOM
-
2026-06-03days on market $599,000 Active 13 DOM
-
2026-06-02days on market $599,000 Active 12 DOM
-
2026-06-01days on market $599,000 Active 11 DOM
-
2026-05-31days on market $599,000 Active 10 DOM
-
2026-05-22$599,000 Active
-
2026-05-20price $599,000
-
2026-05-19historical $699,000
-
2004-06-29soldstatus $283,250
-
2001-01-05soldstatus $99,500
-
1996-06-13soldstatus $57,500
-
1988-07-19soldstatus $100,000
ⓘ Source: listings_history table (triggers on properties + properties_extension) + one-shot
backfill from property_details.listing_events for pre-trigger history.
Tax reassessment forecast NY · Partial reset (capped growth)
- Current annual tax
- $3,287 · $274/mo
- Projected year-2 tax
- $6,705 · $559/mo
- Expected delta
- +$3,418/yr (+$285/mo · 104.0%)
ⓘ Screening estimate from a state-policy table — verify with the county assessor before closing.
Climate risk First Street
- Flood 1/10 Low FEMA zone X (unshaded) · 0% chance over 30 yrs
- Wildfire 1/10 Low
- Heat 4/10 Moderate 7 d/yr ≥90°F today · 20 d/yr by 30 yrs out
- Wind 8/10 Severe 80% chance of damaging wind over 30 yrs
- Air quality 3/10 Moderate 2 unhealthy d/yr today · 3 by 30 yrs out
Nearby sold comps map
Loading sold comps map…
Walkable amenities ~0.75 mi
Loading nearby amenities…
Taxation est. · year 1
- Rental income
- $99,348
- − Mortgage interest
- −$33,553
- − Property taxes
- −$3,287
- − Insurance
- −$2,995
- − Repairs & maintenance
- −$7,948
- − Management
- −$7,948
- − Depreciation
- −$17,425
- Taxable income
- $26,191
- Est. tax owed @ 24.0%
- −$6,286
- After-tax cash flow
- $28,222/yr
For passive investors: Depreciation is non-cash, so a rental often shows a tax loss while cash-flowing — sheltering income. Rental losses are passive: they offset passive income freely, and up to $25,000/yr can offset ordinary (W-2) income if you actively participate and your MAGI is under $100k (phasing out to $0 by $150k); unused losses carry forward. On sale, claimed depreciation is recaptured at up to 25%, and gains may owe capital-gains tax (a 1031 exchange can defer both). Figures are a year-1 estimate at your 24.0% rate — not tax advice; consult a CPA.
Schools (NCES district)
- District
- Hampton Bays Union Free School District
- NCES district ID
- 3613530
- Math proficiency
- 45% ▼ -8.00%
- Reading proficiency
- 44% ▼ -1.00%
- Median HH income
- $70,274
- Composite
- 40.18/100
- National rank
- #3788
- State rank
- #434 of 590 in NY
Livability — Hampton Bays
- Score
- 68/100
- State rank
- #551
- US rank
- #9894
Category grades
Schools grade is shown separately in the Schools card above.
Census & demographics
- Census place
- Hampton Bays, NY
- County
- Suffolk County · 679,920 people
- City population
- 15,819
- Metro
- New York-Newark-Jersey City, NY-NJ-PA
- Population (ZIP)
- 15,819
- Household income
- $133,918
- Rent vs Own
- Severe rent burden
- 199.0
Population outlook (Suffolk County) Hauer SSP2
- Today (2025)
- 1,505,262 people
- By 2030
- 1,498,318 · -0.5%
- By 2040
- 1,471,101 · -2.3%
- By 2050
- 1,424,848 · -5.3%
- By 2075
- 1,337,157 · -11.2%
- By 2100
- 1,217,720 · -19.1%
Race, ethnicity, and origin ACS 2023
- Neighborhood character
- Majority White (62%)
- Race & ethnicity
- White 62% Hispanic / Latino 32% Two or more races 13% Asian 3% Black 2%
- Hispanic origin (detail)
- Mexican 6%
- Common ancestry
- Romanian 4% Slovak 2% Portuguese 2%
- Foreign-born
- 26% · Canada, Jamaica, Guatemala
- Languages at home
- 64% English-only · Spanish 29% Other Indo-European 2% French/Haitian/Cajun 2%
Political lean MEDSL · Suffolk
- 2024 margin
- Lean R (+10.0) · D 45.0% · R 55.0%
- 2008→2024 swing
- -16.0pp toward R · 2008: 6.0pp · 2024: -10.0pp
- All cycles
- 2024: R+10.0 2020: R+0.0 2016: R+8.2 2012: D+2.9 2008: D+6.0
Not yet ingested
- Civics
- —
Market trends
- HPI YoY
- ▼ -118.82%
- Current HPI
- 467.2466
- Rent YoY
- ▲ 16.07%
- Metro
- New York-Newark-Jersey City, NY-NJ-PA
- State GDP YoY
- ▲ 2.60%
- F500 in state
- 92
Industry mix (Fortune 500 HQ in NY)
| Industry | F500 HQs | Revenue |
|---|---|---|
| Financial Services | 10 | $950B |
|
||
| Consumer Goods | 9 | $162B |
|
||
| Insurance | 4 | $225B |
|
||
| Telecommunications | 2 | $144B |
|
||
| Pharmaceuticals | 2 | $112B |
|
||
| Media / Entertainment | 2 | $69B |
|
||
Price history
+499.0% since first listed7 events — show timeline
- 2026-05-22 Listed $599,000 OneKey® MLS as Distributed by MLS Grid
- 2026-05-20 Price Changed $599,000 OneKey® MLS as Distributed by MLS Grid
- 2026-05-19 Coming Soon $699,000 OneKey® MLS as Distributed by MLS Grid
- 2004-06-29 Sold (Public Records) $283,250 Public Records
- 2001-01-05 Sold (Public Records) $99,500 Public Records
- 1996-06-13 Sold (Public Records) $57,500 Public Records
- 1988-07-19 Sold (Public Records) $100,000 Public Records
Property tax history
+0.0%/yrLatest (2024): $3,287 · +0.0% YoY. Source: county tax records.
Cash-flow waterfall
monthlySold comps — $/sqft
last 12 mo · ≤1 miLoading sold comps…