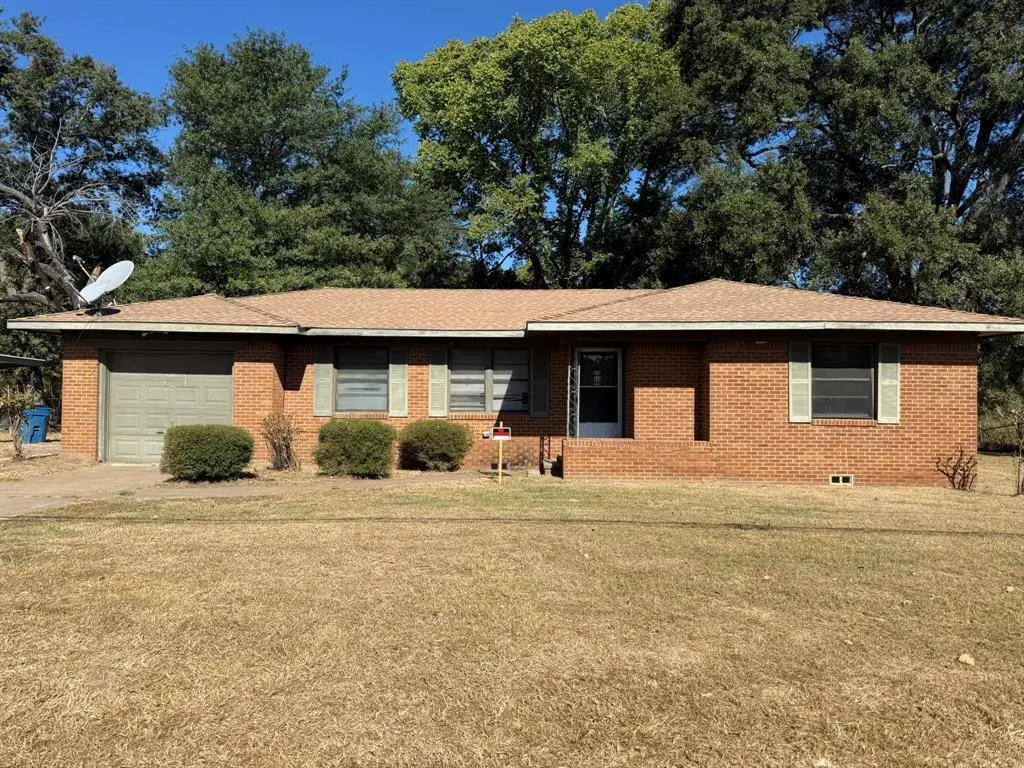
1206 - 1208 W Royall Blvd · Malakoff, TX
Flood risk No data
- FEMA flood zone
- —
- Chance of flooding over 30 yrs
- —
- Est. flood insurance / yr
- —
Fire risk No data
- Est. fire insurance / yr
- —
Heat risk No data
- Hot days now (above threshold)
- —
- Hot days in 30 yrs
- —
Wind risk No data
- Chance of severe wind over 30 yrs
- —
Air-quality risk No data
- Unhealthy air days now
- —
- Unhealthy air days in 30 yrs
- —
Risk factors via First Street. Map © Google.
Why this score? — see what drove the C- grade
The composite is a weighted blend of 9 inputs, each scored 0–100. Each bar is that input's sub-score; the figure is the points it added to the 100-point composite (weight × sub-score).
- Cash flow +16.8/30.0
- ARV discount +15.0/15.0
- DSCR +5.2/10.0
- 1% rule +4.7/10.0
- Schools +4.3/10.0
- Livability +3.2/5.0
- Rent growth +2.5/5.0
- Condition / age +2.5/5.0
- Appreciation +0.0/10.0
$129,000
🖨 Deal sheet 📄 Offer letter ✓ Due diligence
Listing remarks MLS
Charming brick home located at 1206 W Royall Street in Malakoff, Texas. This 3-bedroom, 1-bath residence was built in 1971 and offers solid construction with timeless appeal. The property includes an additional lot, providing extra space and flexibility for outdoor living, expansion, or investment potential. A carport offers covered parking and convenience. Situated in an established neighborhood, this home presents a great opportunity for homeowners or investors seeking space, value, and location in Malakoff.
Key facts
- 0.99 acre lot
- 2 parking spots
- Built 1971
Neighborhood map
What this means for you Summary
Snapshot
- This is a 3-bed/1.0-bath single-family listed at $129k.
Deal economics
- At list price, monthly cash flow is $83 ($997/yr) — positive.
- The deal already cash-flows at list — no discount required.
- To meet the 1% rule (rent ≥ 1% of price), the offer needs to be $126k (2.6% below list).
- Recommended offer: $114k (12.0% below list) — sets the bar for market timing.
Location & tenants
- Location reads 63/100 on livability (#884 in TX) — a middle-class / working-renter tenant base. Strengths: cost of living A+, housing A+, crime B+; Watch: amenities F, commute F, employment F.
- Malakoff ISD (town): math 48% / reading 54% proficiency, ranked #187 of 826 in TX (top 23%) — acceptable for families but not a draw, mixed tenant base, ~2y average lease; 61% free/reduced lunch — lower-income household profile, screen leases tightly.
- Market conditions: 225 active listings in the ZIP; 4 comparable units currently listed for rent nearby; rentals lingering (median 44d on market — plan ~5-8 weeks vacancy on turnover, expect pricing pressure); 100% of comp listings sitting > 30 days — soft ceiling on asking rent; 263 units permitted in Henderson County in 2024 (0 in 5+ unit buildings).
Forward outlook
- Local home prices are declining (-3.0%/yr); year-one equity from $892 of loan paydown is wiped out by about $4k of value loss. Plan a longer hold.
Negotiation context
- It's been on market 162 days — a 12% lower offer ($114k) is reasonable based on typical stale-listing flexibility.
- 3 sale attempts; this cycle's ask has dropped $51k (28%) from the opening price — seller is motivated, your offer sets the floor, not the list.
Questions for the listing agent
- It's been on market 162 days. Have you received any prior offers? Is the seller open to a 12% concession, seller financing, or rate buy-down credit?
- Built in 1971 — when were the roof, HVAC, electrical panel, plumbing, and water heater last replaced?
- Why hasn't it sold? Are there any deal-killer items the seller is aware of (foundation, flood, title, zoning, code violations)?
- Is there a deadline driving the sale (1031 exchange, divorce, estate, relocation)? That informs how much negotiation room exists.
- What's the average days-on-market for RENTAL listings here right now (not sales)? A rising rental-DOM trend means longer vacancies and softer asking-rent achievability than the comps imply.
- What's the recent tenant-quality profile in this submarket — average credit score on applications, eviction rate, late-payment / NSF rate, and stable-employment percentage? A property-management company in the area should have these aggregated.
- How much new for-sale + rental construction is in the pipeline within 1–3 miles? Heavy new supply typically softens prices + rents 12–24 months out; constrained supply supports both.
Investment metrics
- 1% rule
- 0.97% ✗
- Cap rate
- 7.07%
- Cash-on-cash
- 2.76%
- DSCR
- 1.12
- GRM
- 8.6
CMA / ARV
- ARV (median comp)
- $166,142
- List price
- $129,000
- Delta
- -22.36%
- Verdict
- UNDERPRICED
- Comps
- 6 within 1.0 mi
Projected returns pro-forma
-3.0% appreciation · 3.0% rent growth · sell at horizon
- IRR
- -11.9%
- Equity multiple
- 0.57×
- Total profit
- $-15,580
- Equity at exit
- $19,234
- IRR
- -2.7%
- Equity multiple
- 0.82×
- Total profit
- $-6,630
- Equity at exit
- $11,154
Cash invested: $36,120 (down + closing). Projections, not guarantees.
Landlord ↔ Tenant lean methodology
- Overall (STATE)
- 87 Strongly Landlord-Friendly
- State Texas
- 87 Strongly Landlord-Friendly · R+5
- County
- — inherits STATE
- City
- — inherits STATE
ZIP-level market 75148
- Home prices YoY
- -27.6%
- Active inventory
- 225
- Price-to-rent
- 8.6×
Monthly cashflow live
- Estimated rent
- $1,256 medium interval (Pro) →
- Mortgage (P&I)
- −$676
- Tax from tax record
- −$179 /mo · $2,147/yr
- Insurance
- −$54
- HOA
- −$0
- Vacancy / Maint / Mgmt
- −$264
- Net cashflow
- $83
Break-even live
UW: 25.0% down · 7.5% · 30yr · 1.5% tax · 5.0% vac · 8.0% maint · 8.0% mgmt
Financing live
Cash to close
- Down payment
- $32,250
- Closing costs
- $3,870
- Reserves months
- —
- Total cash needed
- —
Loan-product check · same deal, 3 products live
Conventional
25% down · 7.5% · 30yr
- Down + closing
- —
- Monthly P&I
- —
- Monthly cashflow
- —
- DSCR
- —
- Eligible?
- —
Personal DTI + credit; lowest rate.
DSCR
20% down · 8.5% · 30yr
- Down + closing
- —
- Monthly P&I
- —
- Monthly cashflow
- —
- DSCR
- —
- Eligible?
- —
No personal income docs; deal must DSCR.
Hard money
10% down · 12.0% · 12mo
- Down + closing
- —
- Monthly P&I
- —
- Monthly cashflow
- —
- DSCR
- —
- Eligible?
- —
Short-term bridge; refi at stabilization.
Rent comps 4 comps
| Address | Beds | Baths | Sqft | Rent | $/sqft | DOM | Units | Dist |
|---|---|---|---|---|---|---|---|---|
| 216 Creekview Ln Malakoff, TX | 2.0 | 1.0 | 1000 | $1,300 | $1.30 | 43d | 1 | 0.21mi |
| 405 E Pine St Malakoff, TX | 3.0 | 1.0 | 1200 | $1,465 | $1.22 | 43d | 1 | 0.90mi |
| 200 E Mitcham St Malakoff, TX | 2.0 | 1.0 | 730 | $1,020 | $1.40 | 43d | 1 | 1.00mi |
| 200 Sunset Unit 102 Malakoff, TX | 2.0 | 1.0 | 780 | $849 | $1.09 | 43d | 1 | 1.26mi |
Listing history 23 events
-
2026-06-19days on market $129,000 Active 162 DOM
-
2026-06-18days on market $129,000 Active 161 DOM
-
2026-06-17days on market $129,000 Active 160 DOM
-
2026-06-16days on market $129,000 Active 159 DOM
-
2026-06-15days on market $129,000 Active 158 DOM
-
2026-06-14days on market $129,000 Active 156 DOM
-
2026-06-12days on market $129,000 Active 155 DOM
-
2026-06-09days on market $129,000 Active 152 DOM
-
2026-06-08days on market $129,000 Active 151 DOM
-
2026-06-07days on market $129,000 Active 150 DOM
-
2026-06-02days on market $129,000 Active 145 DOM
-
2026-06-01days on market $129,000 Active 144 DOM
-
2026-05-31days on market $129,000 Active 143 DOM
-
2026-05-30days on market $129,000 Active 142 DOM
-
2026-05-14price $129,000 515-char remark
Show marketing remark (515 chars)
Charming brick home located at 1206 W Royall Street in Malakoff, Texas. This 3-bedroom, 1-bath residence was built in 1971 and offers solid construction with timeless appeal. The property includes an additional lot, providing extra space and flexibility for outdoor living, expansion, or investment potential. A carport offers covered parking and convenience. Situated in an established neighborhood, this home presents a great opportunity for homeowners or investors seeking space, value, and location in Malakoff.
-
2026-02-05price $149,000 515-char remark
Show marketing remark (515 chars)
Charming brick home located at 1206 W Royall Street in Malakoff, Texas. This 3-bedroom, 1-bath residence was built in 1971 and offers solid construction with timeless appeal. The property includes an additional lot, providing extra space and flexibility for outdoor living, expansion, or investment potential. A carport offers covered parking and convenience. Situated in an established neighborhood, this home presents a great opportunity for homeowners or investors seeking space, value, and location in Malakoff.
-
2026-01-05$179,999 Active 515-char remark
Show marketing remark (515 chars)
Charming brick home located at 1206 W Royall Street in Malakoff, Texas. This 3-bedroom, 1-bath residence was built in 1971 and offers solid construction with timeless appeal. The property includes an additional lot, providing extra space and flexibility for outdoor living, expansion, or investment potential. A carport offers covered parking and convenience. Situated in an established neighborhood, this home presents a great opportunity for homeowners or investors seeking space, value, and location in Malakoff.
-
2025-12-31historical
-
2025-11-10status Active
-
2025-11-08price $199,000
-
2025-10-22$206,000 Active
-
2007-06-12soldstatus
-
2003-05-05soldstatus
ⓘ Source: listings_history table (triggers on properties + properties_extension) + one-shot
backfill from property_details.listing_events for pre-trigger history.
Tax reassessment forecast TX · Resets to sale price
- Current annual tax
- $2,147 · $179/mo
- Projected year-2 tax
- $2,361 · $197/mo
- Expected delta
- +$214/yr (+$18/mo · 10.0%)
ⓘ Screening estimate from a state-policy table — verify with the county assessor before closing.
Nearby sold comps map
Loading sold comps map…
Walkable amenities ~0.75 mi
Loading nearby amenities…
Taxation est. · year 1
- Rental income
- $15,072
- − Mortgage interest
- −$7,226
- − Property taxes
- −$2,147
- − Insurance
- −$645
- − Repairs & maintenance
- −$1,206
- − Management
- −$1,206
- − Depreciation
- −$3,753
- Taxable loss
- −$1,110
- Est. tax savings @ 24.0%
- +$266
- After-tax cash flow
- $1,264/yr
For passive investors: Depreciation is non-cash, so a rental often shows a tax loss while cash-flowing — sheltering income. Rental losses are passive: they offset passive income freely, and up to $25,000/yr can offset ordinary (W-2) income if you actively participate and your MAGI is under $100k (phasing out to $0 by $150k); unused losses carry forward. On sale, claimed depreciation is recaptured at up to 25%, and gains may owe capital-gains tax (a 1031 exchange can defer both). Figures are a year-1 estimate at your 24.0% rate — not tax advice; consult a CPA.
Schools (NCES district)
- District
- Malakoff ISD
- NCES district ID
- 4828780
- Math proficiency
- 48% ▼ -14.00%
- Reading proficiency
- 54% ▼ -5.00%
- Median HH income
- $38,970
- Composite
- 42.54/100
- National rank
- #3200
- State rank
- #187 of 826 in TX
Livability — Malakoff
- Score
- 63/100
- State rank
- #884
- US rank
- #15919
Category grades
Schools grade is shown separately in the Schools card above.
Census & demographics
- Census place
- Malakoff, TX
- Population (ZIP)
- 5,944
Population outlook (Henderson County) Hauer SSP2
- Today (2025)
- 80,471 people
- By 2030
- 80,608 · +0.2%
- By 2040
- 80,087 · -0.5%
- By 2050
- 78,208 · -2.8%
- By 2075
- 72,423 · -10.0%
- By 2100
- 61,012 · -24.2%
Race, ethnicity, and origin ACS 2023
- Neighborhood character
- Predominantly White (71%)
- Race & ethnicity
- White 71% Two or more races 11% Hispanic / Latino 11% Black 11%
- Hispanic origin (detail)
- Mexican 10%
- Common ancestry
- Russian 2% Slovak 2% Italian 1%
- Foreign-born
- 5% · Canada
- Languages at home
- 92% English-only · Spanish 8%
Political lean MEDSL · Henderson
- 2024 margin
- Solid R (+63.5) · D 18.0% · R 81.4%
- 2008→2024 swing
- -18.8pp toward R · 2008: -44.6pp · 2024: -63.5pp
- All cycles
- 2024: R+63.5 2020: R+60.2 2016: R+60.0 2012: R+54.8 2008: R+44.6
Not yet ingested
- Civics
- —
Market trends
- HPI YoY
- ▼ -82.76%
- Current HPI
- 217.1629
- Rent YoY
- —
- Metro
- —
- State GDP YoY
- ▲ 3.95%
- F500 in state
- 110
Industry mix (Fortune 500 HQ in TX)
| Industry | F500 HQs | Revenue |
|---|---|---|
| Energy | 16 | $1,198B |
|
||
| Technology | 5 | $198B |
|
||
| Engineering / Construction | 4 | $72B |
|
||
| Energy Services | 3 | $60B |
|
||
| Utilities | 3 | $41B |
|
||
| Healthcare | 2 | $330B |
|
||
Price history
-37.4% since first listed9 events — show timeline
- 2026-05-14 Price Changed $129,000 NTREIS
- 2026-02-05 Price Changed $149,000 NTREIS
- 2026-01-05 Listed $179,999 NTREIS
- 2025-12-31 Listing Removed — NTREIS
- 2025-11-10 Relisted — NTREIS
- 2025-11-08 Price Changed $199,000 NTREIS
- 2025-10-22 Listed $206,000 NTREIS
- 2007-06-12 Sold (Public Records) — Public Records
- 2003-05-05 Sold (Public Records) — Public Records
Property tax history
+5.8%/yrLatest (2025): $2,147 · +10.1% YoY. Source: county tax records.
Cash-flow waterfall
monthlySold comps — $/sqft
last 12 mo · ≤1 miLoading sold comps…