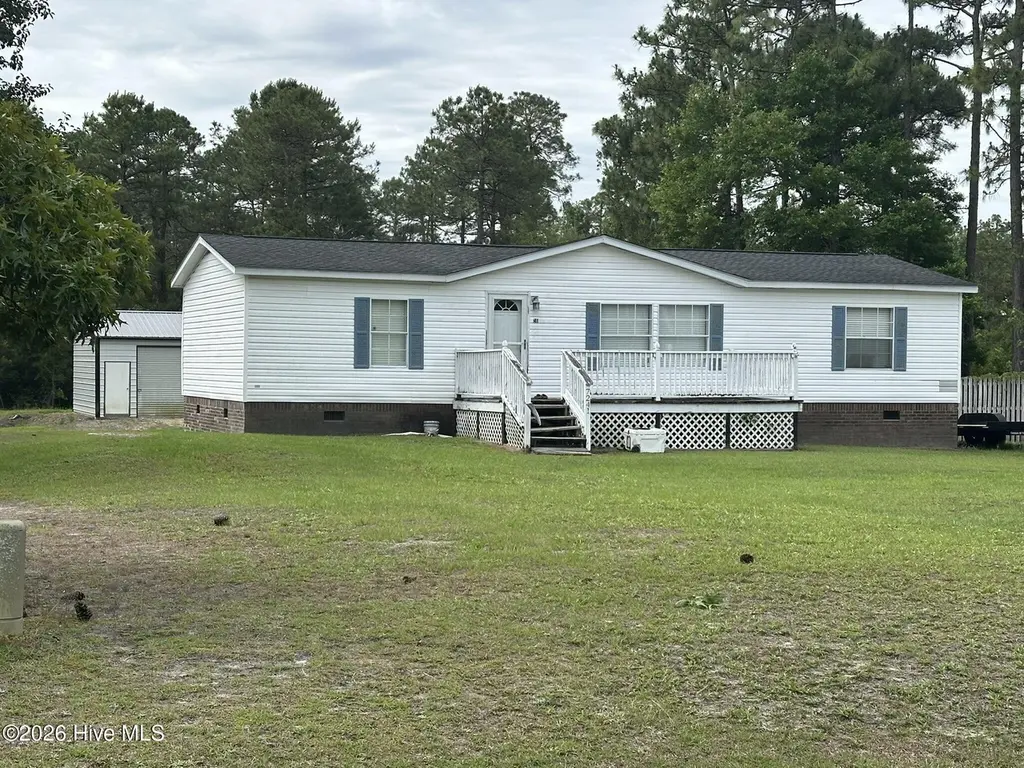
7241 Hunters Ridge Dr · Leland, NC
Flood risk 1/10 · Minimal
- FEMA flood zone
- A
- Chance of flooding over 30 yrs
- 0.0%
- Est. flood insurance / yr
- $1,009 – $1,996
Fire risk 7/10 · Major
- Est. fire insurance / yr
- $906 – $1,684
Heat risk 9/10 · Severe
- Hot days now (above 105°F)
- 7 days/yr
- Hot days in 30 yrs
- 18 days/yr
Wind risk 8/10 · Major
- Chance of severe wind over 30 yrs
- 99.0%
Air-quality risk 1/10 · Minimal
- Unhealthy air days now
- 0 days/yr
- Unhealthy air days in 30 yrs
- 0 days/yr
Risk factors via First Street. Map © Google.
Why this score? — see what drove the B+ grade
The composite is a weighted blend of 9 inputs, each scored 0–100. Each bar is that input's sub-score; the figure is the points it added to the 100-point composite (weight × sub-score).
- Cash flow +30.0/30.0
- ARV discount +15.0/15.0
- DSCR +10.0/10.0
- 1% rule +8.1/10.0
- Schools +3.9/10.0
- Livability +3.4/5.0
- Rent growth +2.8/5.0
- Condition / age +2.5/5.0
- Appreciation +0.0/10.0
$179,900
🖨 Deal sheet (PDF) 📄 Offer letter ✓ Due diligence
Listing remarks MLS
3 bedroom, 2 bath home on over half acre in quiet, Leland community. Features include custom built-ins in the Living Room, low maintenance laminate floors, ceramic tile, 2 large decks, and much, much more. This is a potential short sale and will require 3rd party approval.
Key facts
- Split floorplan
- Over half acre
- 2 rollup doors
Tags
Property features AI
Finance
- Other: Zoning: CO-RR
Exterior
- Parking: Detached garage; 2 garage spaces; 2 parking spaces total
- Utilities: Public or standard utilities (water/sewer/power not specified)
- Home design: Manufactured home; One story; Entry level: 1
- Construction: Vinyl siding and frame construction; See remarks for additional construction details; Permanent foundation; Shingle roof; Built as a manufactured home
- Exterior features: Deck; Has a view; Paved road access
Interior
- Kitchen: Dishwasher
- Bathrooms: 2 full bathrooms
- Heating & cooling: Heat pump heating; Electric heating; Heat pump cooling
- Interior features: Dishwasher; No basement; Total of 6 rooms
Neighborhood map
What this means for you Summary
Snapshot
- This is a 3-bed/2.0-bath manufactured listed at $180k.
Deal economics
- At list price, monthly cash flow is $670 ($8k/yr) — positive.
- The deal already cash-flows at list — no discount required.
- Meets the 1% rule at list price ($2k rent vs $180k).
- Recommended offer: $177k (1.5% below list) — sets the bar for market timing.
- Cap rate 11.6% vs local median 3.2% in Leland — top-decile yield for the area; either an underpriced asset or a hidden risk that comps aren't pricing in. Stress-test before assuming the spread holds.
Location & tenants
- Location reads 68/100 on livability (#177 in NC) — a middle-class / working-renter tenant base. Strengths: crime A+, housing A+, employment A; Watch: health & safety D, amenities F, commute F.
- Brunswick County Schools (rural): math 45% / reading 47% proficiency, ranked #82 of 178 in NC (top 46%) — families likely to look elsewhere, expect single-tenant / working-renter base with shorter leases.
- Zoned schools: Town Creek Elementary (math 50% / reading 53%, grade C-, #392 of 1,410 statewide, top 28%, 654 students, 100% FRL); Town Creek Middle (math 35% / reading 43%, grade F, #238 of 475 statewide, top 51%, 500 students, 99% FRL); North Brunswick High (math 57% / reading 49%, grade C-, #281 of 535 statewide, top 53%, 1,450 students, 100% FRL) — zoned schools average 100% FRL vs 53% district-wide (46 pts higher); higher-poverty schools than district average — tighter screening recommended.
- Market conditions: Rents rising (+1.2%/yr); 1224 active listings in the ZIP; 4 comparable units currently listed for rent nearby; rentals at typical pace (median 25d on market — plan ~3-4 weeks tenant-placement turnaround); solid renter incomes; 6,112 units permitted in Brunswick County in 2024 (990 in 5+ unit buildings).
Forward outlook
- Local home prices are declining (-3.0%/yr); year-one equity from $1k of loan paydown is wiped out by about $5k of value loss. Plan a longer hold.
- Brunswick County population projected at +36% by 2050 — long-run rental-demand tailwind backs the buy-and-hold thesis.
- At projected returns (-3.0% appreciation + 1.2% rent growth), your $50k cash investment doubles in ~9 years — after that, you're playing with house money.
Negotiation context
- It's been on market 16 days — a 2% lower offer ($177k) is reasonable based on typical stale-listing flexibility.
- 3 sale attempts since 20y ago; this cycle's ask has dropped $10k (5%) from the opening price — seller is motivated, your offer sets the floor, not the list.
- Current owner paid $53k; list at $180k implies a 239% gain — meaningful room to come down on a strong offer.
Risks & watch-outs
- Watch-outs: flood insurance adds $125/mo.
- Climate carrying-cost: in FEMA flood zone A (mandatory federal flood insurance); severe wind risk, 99% chance of damaging wind over 30y; major wildfire risk; extreme-heat days projected 7→18/yr by 2055 (HVAC capex compounding) — expect insurance premiums to compound above CPI over the hold.
Questions for the listing agent
- What's the actual annual flood-insurance premium (NFIP or private), and is the property in a SFHA with mandatory coverage?
- Is there a deadline driving the sale (1031 exchange, divorce, estate, relocation)? That informs how much negotiation room exists.
- What's the average days-on-market for RENTAL listings here right now (not sales)? A rising rental-DOM trend means longer vacancies and softer asking-rent achievability than the comps imply.
- What's the recent tenant-quality profile in this submarket — average credit score on applications, eviction rate, late-payment / NSF rate, and stable-employment percentage? A property-management company in the area should have these aggregated.
- How much new for-sale + rental construction is in the pipeline within 1–3 miles? Heavy new supply typically softens prices + rents 12–24 months out; constrained supply supports both.
Investment metrics
- 1% rule
- 1.31% ✓
- Cap rate
- 11.59%
- Cash-on-cash
- 18.94%
- DSCR
- 1.84
- GRM
- 6.4
CMA / ARV
- ARV (on-the-fly)
- $258,048
- Comps found
- 2
Show comp detail 2 sales within ~0.75 mi
| Address | Dist | Beds/Ba | Sqft | Sold | Price | $/sf | Match |
|---|---|---|---|---|---|---|---|
| 7188 Hunters Ridge Dr NE | 0.11mi | 3/2.0 | 1,296 (-4%) | 12mo | $210,000 | $162 | 79 |
| 519 Maco Rd NE | 0.24mi | 3/2.0 | 1,184 (-12%) | 5mo | $227,000 | $192 | 65 |
Match score weights: distance 35% · size 25% · config 20% · recency 20%. Top-matched comps best support the ARV.
Projected returns pro-forma
-3.0% appreciation · 1.24% rent growth · sell at horizon
- IRR
- 4.9%
- Equity multiple
- 1.19×
- Total profit
- $9,403
- Equity at exit
- $26,824
- IRR
- 12.7%
- Equity multiple
- 1.93×
- Total profit
- $46,886
- Equity at exit
- $15,554
Cash invested: $50,372 (down + closing). Projections, not guarantees.
Landlord ↔ Tenant lean methodology
- Overall (STATE)
- 85 Strongly Landlord-Friendly
- State North Carolina
- 85 Strongly Landlord-Friendly · R+3
- County
- — inherits STATE
- City
- — inherits STATE
ZIP-level market 28451
- Rents YoY
- 1.2%
- Active inventory
- 1224
- Price-to-rent
- 6.4×
Monthly cashflow live
- Estimated rent
- $2,355 medium interval (Pro) →
- Mortgage (P&I)
- −$943
- Tax from tax record
- −$47 /mo · $568/yr
- Insurance
- −$75
- Flood insurance flood zone
- −$125 /mo · $1,502/yr
- HOA
- −$0
- Vacancy / Maint / Mgmt
- −$495
- Net cashflow
- $670
Break-even live
Sensitivity live
| Price | -10% $771 | -5% $721 | +0% $670 | +5% $619 | +10% $568 |
|---|---|---|---|---|---|
| Rent | -10% $484 | -5% $577 | +0% $670 | +5% $763 | +10% $856 |
| Rate | -1.0pp $760 | -0.5pp $715 | base $670 | +0.5pp $623 | +1.0pp $576 |
UW: 25.0% down · 7.5% · 30yr · 1.5% tax · 5.0% vac · 8.0% maint · 8.0% mgmt
Financing live
Cash to close
- Down payment
- $44,975
- Closing costs
- $5,397
- Reserves months
- —
- Total cash needed
- —
Loan-product check · same deal, 3 products live
Conventional
25% down · 7.5% · 30yr
- Down + closing
- —
- Monthly P&I
- —
- Monthly cashflow
- —
- DSCR
- —
- Eligible?
- —
Personal DTI + credit; lowest rate.
DSCR
20% down · 8.5% · 30yr
- Down + closing
- —
- Monthly P&I
- —
- Monthly cashflow
- —
- DSCR
- —
- Eligible?
- —
No personal income docs; deal must DSCR.
Hard money
10% down · 12.0% · 12mo
- Down + closing
- —
- Monthly P&I
- —
- Monthly cashflow
- —
- DSCR
- —
- Eligible?
- —
Short-term bridge; refi at stabilization.
Rent comps 4 comps
| Address | Beds | Baths | Sqft | Rent | $/sqft | DOM | Units | Dist |
|---|---|---|---|---|---|---|---|---|
| 3915 Starry Sky Rd Leland, NC | 3.0 | 2.0 | 1708 | $2,440 | $1.43 | 22d | 1 | 1.10mi |
| 3907 Starry Sky Rd Leland, NC | 3.0 | 2.0 | 1665 | $2,294 | $1.38 | 25d | 1 | 1.12mi |
| 9125 Sunrise Creek Dr Leland, NC | 4.0 | 2.5 | 1772 | $2,440 | $1.38 | 25d | 1 | 1.19mi |
| 3828 Starry Sky Rd Leland, NC | 4.0 | 2.5 | 1772 | $2,540 | $1.43 | 15d | 1 | 1.25mi |
Listing history 13 events
-
2026-06-22days on market $179,900 Active 16 DOM
-
2026-06-18days on market $179,900 Active 13 DOM
-
2026-06-17days on market $179,900 Active 12 DOM
-
2026-06-16remarks 319-char remark
-
2026-06-16days on market $179,900 Active 11 DOM
-
2026-06-15days on market $179,900 Active 10 DOM
-
2026-06-14days on market $179,900 Active 8 DOM
-
2026-06-13pricedays on market $179,900 Active 7 DOM
-
2026-06-10days on market $190,000 Active 5 DOM
-
2026-06-09days on market $190,000 Active 4 DOM
-
2026-06-08days on market $190,000 Active 3 DOM
-
2026-06-07remarks 264-char remark
-
2026-06-07$190,000 Active 2 DOM
ⓘ Source: listings_history table (triggers on properties + properties_extension) + one-shot
backfill from property_details.listing_events for pre-trigger history.
Tax reassessment forecast NC · Resets to sale price
- Current annual tax
- $568 · $47/mo
- Projected year-2 tax
- $1,475 · $123/mo
- Expected delta
- +$908/yr (+$76/mo · 159.9%)
ⓘ Screening estimate from a state-policy table — verify with the county assessor before closing.
Climate risk First Street
- Flood 1/10 Low FEMA zone A · 0% chance over 30 yrs
- Wildfire 7/10 Severe
- Heat 9/10 Extreme 7 d/yr ≥105°F today · 18 d/yr by 30 yrs out
- Wind 8/10 Severe 99% chance of damaging wind over 30 yrs
- Air quality 1/10 Low 0 unhealthy d/yr today · 0 by 30 yrs out
Nearby sold comps map
Loading sold comps map…
Walkable amenities ~0.75 mi
Loading nearby amenities…
Taxation est. · year 1
- Rental income
- $28,261
- − Mortgage interest
- −$10,077
- − Property taxes
- −$568
- − Insurance
- −$2,402
- − Repairs & maintenance
- −$2,261
- − Management
- −$2,261
- − Depreciation
- −$5,233
- Taxable income
- $5,459
- Est. tax owed @ 24.0%
- −$1,310
- After-tax cash flow
- $6,726/yr
For passive investors: Depreciation is non-cash, so a rental often shows a tax loss while cash-flowing — sheltering income. Rental losses are passive: they offset passive income freely, and up to $25,000/yr can offset ordinary (W-2) income if you actively participate and your MAGI is under $100k (phasing out to $0 by $150k); unused losses carry forward. On sale, claimed depreciation is recaptured at up to 25%, and gains may owe capital-gains tax (a 1031 exchange can defer both). Figures are a year-1 estimate at your 24.0% rate — not tax advice; consult a CPA.
Schools (NCES district)
- District
- Brunswick County Schools
- NCES district ID
- 3700420
- Math proficiency
- 45% ▲ 4.00%
- Reading proficiency
- 47% ▲ 4.00%
- Median HH income
- $47,494
- Composite
- 39.23/100
- National rank
- #4011
- State rank
- #82 of 178 in NC
Livability — Leland
- Score
- 68/100
- State rank
- #177
- US rank
- #9158
Category grades
Schools grade is shown separately in the Schools card above.
Census & demographics
- County
- Brunswick County · 131,536 people
- City population
- 46,933
- Metro
- Myrtle Beach-Conway-North Myrtle Beach, SC-NC
- Population (ZIP)
- 46,933
- Household income
- $81,481
- Rent vs Own
- Severe rent burden
- 1049.0
Population outlook (Brunswick County) Hauer SSP2
- Today (2025)
- 152,111 people
- By 2030
- 165,705 · +8.9%
- By 2040
- 188,494 · +23.9%
- By 2050
- 206,228 · +35.6%
- By 2075
- 237,876 · +56.4%
- By 2100
- 251,451 · +65.3%
Race, ethnicity, and origin ACS 2023
- Neighborhood character
- Predominantly White (71%)
- Race & ethnicity
- White 71% Black 12% Hispanic / Latino 11% Two or more races 8%
- Hispanic origin (detail)
- Mexican 7% Puerto Rican 1%
- Common ancestry
- Slovak 2% Lithuanian 2% Romanian 2%
- Foreign-born
- 5% · Canada
- Languages at home
- 91% English-only · Spanish 7% Other Indo-European 1%
Political lean MEDSL · Brunswick
- 2024 margin
- Strong R (+24.9) · D 37.2% · R 62.0%
- 2008→2024 swing
- -6.9pp toward R · 2008: -17.9pp · 2024: -24.9pp
- All cycles
- 2024: R+24.9 2020: R+25.0 2016: R+28.7 2012: R+22.2 2008: R+17.9
Not yet ingested
- Civics
- —
Market trends
- HPI YoY
- ▼ -99.99%
- Current HPI
- 148.6217
- Rent YoY
- ▲ 1.24%
- Metro
- Myrtle Beach-Conway-North Myrtle Beach, SC-NC
- State GDP YoY
- ▲ 3.28%
- F500 in state
- 26
Industry mix (Fortune 500 HQ in NC)
| Industry | F500 HQs | Revenue |
|---|---|---|
| Financial Services | 2 | $213B |
|
||
| Retail | 2 | $95B |
|
||
| Industrial Conglomerate | 1 | $38B |
|
||
| Metals / Steel | 1 | $35B |
|
||
| Utilities | 1 | $30B |
|
||
| Industrial Machinery | 1 | $19B |
|
||
Price history
+196.9% since first listed7 events — show timeline
- 2026-06-05 Listed $190,000 Hive MLS
- 2013-02-18 Sold (Public Records) $53,000 Public Records
- 2013-02-15 Sold (MLS) $53,000 Hive MLS
- 2012-09-08 Listed $62,000 Hive MLS
- 2006-09-14 Listing Removed — Hive MLS
- 2006-07-12 Listed $99,500 Hive MLS
- 2001-10-01 Sold (Public Records) $64,000 Public Records
Property tax history
+2.7%/yrLatest (2025): $568 · +5.4% YoY. Source: county tax records.
Cash-flow waterfall
monthlySold comps — $/sqft
last 12 mo · ≤1 miLoading sold comps…