27150 Shadel Rd #122 · Menifee, CA
Flood risk 1/10 · Minimal
- FEMA flood zone
- X (unshaded)
- Chance of flooding over 30 yrs
- 0.0%
- Est. flood insurance / yr
- $507 – $1,088
Fire risk 7/10 · Major
- Est. fire insurance / yr
- $659 – $1,223
Heat risk 7/10 · Major
- Hot days now (above 105°F)
- 6 days/yr
- Hot days in 30 yrs
- 16 days/yr
Wind risk 1/10 · Minimal
- Chance of severe wind over 30 yrs
- —
Air-quality risk 5/10 · Moderate
- Unhealthy air days now
- 9 days/yr
- Unhealthy air days in 30 yrs
- 11 days/yr
Risk factors via First Street. Map © Google.
Why this score? — see what drove the C+ grade
The composite is a weighted blend of 9 inputs, each scored 0–100. Each bar is that input's sub-score; the figure is the points it added to the 100-point composite (weight × sub-score).
- Cash flow +30.0/30.0
- 1% rule +10.0/10.0
- DSCR +10.0/10.0
- Schools +4.5/10.0
- Rent growth +4.0/5.0
- Livability +3.2/5.0
- Condition / age +2.5/5.0
- ARV discount +0.0/15.0
- Appreciation +0.0/10.0
$89,999
🖨 Deal sheet 📄 Offer letter ✓ Due diligence
Listing remarks
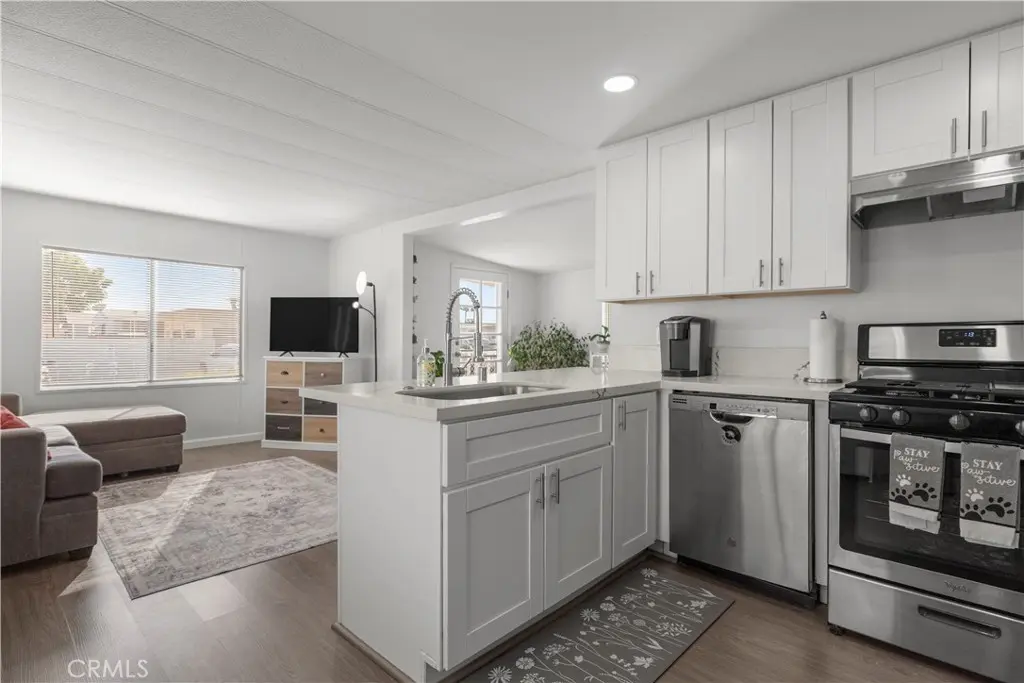
Welcome to this beautifully upgraded 2-bedroom, 1-bath home offering 1,040 square feet of thoughtfully designed living space in the desirable Bel Air Estates 55+ community. Combining modern updates with low-maintenance living, this home offers the perfect setting to enjoy comfort, convenience, and an active lifestyle. Inside, you’ll find an open and inviting floor plan that makes both everyday living and entertaining feel effortless. Hardwood laminate flooring flows throughout the home, creating a clean and cohesive feel from room to room. For year-round comfort, the living room and both bedrooms each feature their own mini-split system, allowing for efficient and personalized heating
Key facts
- Open floor plan
- Mini-split system
- Upgraded home
Tags
Property features AI
Finance
- Other: Lot features indicate 0-1 unit per acre; Elevation measured in feet
- Financial info: Monthly land lease fee
- HOA & community: Senior community; Manager approval required for residency; Pets: contact manager for details; Land lease applicable
Exterior
- Parking: 1 parking space; 1 carport space; Located in Bel Air Estates park
- Utilities: Public sewer; District / public water
- Home design: Single-unit mobile home (Freedom model); Single-story; Entry at main level; Has a view
- Construction: Mobile home dimensions approximately 12 ft wide by 40 ft long; Year built per public records
- Exterior features: Community pool; Dog park; Mountainous setting; Suburban neighborhood; One shed on the property; Mobile home remains on site
Interior
- Kitchen: Range with stove hood; Gas range; Gas oven; Dishwasher
- Bedrooms: Bedrooms located on the main level
- Bathrooms: 1 full bathroom
- Heating & cooling: Ductless heating; Ductless cooling
- Interior features: One-level home; All bedrooms on main level; Community spa
- Laundry & utility: Community laundry facilities
Neighborhood map
What this means for you Summary
Snapshot
- This is a 2-bed/2.0-bath manufactured listed at $90k.
Deal economics
- At list price, monthly cash flow is $1k ($15k/yr) — positive.
- The deal already cash-flows at list — no discount required.
- Meets the 1% rule at list price ($2k rent vs $90k).
- Recommended offer: $89k (1.5% below list) — sets the bar for market timing.
- Cap rate 22.7% vs local median 3.6% in Menifee — top-decile yield for the area; either an underpriced asset or a hidden risk that comps aren't pricing in. Stress-test before assuming the spread holds.
Location & tenants
- Location reads 64/100 on livability (#407 in CA) — a middle-class / working-renter tenant base. Strengths: housing A+, crime A, employment A-; Watch: schools D+, health & safety D+, amenities D.
- Menifee Union Elementary (suburban): math 43% / reading 56% proficiency, ranked #434 of 1,400 in CA (top 31%) — families likely to look elsewhere, expect single-tenant / working-renter base with shorter leases.
- Market conditions: Rents rising fast (+6.1%/yr); 197 active listings in the ZIP; 13 comparable units currently listed for rent nearby; rentals leasing fast (median 2d on market — plan ~1-2 weeks tenant-placement turnaround); 9,195 units permitted in Riverside County in 2024 (1,512 in 5+ unit buildings).
- At $2,344/mo this rent would consume 49% of the median local household income ($58k/yr) (locally 1163% of renters already pay >50% of income on rent) — very limited rent-growth headroom before tenants either downsize or default.
Forward outlook
- Local home prices are declining (-3.0%/yr); year-one equity from $622 of loan paydown is wiped out by about $3k of value loss. Plan a longer hold.
- Riverside County population projected at +22% by 2050 — long-run rental-demand tailwind backs the buy-and-hold thesis.
- At projected returns (-3.0% appreciation + 6.1% rent growth), your $25k cash investment doubles in ~2 years — after that, you're playing with house money.
Negotiation context
- It's been on market 28 days — a 2% lower offer ($89k) is reasonable based on typical stale-listing flexibility.
- 2 sale attempts with the ask held roughly flat each time — persistent listings suggest the price (not the market) is what's stuck; bring a comps-based counter.
Risks & watch-outs
- Climate carrying-cost: major wildfire risk; extreme-heat days projected 6→16/yr by 2055 (HVAC capex compounding) — expect insurance premiums to compound above CPI over the hold.
Questions for the listing agent
- Built in 1973 — when were the roof, HVAC, electrical panel, plumbing, and water heater last replaced?
- Is there a deadline driving the sale (1031 exchange, divorce, estate, relocation)? That informs how much negotiation room exists.
- Schools are D-rated, which usually means shorter tenancies and higher turnover. Who's the typical renter profile here, and what's been the actual vacancy rate?
- What's the average days-on-market for RENTAL listings here right now (not sales)? A rising rental-DOM trend means longer vacancies and softer asking-rent achievability than the comps imply.
- What's the recent tenant-quality profile in this submarket — average credit score on applications, eviction rate, late-payment / NSF rate, and stable-employment percentage? A property-management company in the area should have these aggregated.
- How much new for-sale + rental construction is in the pipeline within 1–3 miles? Heavy new supply typically softens prices + rents 12–24 months out; constrained supply supports both.
Investment metrics
- 1% rule
- 2.60% ✓
- Cap rate
- 22.69%
- Cash-on-cash
- 58.56%
- DSCR
- 3.61
- GRM
- 3.2
CMA / ARV
- ARV (on-the-fly)
- $69,680
- Comps found
- 9
Show comp detail 9 sales within ~0.75 mi
| Address | Dist | Beds/Ba | Sqft | Sold | Price | $/sf | Match |
|---|---|---|---|---|---|---|---|
| 27150 Shadel Rd #108 | 0.00mi | 2/2.0 | 1,080 (+4%) | 1mo | $72,500 | $67 | 93 |
| 27150 Shadel Rd #82 | 0.00mi | 2/2.0 | 1,120 (+8%) | 4mo | $75,000 | $67 | 84 |
| 27601 Sun City Blvd Spc 194 | 0.49mi | 2/2.0 | 1,040 (0%) | 14mo | $110,000 | $106 | 66 |
| 27150 Shadel Rd #75 | 0.19mi | 2/1.0 | 960 (-8%) | 14mo | $59,000 | $61 | 63 |
| 27150 Shadel Rd #37 | 0.19mi | 2/2.0 | 1,120 (+8%) | 20mo | $48,000 | $43 | 62 |
| 27601 Sun City Blvd #291 | 0.49mi | 2/2.0 | 1,060 (+2%) | 19mo | $110,000 | $104 | 58 |
| 27601 Sun City Blvd #143 | 0.50mi | 2/2.0 | 1,068 (+3%) | 18mo | $115,000 | $108 | 57 |
| 27601 Sun City Blvd #248 | 0.56mi | 2/2.0 | 1,080 (+4%) | 12mo | $70,000 | $65 | 57 |
| 27601 Sun City Blvd #37 | 0.49mi | 2/2.0 | 1,080 (+4%) | 16mo | $105,000 | $97 | 57 |
Match score weights: distance 35% · size 25% · config 20% · recency 20%. Top-matched comps best support the ARV.
Projected returns pro-forma
-3.0% appreciation · 6.1% rent growth · sell at horizon
- IRR
- 60.7%
- Equity multiple
- 3.83×
- Total profit
- $71,310
- Equity at exit
- $13,419
- IRR
- 66.4%
- Equity multiple
- 8.78×
- Total profit
- $196,055
- Equity at exit
- $7,781
Cash invested: $25,200 (down + closing). Projections, not guarantees.
Landlord ↔ Tenant lean methodology
- Overall (STATE)
- 18 Strongly Tenant-Friendly
- State California
- 18 Strongly Tenant-Friendly · D+13
- County
- — inherits STATE
- City
- — inherits STATE
ZIP-level market 92586
- Home prices YoY
- -19.1%
- Rents YoY
- 6.1%
- Active inventory
- 197
- Price-to-rent
- 3.2×
Monthly cashflow live
- Estimated rent
- $2,344 high interval (Pro) →
- Mortgage (P&I)
- −$472
- Tax est. 1.5%
- −$112 /mo · $1,350/yr
- Insurance
- −$37
- HOA
- −$0
- Vacancy / Maint / Mgmt
- −$492
- Net cashflow
- $1,230
Break-even live
UW: 25.0% down · 7.5% · 30yr · 1.5% tax · 5.0% vac · 8.0% maint · 8.0% mgmt
Financing live
Cash to close
- Down payment
- $22,500
- Closing costs
- $2,700
- Reserves months
- —
- Total cash needed
- —
Loan-product check · same deal, 3 products live
Conventional
25% down · 7.5% · 30yr
- Down + closing
- —
- Monthly P&I
- —
- Monthly cashflow
- —
- DSCR
- —
- Eligible?
- —
Personal DTI + credit; lowest rate.
DSCR
20% down · 8.5% · 30yr
- Down + closing
- —
- Monthly P&I
- —
- Monthly cashflow
- —
- DSCR
- —
- Eligible?
- —
No personal income docs; deal must DSCR.
Hard money
10% down · 12.0% · 12mo
- Down + closing
- —
- Monthly P&I
- —
- Monthly cashflow
- —
- DSCR
- —
- Eligible?
- —
Short-term bridge; refi at stabilization.
Rent comps 13 comps
| Address | Beds | Baths | Sqft | Rent | $/sqft | DOM | Units | Dist |
|---|---|---|---|---|---|---|---|---|
| 27709 Camino Donaire Menifee, CA | 3.0 | 2.0 | 1317 | $3,000 | $2.28 | 2d | 1 | 0.35mi |
| 28082 Bavaria Dr Menifee, CA | 2.0 | 2.0 | 1065 | $2,250 | $2.11 | 2d | 1 | 0.49mi |
| 28230 Avenida Francesca Menifee, CA | 2.0 | 2.0 | 1116 | $2,250 | $2.02 | 2d | 1 | 0.64mi |
| 28244 Encanto Dr Menifee, CA | 2.0 | 2.0 | 900 | $2,300 | $2.56 | 2d | 1 | 0.66mi |
| 28301 Encanto Dr Unit 10 Menifee, CA | 2.0 | 2.0 | 900 | $2,200 | $2.44 | 17d | 1 | 0.72mi |
| 28301 Encanto Dr Menifee, CA | 2.0 | 1.0–2.0 | 873 | $2,025 | $2.32 | 2d | 5 | 0.77mi |
| 27757 Aspel Rd Menifee, CA | 1.0–2.0 | 1.0–2.0 | 1026 | $2,869 | $2.80 | 2d | 15 | 0.78mi |
| 28377 Encanto Dr Menifee, CA | 1.0–3.0 | 1.0–2.0 | 815 | $2,150 | $2.64 | 2d | 7 | 0.84mi |
| 27051 Sun City Blvd Unit 1 Menifee, CA | 2.0 | 1.0 | 729 | $1,975 | $2.71 | 2d | 1 | 0.89mi |
| 29196 Crestone Dr Sun City, CA | 2.0 | 2.0 | 1393 | $1,995 | $1.43 | 19d | 1 | 1.09mi |
| 26217 Birkdale Rd Menifee, CA | 1.0 | 1.0 | 876 | $2,150 | $2.45 | 2d | 1 | 1.29mi |
| 26156 Birkdale Rd Menifee, CA | 2.0 | 2.0 | 1285 | $2,000 | $1.56 | 2d | 1 | 1.32mi |
| 28375 Paseo Grande Dr Menifee, CA | 2.0 | 2.0 | 1285 | $2,395 | $1.86 | 2d | 1 | 1.32mi |
Listing history 16 events
-
2026-06-18days on market $89,999 Active 28 DOM
-
2026-06-17days on market $89,999 Active 27 DOM
-
2026-06-16days on market $89,999 Active 26 DOM
-
2026-06-15days on market $89,999 Active 25 DOM
-
2026-06-13days on market $89,999 Active 23 DOM
-
2026-06-09days on market $89,999 Active 19 DOM
-
2026-06-08days on market $89,999 Active 18 DOM
-
2026-06-07days on market $89,999 Active 17 DOM
-
2026-06-04days on market $89,999 Active 14 DOM
-
2026-06-03days on market $89,999 Active 13 DOM
-
2026-06-02days on market $89,999 Active 12 DOM
-
2026-06-01days on market $89,999 Active 11 DOM
-
2026-05-31days on market $89,999 Active 10 DOM
-
2026-05-21$89,999 Active
-
2026-04-07historical
-
2025-12-18$89,999 Active
ⓘ Source: listings_history table (triggers on properties + properties_extension) + one-shot
backfill from property_details.listing_events for pre-trigger history.
Climate risk First Street
- Flood 1/10 Low FEMA zone X (unshaded) · 0% chance over 30 yrs
- Wildfire 7/10 Severe
- Heat 7/10 Severe 6 d/yr ≥105°F today · 16 d/yr by 30 yrs out
- Wind 1/10 Low
- Air quality 5/10 Major 9 unhealthy d/yr today · 11 by 30 yrs out
Nearby sold comps map
Loading sold comps map…
Walkable amenities ~0.75 mi
Loading nearby amenities…
Taxation est. · year 1
- Rental income
- $28,127
- − Mortgage interest
- −$5,041
- − Property taxes
- −$1,350
- − Insurance
- −$450
- − Repairs & maintenance
- −$2,250
- − Management
- −$2,250
- − Depreciation
- −$2,618
- Taxable income
- $14,167
- Est. tax owed @ 24.0%
- −$3,400
- After-tax cash flow
- $11,356/yr
For passive investors: Depreciation is non-cash, so a rental often shows a tax loss while cash-flowing — sheltering income. Rental losses are passive: they offset passive income freely, and up to $25,000/yr can offset ordinary (W-2) income if you actively participate and your MAGI is under $100k (phasing out to $0 by $150k); unused losses carry forward. On sale, claimed depreciation is recaptured at up to 25%, and gains may owe capital-gains tax (a 1031 exchange can defer both). Figures are a year-1 estimate at your 24.0% rate — not tax advice; consult a CPA.
Schools (NCES district)
- District
- Menifee Union Elementary
- NCES district ID
- 0624540
- Math proficiency
- 43% ▬ 0.00%
- Reading proficiency
- 56% ▲ 3.00%
- Median HH income
- $58,228
- Composite
- 45.17/100
- National rank
- #5790
- State rank
- #434 of 1400 in CA
Livability — Menifee
- Score
- 64/100
- State rank
- #407
- US rank
- #13882
Category grades
Schools grade is shown separately in the Schools card above.
Census & demographics
- Census place
- Menifee, CA
- County
- Riverside County · 2,287,001 people
- City population
- 111,667
- Metro
- Riverside-San Bernardino-Ontario, CA
- Population (ZIP)
- 20,767
- Household income
- $57,708
- Rent vs Own
- Severe rent burden
- 1163.0
Population outlook (Riverside County) Hauer SSP2
- Today (2025)
- 2,664,475 people
- By 2030
- 2,802,692 · +5.2%
- By 2040
- 3,050,904 · +14.5%
- By 2050
- 3,256,783 · +22.2%
- By 2075
- 3,655,058 · +37.2%
- By 2100
- 3,766,594 · +41.4%
Race, ethnicity, and origin ACS 2023
- Neighborhood character
- Diverse neighborhood (Simpson 0.59)
- Race & ethnicity
- White 55% Hispanic / Latino 31% Two or more races 17% Black 6% Asian 3%
- Hispanic origin (detail)
- Mexican 25% Puerto Rican 1%
- Common ancestry
- Lithuanian 3% Italian 2% Romanian 1%
- Foreign-born
- 15% · Canada, Vietnam, China
- Languages at home
- 77% English-only · Spanish 18% Other Asian/Pacific 1% Other Indo-European 1%
Political lean MEDSL · Riverside
- 2024 margin
- Toss-up / Even · D 48.0% · R 49.3% · Other 2.6%
- 2008→2024 swing
- -3.6pp toward R · 2008: 2.3pp · 2024: -1.3pp
- All cycles
- 2024: R+1.3 2020: D+8.0 2016: D+4.3 2012: R+0.4 2008: D+2.3
Not yet ingested
- Civics
- —
Market trends
- HPI YoY
- ▼ -86.18%
- Current HPI
- 364.9577
- Rent YoY
- ▲ 6.10%
- Metro
- Riverside-San Bernardino-Ontario, CA
- State GDP YoY
- ▲ 3.21%
- F500 in state
- 116
Industry mix (Fortune 500 HQ in CA)
| Industry | F500 HQs | Revenue |
|---|---|---|
| Technology | 27 | $1,492B |
|
||
| Financial Services | 3 | $174B |
|
||
| Retail | 3 | $44B |
|
||
| Insurance | 3 | $26B |
|
||
| Media / Entertainment | 2 | $115B |
|
||
| Pharmaceuticals / Biotech | 2 | $62B |
|
||
Price history
+0.0% since first listed3 events — show timeline
- 2026-05-21 Listed $89,999 CRMLS
- 2026-04-07 Listing Removed — CRMLS
- 2025-12-18 Listed $89,999 CRMLS
Property tax history
-2.4%/yrLatest (2025): $58 · +5.1% YoY. Source: county tax records.
Cash-flow waterfall
monthlySold comps — $/sqft
last 12 mo · ≤1 miLoading sold comps…