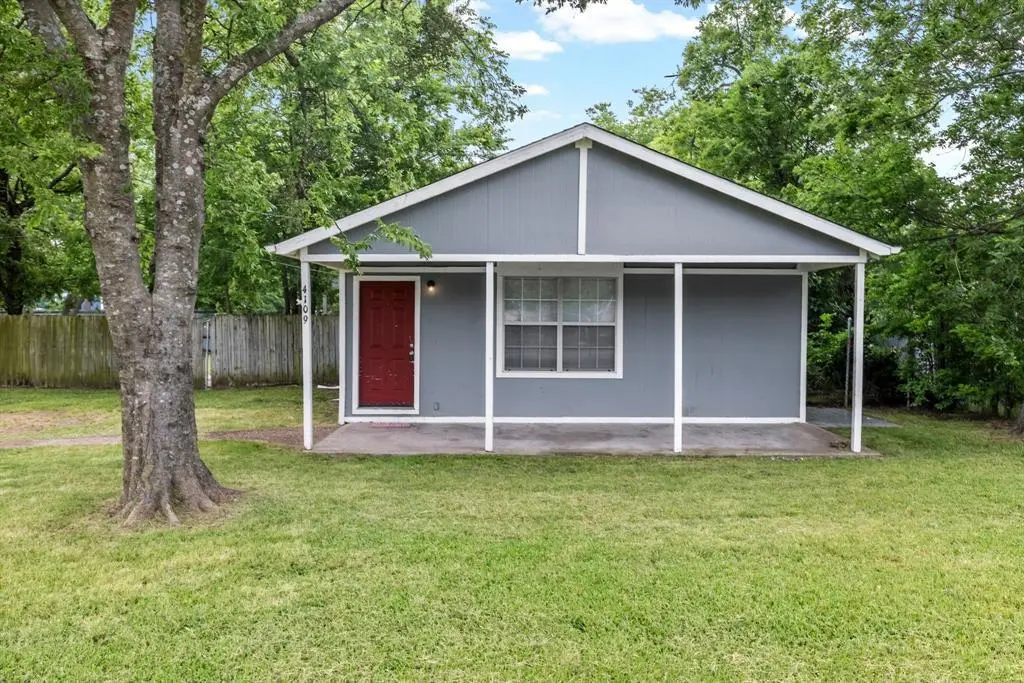
4109 Katy Dr · Greenville, TX
Flood risk 1/10 · Minimal
- FEMA flood zone
- X (unshaded)
- Chance of flooding over 30 yrs
- 0.0%
- Est. flood insurance / yr
- $507 – $1,088
Fire risk 5/10 · Moderate
- Est. fire insurance / yr
- $1,222 – $2,270
Heat risk 7/10 · Major
- Hot days now (above 110°F)
- 7 days/yr
- Hot days in 30 yrs
- 23 days/yr
Wind risk 6/10 · Moderate
- Chance of severe wind over 30 yrs
- 27.0%
Air-quality risk 2/10 · Minimal
- Unhealthy air days now
- 1 days/yr
- Unhealthy air days in 30 yrs
- 1 days/yr
Risk factors via First Street. Map © Google.
Why this score? — see what drove the D grade
The composite is a weighted blend of 9 inputs, each scored 0–100. Each bar is that input's sub-score; the figure is the points it added to the 100-point composite (weight × sub-score).
- ARV discount +13.8/15.0
- Cash flow +10.0/30.0
- Livability +3.9/5.0
- 1% rule +3.8/10.0
- DSCR +2.8/10.0
- Rent growth +2.7/5.0
- Condition / age +2.5/5.0
- Schools +2.0/10.0
- Appreciation +0.0/10.0
$199,000
🖨 Deal sheet 📄 Offer letter ✓ Due diligence
Listing remarks
Skip the long commute! Perfectly positioned with easy access to I-30 and Joe Ramsey Blvd, this recently updated 3-bed, 2-bath home is a dream for anyone on the go. The interior features a spacious kitchen and living area perfect for entertaining, while the updates ensure you can move in and start living on day one. Whether you're heading to work or exploring the vibrant shops and restaurants of Downtown Greenville, everything you need is just minutes away. A spacious backyard and convenient location complete this must-see property.
Key facts
- Spacious backyard
- Recently updated
- Spacious kitchen
Tags
Property features AI
Finance
- Other: Listing possession at closing/funding; Listing status: Active
- Financial info: Accepts Cash, Conventional, FHA, and VA financing; Second mortgage: No; Loan type: Treat as clear
- HOA & community: No homeowners association
Exterior
- Parking: Driveway; Gated entry
- Utilities: City water; City sewer; Individual gas meter; Individual water meter
- Home design: Single-family residence; One level; Property attached: Yes
- Construction: Built in 1950; Siding and wood construction; Block foundation; Asphalt roof
- Exterior features: Chain link and privacy fencing; All-weather road access; Less than 0.5 acre lot (approx. 0.3544 acres)
Interior
- Kitchen: Dishwasher; Electric oven; Microwave; Refrigerator
- Bedrooms: 3 bedrooms (primary bedroom on level 1)
- Flooring: Carpet; Vinyl
- Bathrooms: 2 full bathrooms
- Heating & cooling: Central heat; Central air conditioning
- Interior features: Eat-in kitchen with granite counters and pantry; One living area and one dining area; Total of 3 rooms (per count)
- Laundry & utility: Individual gas meter and individual water meter
Neighborhood map
What this means for you Summary
Snapshot
- This is a 3-bed/2.0-bath single-family listed at $199k.
Deal economics
- At list price, monthly cash flow is $-122 ($-1k/yr) — negative.
- To cash-flow at today's rent, offer at most $178k (10.8% below list).
- To meet the 1% rule (rent ≥ 1% of price), the offer needs to be $175k (12.2% below list).
- Recommended offer: $175k (12.2% below list) — sets the bar for 1% rule.
- Cap rate 5.6% vs local median 4.1% in Greenville — top-decile yield for the area; either an underpriced asset or a hidden risk that comps aren't pricing in. Stress-test before assuming the spread holds.
Location & tenants
- Location reads 77/100 on livability (#78 in TX, #2,719 nationally) — a middle-class / working-renter tenant base. Strengths: cost of living A+, housing A+, health & safety A; Watch: employment D, commute F.
- Greenville ISD (town): math 20% / reading 26% proficiency, ranked #743 of 826 in TX (top 90%) — low school quality limits family demand, transient renter base, plan for 1-2y turnover.
- Zoned schools: Bowie El (math 26% / reading 30%, grade F, #2,740 of 4,322 statewide, top 64%, 609 students, 71% FRL) — zoned schools average 71% FRL vs 55% district-wide (16 pts higher); higher-poverty schools than district average — tighter screening recommended.
- Market conditions: Rents flat; 396 active listings in the ZIP; 40 comparable units currently listed for rent nearby; rentals at typical pace (median 24d on market — plan ~3-4 weeks tenant-placement turnaround); 42% of comp listings sitting > 30 days — soft ceiling on asking rent; 1,289 units permitted in Hunt County in 2024 (527 in 5+ unit buildings).
- This rent runs 35% of the median local income ($60k/yr) — at the standard rent-burdened threshold; future hikes will face affordability resistance.
Forward outlook
- Local home prices are declining (-3.0%/yr); year-one equity from $1k of loan paydown is wiped out by about $6k of value loss. Plan a longer hold.
- Hunt County population projected at +15% by 2050 — modest demand growth; plan on rents tracking national, not racing it.
Negotiation context
- It's been on market 34 days — a 3% lower offer ($193k) is reasonable based on typical stale-listing flexibility.
- 7 sale attempts since 4y ago with the ask held roughly flat each time — persistent listings suggest the price (not the market) is what's stuck; bring a comps-based counter.
Risks & watch-outs
- Watch-outs: built in 1950 — expect roof / HVAC / electrical / plumbing capex.
- Climate carrying-cost: major wind risk, 27% chance of damaging wind over 30y; moderate wildfire risk; extreme-heat days projected 7→23/yr by 2055 (HVAC capex compounding) — expect insurance premiums to compound above CPI over the hold.
Questions for the listing agent
- What do current leases actually rent for vs. the listed asking? Can we see a recent rent roll and the last 12 months of T-12 income?
- It's been on market 34 days. Have you received any prior offers? Is the seller open to a 12% concession, seller financing, or rate buy-down credit?
- Built in 1950 — when were the roof, HVAC, electrical panel, plumbing, and water heater last replaced?
- Is there a deadline driving the sale (1031 exchange, divorce, estate, relocation)? That informs how much negotiation room exists.
- Schools are D-rated, which usually means shorter tenancies and higher turnover. Who's the typical renter profile here, and what's been the actual vacancy rate?
- The area grade is low — what's the realistic commute time and amenity access for the typical tenant pool here? Any planned neighborhood developments (good or bad) we should know about?
- What's the average days-on-market for RENTAL listings here right now (not sales)? A rising rental-DOM trend means longer vacancies and softer asking-rent achievability than the comps imply.
- What's the recent tenant-quality profile in this submarket — average credit score on applications, eviction rate, late-payment / NSF rate, and stable-employment percentage? A property-management company in the area should have these aggregated.
- How much new for-sale + rental construction is in the pipeline within 1–3 miles? Heavy new supply typically softens prices + rents 12–24 months out; constrained supply supports both.
Investment metrics
- 1% rule
- 0.88% ✗
- Cap rate
- 5.56%
- Cash-on-cash
- -2.62%
- DSCR
- 0.88
- GRM
- 9.5
CMA / ARV
- ARV (median comp)
- $231,435
- List price
- $199,000
- Delta
- -14.01%
- Verdict
- UNDERPRICED
- Comps
- 20 within 1.0 mi
Show comp detail 12 sales within ~0.75 mi
| Address | Dist | Beds/Ba | Sqft | Sold | Price | $/sf | Match |
|---|---|---|---|---|---|---|---|
| 4501 Washington St | 0.30mi | 4/2.5 (+1) | 1,771 (-5%) | 1mo | $268,888 | $152 | 69 |
| 4613 Lee St | 0.43mi | 4/2.0 (+1) | 1,911 (+2%) | 4mo | $285,000 | $149 | 68 |
| 3525 Lee St | 0.48mi | 3/2.0 | 1,750 (-6%) | 1mo | $234,999 | $134 | 66 |
| 4002 Park St | 0.31mi | 2/2.0 (-1) | 1,704 (-9%) | 2mo | $189,900 | $111 | 64 |
| 3915 Caddo St | 0.23mi | 4/3.0 (+1) | 1,737 (-7%) | 6mo | $297,700 | $171 | 63 |
| 4020 Spencer St | 0.13mi | 3/2.0 | 1,605 (-14%) | 10mo | $95,000 | $59 | 61 |
| 4809 Pickett St | 0.44mi | 4/3.0 (+1) | 1,811 (-3%) | 7mo | $349,000 | $193 | 59 |
| 3901 Oneal St | 0.30mi | 4/2.0 (+1) | 1,607 (-14%) | 1mo | $168,000 | $105 | 57 |
| 2923 Walnut St | 0.18mi | 4/2.0 (+1) | 1,644 (-12%) | 13mo | $72,000 | $44 | 55 |
| 3615 College St | 0.28mi | 3/2.0 | 1,604 (-14%) | 13mo | $239,900 | $150 | 52 |
| 4002 Templeton St | 0.43mi | 4/2.0 (+1) | 1,661 (-11%) | 6mo | $169,900 | $102 | 52 |
| 3233 Washington St | 0.57mi | 3/2.5 | 2,062 (+10%) | 4mo | $229,900 | $111 | 51 |
Match score weights: distance 35% · size 25% · config 20% · recency 20%. Top-matched comps best support the ARV.
Projected returns pro-forma
-3.0% appreciation · 0.62% rent growth · sell at horizon
- IRR
- -23.6%
- Equity multiple
- 0.21×
- Total profit
- $-43,974
- Equity at exit
- $29,672
- IRR
- -27.5%
- Equity multiple
- -0.15×
- Total profit
- $-63,832
- Equity at exit
- $17,206
Cash invested: $55,720 (down + closing). Projections, not guarantees.
Landlord ↔ Tenant lean methodology
- Overall (STATE)
- 87 Strongly Landlord-Friendly
- State Texas
- 87 Strongly Landlord-Friendly · R+5
- County
- — inherits STATE
- City
- — inherits STATE
ZIP-level market 75401
- Home prices YoY
- -20.7%
- Rents YoY
- 0.6%
- Active inventory
- 396
- Price-to-rent
- 9.5×
Monthly cashflow live
- Estimated rent
- $1,747 high interval (Pro) →
- Mortgage (P&I)
- −$1,044
- Tax from tax record
- −$376 /mo · $4,507/yr
- Insurance
- −$83
- HOA
- −$0
- Vacancy / Maint / Mgmt
- −$367
- Net cashflow
- $-122
Break-even live
UW: 25.0% down · 7.5% · 30yr · 1.5% tax · 5.0% vac · 8.0% maint · 8.0% mgmt
Financing live
Cash to close
- Down payment
- $49,750
- Closing costs
- $5,970
- Reserves months
- —
- Total cash needed
- —
Loan-product check · same deal, 3 products live
Conventional
25% down · 7.5% · 30yr
- Down + closing
- —
- Monthly P&I
- —
- Monthly cashflow
- —
- DSCR
- —
- Eligible?
- —
Personal DTI + credit; lowest rate.
DSCR
20% down · 8.5% · 30yr
- Down + closing
- —
- Monthly P&I
- —
- Monthly cashflow
- —
- DSCR
- —
- Eligible?
- —
No personal income docs; deal must DSCR.
Hard money
10% down · 12.0% · 12mo
- Down + closing
- —
- Monthly P&I
- —
- Monthly cashflow
- —
- DSCR
- —
- Eligible?
- —
Short-term bridge; refi at stabilization.
Rent comps 40 comps
| Address | Beds | Baths | Sqft | Rent | $/sqft | DOM | Units | Dist |
|---|---|---|---|---|---|---|---|---|
| 4203 Pickett St Greenville, TX | 4.0 | 2.5 | 2413 | $2,200 | $0.91 | 43d | 1 | 0.13mi |
| 2902 Walnut St Greenville, TX | 4.0 | 3.0 | 2189 | $2,050 | $0.94 | 24d | 1 | 0.16mi |
| 2811 Walnut St Greenville, TX | 3.0 | 2.0 | 1368 | $1,595 | $1.17 | 43d | 1 | 0.19mi |
| 3912 Oneal St Greenville, TX | 3.0 | 2.5 | 1592 | $1,750 | $1.10 | 43d | 1 | 0.27mi |
| 3303 Texas St Greenville, TX | 3.0 | 1.0 | 1260 | $1,450 | $1.15 | 2d | 1 | 0.27mi |
| 3614 Short St Greenville, TX | 3.0 | 2.0 | 1323 | $1,600 | $1.21 | 43d | 1 | 0.32mi |
| 3614 Short St Greenville, TX | 3.0 | 2.0 | 1323 | $1,600 | $1.21 | 24d | 1 | 0.32mi |
| 2406 Beecha St Greenville, TX | 3.0 | 2.0 | 1263 | $1,575 | $1.25 | 43d | 1 | 0.34mi |
| 2225 College St Greenville, TX | 4.0 | 2.5 | 1832 | $2,000 | $1.09 | 44d | 1 | 0.36mi |
| 2225 College St Greenville, TX | 3.0 | 2.0 | 1439 | $1,800 | $1.25 | 24d | 1 | 0.36mi |
| 2210 Langford St Greenville, TX | 4.0 | 2.0 | 1510 | $1,595 | $1.06 | 43d | 1 | 0.38mi |
| 3819 Henry St Greenville, TX | 3.0 | 2.0 | 1590 | $1,295 | $0.81 | 12d | 1 | 0.44mi |
| 4709 Henry St Greenville, TX | 3.0 | 2.0 | 1299 | $1,550 | $1.19 | 7d | 1 | 0.51mi |
| 4811 Henry St Greenville, TX | 3.0 | 2.0 | 1565 | $1,800 | $1.15 | 18d | 1 | 0.60mi |
| 142 Canales Cir Greenville, TX | 3.0 | 2.0 | 1532 | $1,695 | $1.11 | 43d | 1 | 0.60mi |
| 1711 Langford St Greenville, TX | 3.0 | 1.5 | 1274 | $1,495 | $1.17 | 24d | 1 | 0.62mi |
| 1711 Langford St Greenville, TX | 3.0 | 1.5 | 1274 | $1,495 | $1.17 | 22d | 1 | 0.62mi |
| 4810 Jefferson St Greenville, TX | 3.0 | 2.0 | 1565 | $1,700 | $1.09 | 2d | 1 | 0.64mi |
| 3840 McDougal St Greenville, TX | 3.0 | 2.0 | 1458 | $2,000 | $1.37 | 7d | 1 | 0.74mi |
| 3307 Polk St Unit A Greenville, TX | 3.0 | 2.0 | 1288 | $1,550 | $1.20 | 17d | 1 | 0.76mi |
| 3310 Polk St Greenville, TX | 3.0 | 2.0 | 1513 | $1,800 | $1.19 | 24d | 1 | 0.77mi |
| 2113 Wright St Unit A Greenville, TX | 3.0 | 2.5 | 1436 | $1,800 | $1.25 | 43d | 1 | 0.78mi |
| 2901 Lee St Apt 1 Greenville, TX | 2.0 | 2.0 | 1250 | $1,575 | $1.26 | 43d | 1 | 0.79mi |
| 1906 Oliver St Greenville, TX | 3.0 | 2.0 | 1380 | $1,650 | $1.20 | 2d | 1 | 0.81mi |
| 1902 Oliver St Greenville, TX | 3.0 | 2.0 | 1380 | $1,700 | $1.23 | 2d | 1 | 0.82mi |
| 1901 Wright St Greenville, TX | 3.0 | 2.0 | 1260 | $1,575 | $1.25 | 24d | 1 | 0.85mi |
| 3110 Saint John St Unit B Greenville, TX | 3.0 | 2.0 | 1273 | $1,450 | $1.14 | 44d | 1 | 0.86mi |
| 3110 Saint John St Unit A Greenville, TX | 3.0 | 2.0 | 1273 | $1,500 | $1.18 | 44d | 1 | 0.86mi |
| 3110 Saint John St Unit B Greenville, TX | 3.0 | 2.0 | 1273 | $1,400 | $1.10 | 24d | 1 | 0.86mi |
| 3110 Saint John St Unit A Greenville, TX | 3.0 | 2.0 | 1273 | $1,425 | $1.12 | 43d | 1 | 0.86mi |
| 3110 Saint John St Greenville, TX | 3.0 | 2.0 | 1273 | $1,500 | $1.18 | 43d | 1 | 0.86mi |
| 2704 Jones St Greenville, TX | 3.0 | 2.0 | 1273 | $1,550 | $1.22 | 2d | 1 | 0.87mi |
| 1707 Wright St Greenville, TX | 3.0 | 2.0 | 1400 | $1,725 | $1.23 | 5d | 1 | 0.92mi |
| 4909 Delano St Greenville, TX | 3.0–4.0 | 2.0–2.5 | 1614 | $1,955 | $1.21 | 1d | 1 | 0.93mi |
| 4802 Fillmore Dr Greenville, TX | 3.0 | 2.0 | 1600 | $2,040 | $1.27 | 43d | 1 | 1.01mi |
| 1311 Wright St Greenville, TX | 3.0 | 2.5 | 1582 | $1,750 | $1.11 | 43d | 1 | 1.06mi |
| 3333 Dalton St Greenville, TX | 3.0 | 2.0 | 1493 | $1,635 | $1.10 | 5d | 1 | 1.12mi |
| 3333 Dalton St Greenville, TX | 3.0 | 2.0 | 1493 | $1,635 | $1.10 | 7d | 1 | 1.12mi |
| 3333 Dalton St Greenville, TX | 3.0 | 2.0 | 1493 | $1,635 | $1.10 | 24d | 1 | 1.12mi |
| 2305 Bourland St Greenville, TX | 3.0 | 2.0 | 1320 | $1,900 | $1.44 | 43d | 1 | 1.16mi |
Listing history 31 events
-
2026-06-18days on market $199,000 Active 34 DOM
-
2026-06-17days on market $199,000 Active 33 DOM
-
2026-06-16days on market $199,000 Active 32 DOM
-
2026-06-15days on market $199,000 Active 31 DOM
-
2026-06-13days on market $199,000 Active 29 DOM
-
2026-06-09days on market $199,000 Active 25 DOM
-
2026-06-08days on market $199,000 Active 24 DOM
-
2026-06-07days on market $199,000 Active 23 DOM
-
2026-06-04days on market $199,000 Active 20 DOM
-
2026-06-03days on market $199,000 Active 19 DOM
-
2026-06-02days on market $199,000 Active 18 DOM
-
2026-06-01days on market $199,000 Active 17 DOM
-
2026-05-31days on market $199,000 Active 16 DOM
-
2026-05-15$199,000 Active 537-char remark
-
2023-12-14status Active
-
2023-12-08historical Active Option Contract
-
2023-10-26$226,000 Active
-
2023-08-15historical
-
2023-08-04price $239,000
-
2023-07-25price $249,900
-
2023-07-11$239,000 Active
-
2023-06-30$270,000 Active
-
2023-03-03soldstatus
-
2023-03-01soldstatus Closed
-
2023-02-15status Pending
-
2022-12-08$135,000 Active
-
2022-10-31historical
-
2022-10-11price $139,000
-
2022-09-07price $149,000
-
2022-07-06price $168,000
-
2022-06-29$178,000 Active
ⓘ Source: listings_history table (triggers on properties + properties_extension) + one-shot
backfill from property_details.listing_events for pre-trigger history.
Tax reassessment forecast TX · Resets to sale price
- Current annual tax
- $4,507 · $376/mo
- Projected year-2 tax
- $4,507 · $376/mo
- Expected delta
- $0/yr ($0/mo · 0.0%)
ⓘ Screening estimate from a state-policy table — verify with the county assessor before closing.
Climate risk First Street
- Flood 1/10 Low FEMA zone X (unshaded) · 0% chance over 30 yrs
- Wildfire 5/10 Major
- Heat 7/10 Severe 7 d/yr ≥110°F today · 23 d/yr by 30 yrs out
- Wind 6/10 Major 27% chance of damaging wind over 30 yrs
- Air quality 2/10 Low 1 unhealthy d/yr today · 1 by 30 yrs out
Nearby sold comps map
Loading sold comps map…
Walkable amenities ~0.75 mi
Loading nearby amenities…
Taxation est. · year 1
- Rental income
- $20,969
- − Mortgage interest
- −$11,147
- − Property taxes
- −$4,507
- − Insurance
- −$995
- − Repairs & maintenance
- −$1,678
- − Management
- −$1,678
- − Depreciation
- −$5,789
- Taxable loss
- −$4,824
- Est. tax savings @ 24.0%
- +$1,158
- After-tax cash flow
- $-301/yr
For passive investors: Depreciation is non-cash, so a rental often shows a tax loss while cash-flowing — sheltering income. Rental losses are passive: they offset passive income freely, and up to $25,000/yr can offset ordinary (W-2) income if you actively participate and your MAGI is under $100k (phasing out to $0 by $150k); unused losses carry forward. On sale, claimed depreciation is recaptured at up to 25%, and gains may owe capital-gains tax (a 1031 exchange can defer both). Figures are a year-1 estimate at your 24.0% rate — not tax advice; consult a CPA.
Schools (NCES district)
- District
- Greenville ISD
- NCES district ID
- 4821720
- Math proficiency
- 20% ▼ -12.00%
- Reading proficiency
- 26% ▼ -7.00%
- Median HH income
- $41,374
- Composite
- 19.56/100
- National rank
- #8759
- State rank
- #743 of 826 in TX
Livability — Greenville
- Score
- 77/100
- State rank
- #78
- US rank
- #2719
Category grades
Schools grade is shown separately in the Schools card above.
Census & demographics
- Census place
- Greenville, TX
- County
- Hunt County · 71,969 people
- City population
- 42,767
- Metro
- Dallas-Fort Worth-Arlington, TX
- Population (ZIP)
- 22,669
- Household income
- $59,908
- Rent vs Own
- Severe rent burden
- 638.0
Population outlook (Hunt County) Hauer SSP2
- Today (2025)
- 97,090 people
- By 2030
- 100,452 · +3.5%
- By 2040
- 106,544 · +9.7%
- By 2050
- 111,218 · +14.6%
- By 2075
- 121,695 · +25.3%
- By 2100
- 123,683 · +27.4%
Race, ethnicity, and origin ACS 2023
- Neighborhood character
- Diverse neighborhood (Simpson 0.62)
- Race & ethnicity
- White 51% Hispanic / Latino 32% Black 13% Two or more races 11%
- Hispanic origin (detail)
- Mexican 30%
- Common ancestry
- Slovak 2% Lithuanian 1% Iranian 1%
- Foreign-born
- 13% · Canada
- Languages at home
- 75% English-only · Spanish 24%
Political lean MEDSL · Hunt
- 2024 margin
- Solid R (+55.5) · D 21.9% · R 77.4%
- 2008→2024 swing
- -14.9pp toward R · 2008: -40.6pp · 2024: -55.5pp
- All cycles
- 2024: R+55.5 2020: R+52.5 2016: R+56.3 2012: R+51.2 2008: R+40.6
Not yet ingested
- Civics
- —
Market trends
- HPI YoY
- ▼ -88.45%
- Current HPI
- 339.0287
- Rent YoY
- ▲ 0.62%
- Metro
- Dallas-Fort Worth-Arlington, TX
- State GDP YoY
- ▲ 3.95%
- F500 in state
- 110
Industry mix (Fortune 500 HQ in TX)
| Industry | F500 HQs | Revenue |
|---|---|---|
| Energy | 16 | $1,198B |
|
||
| Technology | 5 | $198B |
|
||
| Engineering / Construction | 4 | $72B |
|
||
| Energy Services | 3 | $60B |
|
||
| Utilities | 3 | $41B |
|
||
| Healthcare | 2 | $330B |
|
||
Price history
+11.8% since first listed18 events — show timeline
- 2026-05-15 Listed $199,000 NTREIS
- 2023-12-14 Relisted — NTREIS
- 2023-12-08 Contingent — NTREIS
- 2023-10-26 Listed $226,000 NTREIS
- 2023-08-15 Listing Removed — NTREIS
- 2023-08-04 Price Changed $239,000 NTREIS
- 2023-07-25 Price Changed $249,900 NTREIS
- 2023-07-11 Listed $239,000 GTAR
- 2023-06-30 Listed $270,000 NTREIS
- 2023-03-03 Sold (Public Records) — Public Records
- 2023-03-01 Sold (MLS) — NTREIS
- 2023-02-15 Pending — NTREIS
- 2022-12-08 Listed $135,000 NTREIS
- 2022-10-31 Listing Removed — NTREIS
- 2022-10-11 Price Changed $139,000 NTREIS
- 2022-09-07 Price Changed $149,000 NTREIS
- 2022-07-06 Price Changed $168,000 NTREIS
- 2022-06-29 Listed $178,000 NTREIS
Property tax history
+8.0%/yrLatest (2025): $4,507 · +21.6% YoY. Source: county tax records.
Cash-flow waterfall
monthlySold comps — $/sqft
last 12 mo · ≤1 miLoading sold comps…