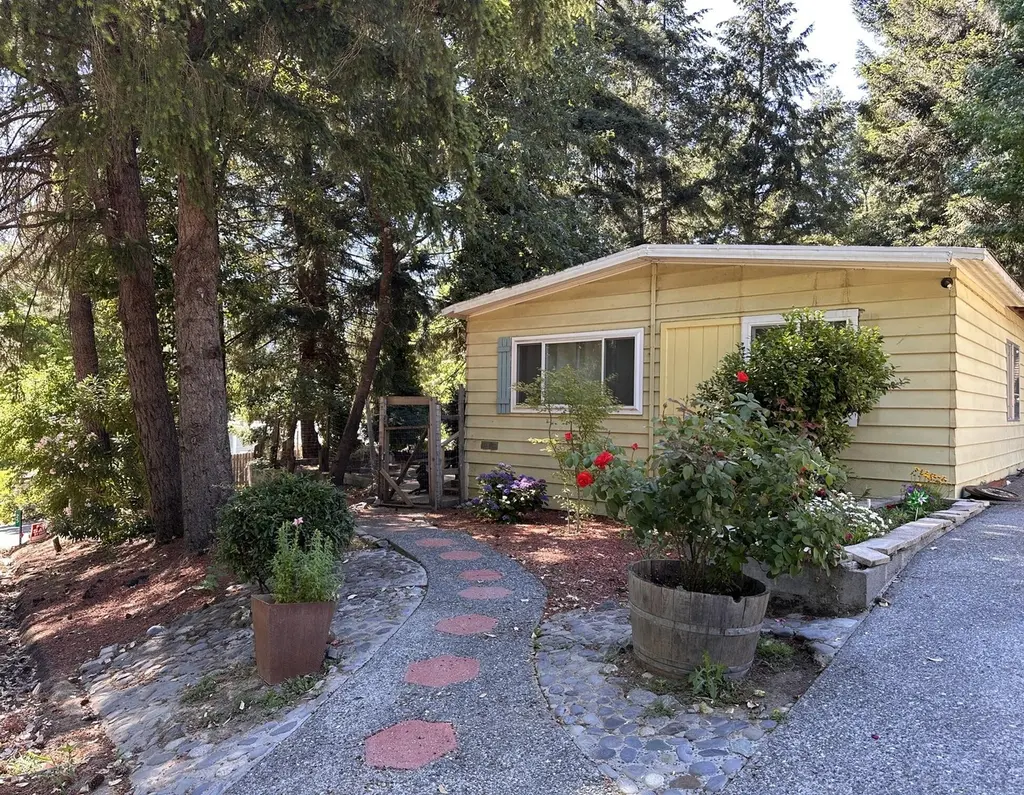
25 Tree Top Ln · Willow Creek, CA
Flood risk 1/10 · Minimal
- FEMA flood zone
- D
- Chance of flooding over 30 yrs
- 0.0%
- Est. flood insurance / yr
- $544 – $1,084
Fire risk 6/10 · Moderate
- Est. fire insurance / yr
- $659 – $1,223
Heat risk 5/10 · Moderate
- Hot days now (above 101°F)
- 10 days/yr
- Hot days in 30 yrs
- 21 days/yr
Wind risk 1/10 · Minimal
- Chance of severe wind over 30 yrs
- —
Air-quality risk 10/10 · Severe
- Unhealthy air days now
- 39 days/yr
- Unhealthy air days in 30 yrs
- 40 days/yr
Risk factors via First Street. Map © Google.
Why this score? — see what drove the C+ grade
The composite is a weighted blend of 9 inputs, each scored 0–100. Each bar is that input's sub-score; the figure is the points it added to the 100-point composite (weight × sub-score).
- Cash flow +17.4/30.0
- ARV discount +15.0/15.0
- Appreciation +10.0/10.0
- DSCR +5.4/10.0
- 1% rule +3.6/10.0
- Livability +3.2/5.0
- Rent growth +2.5/5.0
- Condition / age +2.5/5.0
- Schools +1.5/10.0
$199,000
🖨 Deal sheet 📄 Offer letter ✓ Due diligence
Listing remarks
Tired of renting? This charming and affordable starter home sits on a lovely 0.25-acre corner lot in sunny Willow Creek It features 4 bedrooms, 2 bathrooms, a living room, and a family/dining room off the kitchen, plus in-house laundry room, central heating and air conditioning, and a cozy wood stove in the family room. Enjoy the deck and solarium at the front, grassy backyard, and a fenced front yard with gravel. This manufactured home comes with a 433a permitted foundation. Sale contingent on Seller finding suitable replacement housing.
Key facts
- Cozy wood stove
- Grassy backyard
- Deck
Tags
Property features AI
Finance
- Other: Lot is approximately 0.25 acre; Roads to property are concrete and paved; Lot features include level and sloped areas; Other structures on site
Exterior
- Parking: Driveway access from Bigfoot Avenue
- Utilities: Public water; Private sewer; Electricity connected; Circuit breakers with 220V in laundry
- Home design: Single-family residence; One level; Irregular lot shape; Has a view
- Construction: Aluminum siding; Pillar/post/pier foundation; Other roof material
- Exterior features: Garden; Outbuilding; Additional miscellaneous exterior features; Partial fencing
Interior
- Kitchen: Range; Range hood; Refrigerator; Disposal
- Bedrooms: Primary suite downstairs
- Flooring: Carpet; Vinyl; Laminate
- Bathrooms: 2 full bathrooms
- Heating & cooling: Wood stove; Electric heating; Forced air heating; Ceiling fans
- Interior features: Ceiling fans; Breakfast bar; Pantry; Primary bedroom on main level; Wood-burning stove fireplace
- Laundry & utility: Washer; Dryer
Neighborhood map
What this means for you Summary
Snapshot
- This is a 4-bed/2.0-bath single-family listed at $199k.
Deal economics
- At list price, monthly cash flow is $149 ($2k/yr) — positive.
- The deal already cash-flows at list — no discount required.
- To meet the 1% rule (rent ≥ 1% of price), the offer needs to be $171k (13.9% below list).
- Recommended offer: $171k (13.9% below list) — sets the bar for 1% rule.
Location & tenants
- Location reads 64/100 on livability (#422 in CA) — a middle-class / working-renter tenant base. Strengths: commute A+, employment A+, housing A+; Watch: health & safety C-, amenities F, cost of living F.
- Klamath-Trinity Joint Unified (rural): math 11% / reading 17% proficiency, ranked #1,307 of 1,400 in CA (top 93%) — low school quality limits family demand, transient renter base, plan for 1-2y turnover; 80% free/reduced lunch — lower-income household profile, screen leases tightly.
- Zoned schools: Trinity Valley Elementary (150 students, 85% FRL) — zoned schools at 85% FRL track the district average.
- Market conditions: 39 active listings in the ZIP; 188 units permitted in Humboldt County in 2024 (17 in 5+ unit buildings).
Forward outlook
- In year one you build about $21k of equity ($1k loan paydown + $20k appreciation (10.0% local appreciation)).
- Humboldt County population projected to shrink 4% by 2050 — rents likely to lag national; underwrite the cash flow, not the appreciation.
- At projected returns (10.0% appreciation + 3.0% rent growth), your $56k cash investment doubles in ~3 years — after that, you're playing with house money.
- By year 2, paydown + projected appreciation supports a ~$34k cash-out refi (75% LTV) — recoverable capital for the next deal without selling this one.
Negotiation context
- Only 9 days on market — expect competitive offers; lowballing is unlikely to land.
- Current owner paid $152k; 31% above their basis — modest negotiation headroom, anchor on the comps not their cost.
Risks & watch-outs
- Climate carrying-cost: major wildfire risk; extreme-heat days projected 10→21/yr by 2055 (HVAC capex compounding) — expect insurance premiums to compound above CPI over the hold.
Questions for the listing agent
- Built in 1978 — when were the roof, HVAC, electrical panel, plumbing, and water heater last replaced?
- Is there a deadline driving the sale (1031 exchange, divorce, estate, relocation)? That informs how much negotiation room exists.
- Schools are D-rated, which usually means shorter tenancies and higher turnover. Who's the typical renter profile here, and what's been the actual vacancy rate?
- What's the average days-on-market for RENTAL listings here right now (not sales)? A rising rental-DOM trend means longer vacancies and softer asking-rent achievability than the comps imply.
- What's the recent tenant-quality profile in this submarket — average credit score on applications, eviction rate, late-payment / NSF rate, and stable-employment percentage? A property-management company in the area should have these aggregated.
- How much new for-sale + rental construction is in the pipeline within 1–3 miles? Heavy new supply typically softens prices + rents 12–24 months out; constrained supply supports both.
Investment metrics
- 1% rule
- 0.86% ✗
- Cap rate
- 7.19%
- Cash-on-cash
- 3.22%
- DSCR
- 1.14
- GRM
- 9.7
CMA / ARV
- ARV (on-the-fly)
- $289,440
- Comps found
- 1
Show comp detail 1 sale within ~0.75 mi
| Address | Dist | Beds/Ba | Sqft | Sold | Price | $/sf | Match |
|---|---|---|---|---|---|---|---|
| 124 Sunset Ln | 0.06mi | 3/2.0 (-1) | 1,280 (-11%) | 8mo | $257,550 | $201 | 67 |
Match score weights: distance 35% · size 25% · config 20% · recency 20%. Top-matched comps best support the ARV.
Projected returns pro-forma
10.0% appreciation · 3.0% rent growth · sell at horizon
- IRR
- 26.6%
- Equity multiple
- 3.11×
- Total profit
- $117,820
- Equity at exit
- $179,275
- IRR
- 23.3%
- Equity multiple
- 7.09×
- Total profit
- $339,318
- Equity at exit
- $386,613
Cash invested: $55,720 (down + closing). Projections, not guarantees.
Landlord ↔ Tenant lean methodology
- Overall (STATE)
- 18 Strongly Tenant-Friendly
- State California
- 18 Strongly Tenant-Friendly · D+13
- County
- — inherits STATE
- City
- — inherits STATE
ZIP-level market 95573
- Home prices YoY
- 30.8%
- Active inventory
- 39
- Price-to-rent
- 9.7×
Monthly cashflow live
- Estimated rent
- $1,713 medium interval (Pro) →
- Mortgage (P&I)
- −$1,044
- Tax from tax record
- −$78 /mo · $930/yr
- Insurance
- −$83
- HOA
- −$0
- Vacancy / Maint / Mgmt
- −$360
- Net cashflow
- $149
Break-even live
UW: 25.0% down · 7.5% · 30yr · 1.5% tax · 5.0% vac · 8.0% maint · 8.0% mgmt
Financing live
Cash to close
- Down payment
- $49,750
- Closing costs
- $5,970
- Reserves months
- —
- Total cash needed
- —
Loan-product check · same deal, 3 products live
Conventional
25% down · 7.5% · 30yr
- Down + closing
- —
- Monthly P&I
- —
- Monthly cashflow
- —
- DSCR
- —
- Eligible?
- —
Personal DTI + credit; lowest rate.
DSCR
20% down · 8.5% · 30yr
- Down + closing
- —
- Monthly P&I
- —
- Monthly cashflow
- —
- DSCR
- —
- Eligible?
- —
No personal income docs; deal must DSCR.
Hard money
10% down · 12.0% · 12mo
- Down + closing
- —
- Monthly P&I
- —
- Monthly cashflow
- —
- DSCR
- —
- Eligible?
- —
Short-term bridge; refi at stabilization.
Listing history 8 events
-
2026-06-19days on market $199,000 Active 9 DOM
-
2026-06-18days on market $199,000 Active 8 DOM
-
2026-06-17days on market $199,000 Active 7 DOM
-
2026-06-16days on market $199,000 Active 6 DOM
-
2026-06-15days on market $199,000 Active 5 DOM
-
2026-06-14days on market $199,000 Active 3 DOM
-
2026-06-12remarks 544-char remark
-
2026-06-12$199,000 Active 2 DOM
ⓘ Source: listings_history table (triggers on properties + properties_extension) + one-shot
backfill from property_details.listing_events for pre-trigger history.
Tax reassessment forecast CA · Resets to sale price
- Current annual tax
- $930 · $78/mo
- Projected year-2 tax
- $1,512 · $126/mo
- Expected delta
- +$582/yr (+$49/mo · 62.6%)
ⓘ Screening estimate from a state-policy table — verify with the county assessor before closing.
Climate risk First Street
- Flood 1/10 Low FEMA zone D · 0% chance over 30 yrs
- Wildfire 6/10 Major
- Heat 5/10 Major 10 d/yr ≥101°F today · 21 d/yr by 30 yrs out
- Wind 1/10 Low
- Air quality 10/10 Extreme 39 unhealthy d/yr today · 40 by 30 yrs out
Nearby sold comps map
Loading sold comps map…
Walkable amenities ~0.75 mi
Loading nearby amenities…
Taxation est. · year 1
- Rental income
- $20,559
- − Mortgage interest
- −$11,147
- − Property taxes
- −$930
- − Insurance
- −$995
- − Repairs & maintenance
- −$1,645
- − Management
- −$1,645
- − Depreciation
- −$5,789
- Taxable loss
- −$1,592
- Est. tax savings @ 24.0%
- +$382
- After-tax cash flow
- $2,176/yr
For passive investors: Depreciation is non-cash, so a rental often shows a tax loss while cash-flowing — sheltering income. Rental losses are passive: they offset passive income freely, and up to $25,000/yr can offset ordinary (W-2) income if you actively participate and your MAGI is under $100k (phasing out to $0 by $150k); unused losses carry forward. On sale, claimed depreciation is recaptured at up to 25%, and gains may owe capital-gains tax (a 1031 exchange can defer both). Figures are a year-1 estimate at your 24.0% rate — not tax advice; consult a CPA.
Schools (NCES district)
- District
- Klamath-Trinity Joint Unified
- NCES district ID
- 0619950
- Math proficiency
- 11% ▲ 1.00%
- Reading proficiency
- 17% ▲ 2.00%
- Median HH income
- $33,475
- Composite
- 14.84/100
- National rank
- #14389
- State rank
- #1307 of 1400 in CA
Livability — Willow Creek
- Score
- 64/100
- State rank
- #422
- US rank
- #14363
Category grades
Schools grade is shown separately in the Schools card above.
Census & demographics
- Census place
- Willow Creek, CA
- Population (ZIP)
- 990
Population outlook (Humboldt County) Hauer SSP2
- Today (2025)
- 135,550 people
- By 2030
- 134,798 · -0.6%
- By 2040
- 132,222 · -2.5%
- By 2050
- 130,850 · -3.5%
- By 2075
- 128,656 · -5.1%
- By 2100
- 120,238 · -11.3%
Race, ethnicity, and origin ACS 2023
- Neighborhood character
- Predominantly White (83%)
- Race & ethnicity
- White 83% Hispanic / Latino 6% Pacific Islander 5% Native American 3%
- Hispanic origin (detail)
- Mexican 6%
- Common ancestry
- Romanian 11% Scottish 6% Italian 5%
- Foreign-born
- 3%
Political lean MEDSL · Humboldt
- 2024 margin
- Strong D (+28.4) · D 62.0% · R 33.6% · Other 4.5%
- 2008→2024 swing
- +0.2pp no change · 2008: 28.2pp · 2024: 28.4pp
- All cycles
- 2024: D+28.4 2020: D+33.4 2016: D+25.9 2012: D+26.2 2008: D+28.2
Not yet ingested
- Civics
- —
Market trends
- HPI YoY
- ▲ 55.17%
- Current HPI
- 234.21
- Rent YoY
- —
- Metro
- —
- State GDP YoY
- ▲ 3.21%
- F500 in state
- 116
Industry mix (Fortune 500 HQ in CA)
| Industry | F500 HQs | Revenue |
|---|---|---|
| Technology | 27 | $1,492B |
|
||
| Financial Services | 3 | $174B |
|
||
| Retail | 3 | $44B |
|
||
| Insurance | 3 | $26B |
|
||
| Media / Entertainment | 2 | $115B |
|
||
| Pharmaceuticals / Biotech | 2 | $62B |
|
||
Price history
+218.4% since first listed3 events — show timeline
- 2026-06-10 Listed $199,000 HAR
- 2007-06-14 Sold (Public Records) $151,500 Public Records
- 2000-01-11 Sold (Public Records) $62,500 Public Records
Property tax history
-5.8%/yrLatest (2025): $930 · -3.9% YoY. Source: county tax records.
Cash-flow waterfall
monthlySold comps — $/sqft
last 12 mo · ≤1 miLoading sold comps…