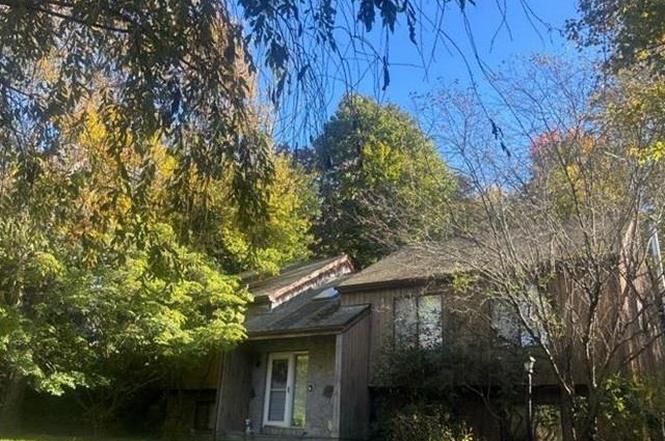
1203 Old Post RD Rte 35 · West Mountain, CT
Flood risk 1/10 · Minimal
- FEMA flood zone
- X (unshaded)
- Chance of flooding over 30 yrs
- 0.0%
- Est. flood insurance / yr
- $473 – $860
Fire risk 3/10 · Minor
- Est. fire insurance / yr
- $691 – $1,283
Heat risk 4/10 · Minor
- Hot days now (above 98°F)
- 7 days/yr
- Hot days in 30 yrs
- 16 days/yr
Wind risk 5/10 · Moderate
- Chance of severe wind over 30 yrs
- 26.0%
Air-quality risk 4/10 · Minor
- Unhealthy air days now
- 3 days/yr
- Unhealthy air days in 30 yrs
- 6 days/yr
Risk factors via First Street. Map © Google.
Why this score? — see what drove the C+ grade
The composite is a weighted blend of 9 inputs, each scored 0–100. Each bar is that input's sub-score; the figure is the points it added to the 100-point composite (weight × sub-score).
- Cash flow +18.4/30.0
- ARV discount +15.0/15.0
- Schools +7.5/10.0
- 1% rule +6.0/10.0
- DSCR +5.8/10.0
- Rent growth +2.5/5.0
- Livability +2.5/5.0
- Condition / age +2.5/5.0
- Appreciation +0.0/10.0
$592,700
🖨 Deal sheet (PDF) 📄 Offer letter ✓ Due diligence
Listing remarks
Looking for a great opportunity? Look no more! This property has tons of potential and is average in living space size for the neighborhood. It is located close to main roads with easy access to local amenities, such as shopping, banking, schools, and various eateries. Per our Appraisal describe the property as a SFR (colonial) built in 1980. It has a GLA of approx. 2100 and has 3 bedrooms and 3baths, Full/Unfinished basement and 2- ATT Garage. The property is on 27,007 sq ft lot * * * Seller cannot guarantee access at any given time. Offers may be made sight unseen * * *
Key facts
- Close to main roads
- 0.62 acre lot
- 2 garage spots
Tags
Property features AI
Exterior
- Parking: Attached 2-car parking (2 total parking spaces, 2 garage spaces)
- Utilities: Public sewer; Utilities: See remarks
- Home design: Single family residence; Living area recorded by appraiser
- Construction: Frame construction
- Exterior features: Frame construction; Not waterfront
Interior
- Kitchen: No appliances included
- Bedrooms: 6 rooms total (bedroom count not specified)
- Bathrooms: 3 full bathrooms
- Heating & cooling: Baseboard heating; Other heating; No cooling listed
- Interior features: Other interior features; Full basement
- Laundry & utility: No specific laundry appliances listed
Neighborhood map
What this means for you Summary
Snapshot
- This is a 3-bed/3.0-bath single-family listed at $593k.
Deal economics
- At list price, monthly cash flow is $548 ($7k/yr) — positive.
- The deal already cash-flows at list — no discount required.
- Meets the 1% rule at list price ($6k rent vs $593k).
- Recommended offer: $522k (12.0% below list) — sets the bar for market timing.
- Cap rate 7.4% vs local median 3.1% in West Mountain — top-decile yield for the area; either an underpriced asset or a hidden risk that comps aren't pricing in. Stress-test before assuming the spread holds.
Location & tenants
- Location reads: area grade C — affects rentability + tenant quality, not the cash-flow math above.
- Katonah-Lewisboro Union Free School District (suburban): math 75% / reading 82% proficiency, ranked #32 of 590 in NY (top 5%) — strong family-tenant draw, lease renewals of 3-5y typical; only 3% free/reduced lunch — higher-income household profile.
- Market conditions: 1 comparable units currently listed for rent nearby; 954 units permitted in Westchester County in 2024 (649 in 5+ unit buildings).
Forward outlook
- Local home prices are declining (-3.0%/yr); year-one equity from $4k of loan paydown is wiped out by about $18k of value loss. Plan a longer hold.
- Westchester County population projected at +10% by 2050 — modest demand growth; plan on rents tracking national, not racing it.
Negotiation context
- It's been on market 213 days — a 12% lower offer ($522k) is reasonable based on typical stale-listing flexibility.
- Current owner paid $105k; list at $593k implies a 464% gain — meaningful room to come down on a strong offer.
Risks & watch-outs
- Climate carrying-cost: moderate wind risk, 26% chance of damaging wind over 30y — expect insurance premiums to compound above CPI over the hold.
Questions for the listing agent
- It's been on market 213 days. Have you received any prior offers? Is the seller open to a 12% concession, seller financing, or rate buy-down credit?
- Why hasn't it sold? Are there any deal-killer items the seller is aware of (foundation, flood, title, zoning, code violations)?
- Is there a deadline driving the sale (1031 exchange, divorce, estate, relocation)? That informs how much negotiation room exists.
- What's the average days-on-market for RENTAL listings here right now (not sales)? A rising rental-DOM trend means longer vacancies and softer asking-rent achievability than the comps imply.
- What's the recent tenant-quality profile in this submarket — average credit score on applications, eviction rate, late-payment / NSF rate, and stable-employment percentage? A property-management company in the area should have these aggregated.
- How much new for-sale + rental construction is in the pipeline within 1–3 miles? Heavy new supply typically softens prices + rents 12–24 months out; constrained supply supports both.
Investment metrics
- 1% rule
- 1.10% ✓
- Cap rate
- 7.40%
- Cash-on-cash
- 3.96%
- DSCR
- 1.18
- GRM
- 7.6
CMA / ARV
- ARV (on-the-fly)
- $1,157,100
- Comps found
- 4
Show comp detail 4 sales within ~0.75 mi
| Address | Dist | Beds/Ba | Sqft | Sold | Price | $/sf | Match |
|---|---|---|---|---|---|---|---|
| 7 Main St | 0.55mi | 3/2.5 | 2,116 (+1%) | 9mo | $999,000 | $472 | 63 |
| 21 Lake Shore Dr | 0.65mi | 2/3.0 (-1) | 1,940 (-8%) | 8mo | $1,325,000 | $683 | 45 |
| 52 Bouton Rd | 0.58mi | 4/2.5 (+1) | 2,284 (+9%) | 23mo | $1,075,000 | $471 | 32 |
| 3 Truesdale Lake Dr | 0.70mi | 2/3.0 (-1) | 2,404 (+14%) | 8mo | $1,325,000 | $551 | 32 |
Match score weights: distance 35% · size 25% · config 20% · recency 20%. Top-matched comps best support the ARV.
Projected returns pro-forma
-3.0% appreciation · 3.0% rent growth · sell at horizon
- IRR
- -10.0%
- Equity multiple
- 0.63×
- Total profit
- $-60,732
- Equity at exit
- $88,373
- IRR
- -0.5%
- Equity multiple
- 0.96×
- Total profit
- $-6,307
- Equity at exit
- $51,246
Cash invested: $165,956 (down + closing). Projections, not guarantees.
Landlord ↔ Tenant lean methodology
- Overall (STATE)
- 27 Tenant-Leaning
- State Connecticut
- 27 Tenant-Leaning · D+7
- County
- — inherits STATE
- City
- — inherits STATE
ZIP-level market 10590
- Home prices YoY
- -30.8%
- Price-to-rent
- 7.6×
Monthly cashflow live
- Estimated rent
- $6,500 medium interval (Pro) →
- Mortgage (P&I)
- −$3,108
- Tax from tax record
- −$1,232 /mo · $14,781/yr
- Insurance
- −$247
- HOA
- −$0
- Vacancy / Maint / Mgmt
- −$1,365
- Net cashflow
- $548
Break-even live
Sensitivity live
| Price | -10% $884 | -5% $716 | +0% $548 | +5% $380 | +10% $213 |
|---|---|---|---|---|---|
| Rent | -10% $35 | -5% $291 | +0% $548 | +5% $805 | +10% $1,062 |
| Rate | -1.0pp $847 | -0.5pp $699 | base $548 | +0.5pp $395 | +1.0pp $238 |
UW: 25.0% down · 7.5% · 30yr · 1.5% tax · 5.0% vac · 8.0% maint · 8.0% mgmt
Financing live
Cash to close
- Down payment
- $148,175
- Closing costs
- $17,781
- Reserves months
- —
- Total cash needed
- —
Loan-product check · same deal, 3 products live
Conventional
25% down · 7.5% · 30yr
- Down + closing
- —
- Monthly P&I
- —
- Monthly cashflow
- —
- DSCR
- —
- Eligible?
- —
Personal DTI + credit; lowest rate.
DSCR
20% down · 8.5% · 30yr
- Down + closing
- —
- Monthly P&I
- —
- Monthly cashflow
- —
- DSCR
- —
- Eligible?
- —
No personal income docs; deal must DSCR.
Hard money
10% down · 12.0% · 12mo
- Down + closing
- —
- Monthly P&I
- —
- Monthly cashflow
- —
- DSCR
- —
- Eligible?
- —
Short-term bridge; refi at stabilization.
Rent comps 1 comps
| Address | Beds | Baths | Sqft | Rent | $/sqft | DOM | Units | Dist |
|---|---|---|---|---|---|---|---|---|
| 68 Lake Shore Dr South Salem, NY | 4.0 | 2.5 | 2430 | $6,500 | $2.67 | 15d | 1 | 0.73mi |
Listing history 26 events
-
2026-06-18days on market $592,700 Active 213 DOM
-
2026-06-17days on market $592,700 Active 212 DOM
-
2026-06-16days on market $592,700 Active 211 DOM
-
2026-06-15days on market $592,700 Active 210 DOM
-
2026-06-13days on market $592,700 Active 208 DOM
-
2026-06-13days on market $592,700 Active 207 DOM
-
2026-06-10days on market $592,700 Active 205 DOM
-
2026-06-09days on market $592,700 Active 204 DOM
-
2026-06-08days on market $592,700 Active 203 DOM
-
2026-06-07days on market $592,700 Active 202 DOM
-
2026-06-05days on market $592,700 Active 199 DOM
-
2026-06-03days on market $592,700 Active 198 DOM
-
2026-06-03days on market $592,700 Active 197 DOM
-
2026-06-01days on market $592,700 Active 196 DOM
-
2026-05-31days on market $592,700 Active 195 DOM
-
2026-05-08price $596,000
-
2026-04-20price $599,000
-
2026-03-31price $608,800
-
2026-03-12price $612,800
-
2026-02-12price $615,900
-
2026-01-23price $619,000
-
2026-01-07price $623,800
-
2025-12-22price $667,300
-
2025-12-04price $723,700
-
2025-11-17$757,900 Active
-
1983-03-01soldstatus $105,000
ⓘ Source: listings_history table (triggers on properties + properties_extension) + one-shot
backfill from property_details.listing_events for pre-trigger history.
Tax reassessment forecast CT · Partial reset (capped growth)
- Current annual tax
- $14,781 · $1,232/mo
- Projected year-2 tax
- $14,781 · $1,232/mo
- Expected delta
- $0/yr ($0/mo · 0.0%)
ⓘ Screening estimate from a state-policy table — verify with the county assessor before closing.
Climate risk First Street
- Flood 1/10 Low FEMA zone X (unshaded) · 0% chance over 30 yrs
- Wildfire 3/10 Moderate
- Heat 4/10 Moderate 7 d/yr ≥98°F today · 16 d/yr by 30 yrs out
- Wind 5/10 Major 26% chance of damaging wind over 30 yrs
- Air quality 4/10 Moderate 3 unhealthy d/yr today · 6 by 30 yrs out
Nearby sold comps map
Loading sold comps map…
Walkable amenities ~0.75 mi
Loading nearby amenities…
Taxation est. · year 1
- Rental income
- $78,000
- − Mortgage interest
- −$33,200
- − Property taxes
- −$14,781
- − Insurance
- −$2,964
- − Repairs & maintenance
- −$6,240
- − Management
- −$6,240
- − Depreciation
- −$17,242
- Taxable loss
- −$2,667
- Est. tax savings @ 24.0%
- +$640
- After-tax cash flow
- $7,218/yr
For passive investors: Depreciation is non-cash, so a rental often shows a tax loss while cash-flowing — sheltering income. Rental losses are passive: they offset passive income freely, and up to $25,000/yr can offset ordinary (W-2) income if you actively participate and your MAGI is under $100k (phasing out to $0 by $150k); unused losses carry forward. On sale, claimed depreciation is recaptured at up to 25%, and gains may owe capital-gains tax (a 1031 exchange can defer both). Figures are a year-1 estimate at your 24.0% rate — not tax advice; consult a CPA.
Schools (NCES district)
- District
- Katonah-Lewisboro Union Free School District
- NCES district ID
- 3616080
- Math proficiency
- 75% ▼ -8.00%
- Reading proficiency
- 82% ▲ 2.00%
- Median HH income
- $140,994
- Composite
- 75.09/100
- National rank
- #142
- State rank
- #32 of 590 in NY
Livability — West Mountain
No livability data for this city. (Only ~50 U.S. cities are tracked.)
Census & demographics
- Population (ZIP)
- 7,314
Population outlook (Westchester County) Hauer SSP2
- Today (2025)
- 1,028,035 people
- By 2030
- 1,051,636 · +2.3%
- By 2040
- 1,098,520 · +6.9%
- By 2050
- 1,136,044 · +10.5%
- By 2075
- 1,196,925 · +16.4%
- By 2100
- 1,175,147 · +14.3%
Race, ethnicity, and origin ACS 2023
- Neighborhood character
- Predominantly White (84%)
- Race & ethnicity
- White 84% Two or more races 8% Hispanic / Latino 6% Asian 4% Black 1%
- Hispanic origin (detail)
- Puerto Rican 3%
- Common ancestry
- Italian 4% Romanian 3% Scotch-Irish 2%
- Foreign-born
- 13% · Canada, South Korea, Jamaica
- Languages at home
- 90% English-only · Spanish 4% Other Indo-European 2% Korean 1%
Political lean MEDSL · Westchester
- 2024 margin
- Strong D (+26.3) · D 63.1% · R 36.9%
- 2008→2024 swing
- -1.3pp toward R · 2008: 27.6pp · 2024: 26.3pp
- All cycles
- 2024: D+26.3 2020: D+36.3 2016: D+32.8 2012: D+22.2 2008: D+27.6
Not yet ingested
- Civics
- —
Market trends
- HPI YoY
- ▼ -66.87%
- Current HPI
- 150.088
- Rent YoY
- —
- Metro
- —
- State GDP YoY
- ▲ 1.06%
- F500 in state
- 38
Industry mix (Fortune 500 HQ in CT)
| Industry | F500 HQs | Revenue |
|---|---|---|
| Industrial Machinery | 4 | $38B |
|
||
| Insurance | 3 | $71B |
|
||
| Financial Services | 2 | $25B |
|
||
| Transportation / Logistics | 2 | $18B |
|
||
| Healthcare | 1 | $247B |
|
||
| Telecommunications | 1 | $55B |
|
||
Price history
+467.6% since first listed11 events — show timeline
- 2026-05-08 Price Changed $596,000 OneKey® MLS as Distributed by MLS Grid
- 2026-04-20 Price Changed $599,000 OneKey® MLS as Distributed by MLS Grid
- 2026-03-31 Price Changed $608,800 OneKey® MLS as Distributed by MLS Grid
- 2026-03-12 Price Changed $612,800 OneKey® MLS as Distributed by MLS Grid
- 2026-02-12 Price Changed $615,900 OneKey® MLS as Distributed by MLS Grid
- 2026-01-23 Price Changed $619,000 OneKey® MLS as Distributed by MLS Grid
- 2026-01-07 Price Changed $623,800 OneKey® MLS as Distributed by MLS Grid
- 2025-12-22 Price Changed $667,300 OneKey® MLS as Distributed by MLS Grid
- 2025-12-04 Price Changed $723,700 OneKey® MLS as Distributed by MLS Grid
- 2025-11-17 Listed $757,900 OneKey® MLS as Distributed by MLS Grid
- 1983-03-01 Sold (Public Records) $105,000 Public Records
Property tax history
+5.6%/yrLatest (2025): $14,781 · +17.5% YoY. Source: county tax records.
Cash-flow waterfall
monthlySold comps — $/sqft
last 12 mo · ≤1 miLoading sold comps…