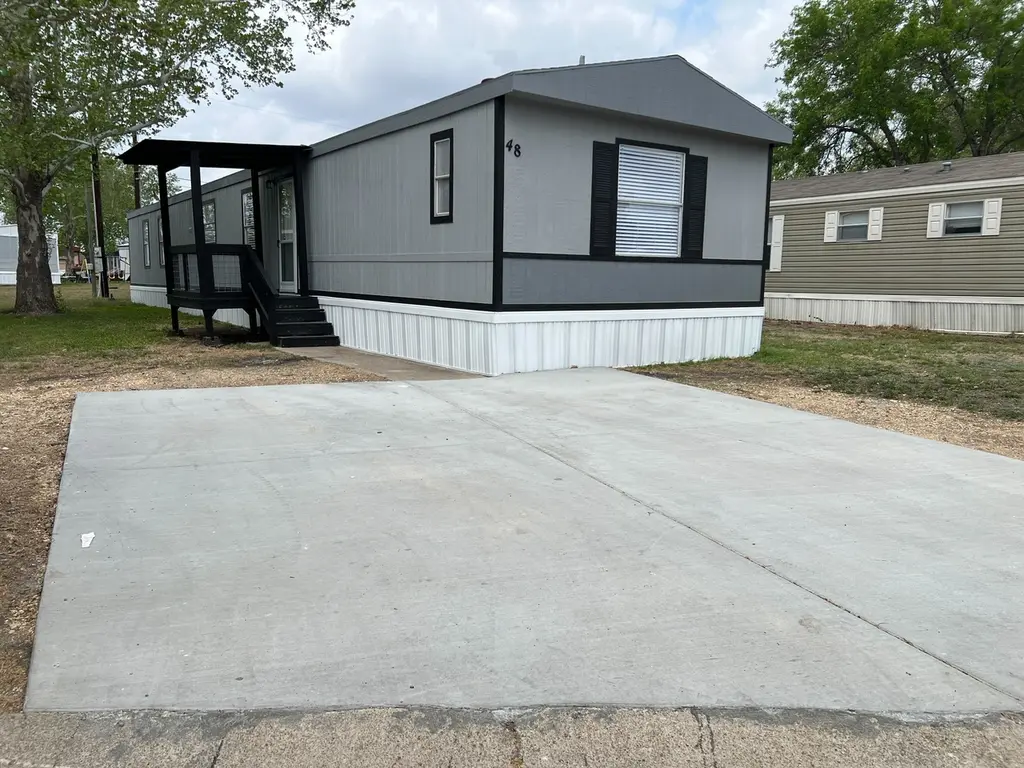
750 Silent Valley Rd #48 · Lockhart, TX
Flood risk 1/10 · Minimal
- FEMA flood zone
- X (unshaded)
- Chance of flooding over 30 yrs
- 0.0%
- Est. flood insurance / yr
- $507 – $1,088
Fire risk 5/10 · Moderate
- Est. fire insurance / yr
- $1,222 – $2,270
Heat risk 8/10 · Major
- Hot days now (above 108°F)
- 7 days/yr
- Hot days in 30 yrs
- 22 days/yr
Wind risk 8/10 · Major
- Chance of severe wind over 30 yrs
- 80.0%
Air-quality risk 1/10 · Minimal
- Unhealthy air days now
- 0 days/yr
- Unhealthy air days in 30 yrs
- 0 days/yr
Risk factors via First Street. Map © Google.
Why this score? — see what drove the B- grade
The composite is a weighted blend of 9 inputs, each scored 0–100. Each bar is that input's sub-score; the figure is the points it added to the 100-point composite (weight × sub-score).
- Cash flow +30.0/30.0
- 1% rule +10.0/10.0
- DSCR +10.0/10.0
- ARV discount +7.5/15.0
- Condition / age +4.0/5.0
- Livability +3.4/5.0
- Rent growth +2.5/5.0
- Schools +2.4/10.0
- Appreciation +0.0/10.0
$52,900
🖨 Deal sheet 📄 Offer letter ✓ Due diligence
Listing remarks MLS
TAX SEASON IS HERE! STOP RENTING AND BUY A HOME TODAY! Stunning 3 Bedroom Home For Rent! 3 Bedrooms | 2 Bathrooms | 1,216 Sq Ft This modern home has it all: Large master bathroom Vinyl wood flooring throughout Spacious family room with dining area Big kitchen, perfect for entertaining Spacious laundry room with extra storage Move In ready condition Community Perks: Basketball court Brand new playground Designated parking Pet Friendly community Fresh new roads This home is available for rent at $1,399 per month and yes, you can own it for just $52,900. Message us today to schedule your tour. Your future home is waiting. Photos may be virtually staged. Visit in person to see the home for yourself.
Key facts
- Vinyl wood flooring
- Extra storage
- Big kitchen
Tags
Neighborhood map
What this means for you Summary
Snapshot
- This is a 3-bed/2.0-bath manufactured listed at $53k. Condition is rated good.
Deal economics
- At list price, monthly cash flow is $896 ($11k/yr) — positive.
- The deal already cash-flows at list — no discount required.
- Meets the 1% rule at list price ($2k rent vs $53k).
- Recommended offer: $50k (6.0% below list) — sets the bar for market timing.
- Cap rate 26.6% vs local median 3.0% in Lockhart — top-decile yield for the area; either an underpriced asset or a hidden risk that comps aren't pricing in. Stress-test before assuming the spread holds.
Location & tenants
- Location reads 67/100 on livability (#535 in TX) — a middle-class / working-renter tenant base. Strengths: cost of living A+, housing A+, crime B+; Watch: schools D-, amenities F, commute F.
- Lockhart ISD (town): math 27% / reading 29% proficiency, ranked #657 of 826 in TX (top 80%) — low school quality limits family demand, transient renter base, plan for 1-2y turnover; 62% free/reduced lunch — lower-income household profile, screen leases tightly.
- Market conditions: 452 active listings in the ZIP; 20 comparable units currently listed for rent nearby; rentals lingering (median 44d on market — plan ~5-8 weeks vacancy on turnover, expect pricing pressure); 55% of comp listings sitting > 30 days — soft ceiling on asking rent; 529 units permitted in Caldwell County in 2024 (6 in 5+ unit buildings).
Forward outlook
- Local home prices are declining (-3.0%/yr); year-one equity from $366 of loan paydown is wiped out by about $2k of value loss. Plan a longer hold.
- Caldwell County population projected at +33% by 2050 — long-run rental-demand tailwind backs the buy-and-hold thesis.
- At projected returns (-3.0% appreciation + 3.0% rent growth), your $15k cash investment doubles in ~2 years — after that, you're playing with house money.
Negotiation context
- It's been on market 61 days — a 6% lower offer ($50k) is reasonable based on typical stale-listing flexibility.
- 2 sale attempts; this cycle's ask is 3681% above the opening price — seller raised mid-cycle; expect resistance to lowballs.
Risks & watch-outs
- Climate carrying-cost: severe wind risk, 80% chance of damaging wind over 30y; moderate wildfire risk; extreme-heat days projected 7→22/yr by 2055 (HVAC capex compounding) — expect insurance premiums to compound above CPI over the hold.
Questions for the listing agent
- It's been on market 61 days. Have you received any prior offers? Is the seller open to a 6% concession, seller financing, or rate buy-down credit?
- Why hasn't it sold? Are there any deal-killer items the seller is aware of (foundation, flood, title, zoning, code violations)?
- Is there a deadline driving the sale (1031 exchange, divorce, estate, relocation)? That informs how much negotiation room exists.
- Schools are D-rated, which usually means shorter tenancies and higher turnover. Who's the typical renter profile here, and what's been the actual vacancy rate?
- What's the average days-on-market for RENTAL listings here right now (not sales)? A rising rental-DOM trend means longer vacancies and softer asking-rent achievability than the comps imply.
- What's the recent tenant-quality profile in this submarket — average credit score on applications, eviction rate, late-payment / NSF rate, and stable-employment percentage? A property-management company in the area should have these aggregated.
- How much new for-sale + rental construction is in the pipeline within 1–3 miles? Heavy new supply typically softens prices + rents 12–24 months out; constrained supply supports both.
Investment metrics
- 1% rule
- 3.02% ✓
- Cap rate
- 26.61%
- Cash-on-cash
- 72.57%
- DSCR
- 4.23
- GRM
- 2.8
CMA / ARV
No comps found within radius.
Projected returns pro-forma
-3.0% appreciation · 3.0% rent growth · sell at horizon
- IRR
- 72.3%
- Equity multiple
- 4.27×
- Total profit
- $48,502
- Equity at exit
- $7,888
- IRR
- 76.2%
- Equity multiple
- 8.82×
- Total profit
- $115,793
- Equity at exit
- $4,574
Cash invested: $14,812 (down + closing). Projections, not guarantees.
Landlord ↔ Tenant lean methodology
- Overall (STATE)
- 87 Strongly Landlord-Friendly
- State Texas
- 87 Strongly Landlord-Friendly · R+5
- County
- — inherits STATE
- City
- — inherits STATE
ZIP-level market 78644
- Home prices YoY
- -29.4%
- Active inventory
- 452
- Price-to-rent
- 2.8×
Monthly cashflow live
- Estimated rent
- $1,597 high interval (Pro) →
- Mortgage (P&I)
- −$277
- Tax est. 1.5%
- −$66 /mo · $794/yr
- Insurance
- −$22
- HOA
- −$0
- Vacancy / Maint / Mgmt
- −$335
- Net cashflow
- $896
Break-even live
UW: 25.0% down · 7.5% · 30yr · 1.5% tax · 5.0% vac · 8.0% maint · 8.0% mgmt
Financing live
Cash to close
- Down payment
- $13,225
- Closing costs
- $1,587
- Reserves months
- —
- Total cash needed
- —
Loan-product check · same deal, 3 products live
Conventional
25% down · 7.5% · 30yr
- Down + closing
- —
- Monthly P&I
- —
- Monthly cashflow
- —
- DSCR
- —
- Eligible?
- —
Personal DTI + credit; lowest rate.
DSCR
20% down · 8.5% · 30yr
- Down + closing
- —
- Monthly P&I
- —
- Monthly cashflow
- —
- DSCR
- —
- Eligible?
- —
No personal income docs; deal must DSCR.
Hard money
10% down · 12.0% · 12mo
- Down + closing
- —
- Monthly P&I
- —
- Monthly cashflow
- —
- DSCR
- —
- Eligible?
- —
Short-term bridge; refi at stabilization.
Rent comps 20 comps
| Address | Beds | Baths | Sqft | Rent | $/sqft | DOM | Units | Dist |
|---|---|---|---|---|---|---|---|---|
| 150 Tonkawa Trl Unit 150 Lockhart, TX | 3.0 | 2.0 | 1216 | $1,499 | $1.23 | 43d | 1 | 0.11mi |
| 606 Guadalimar St Lockhart, TX | 4.0 | 2.0 | 1036 | $1,700 | $1.64 | 43d | 1 | 0.55mi |
| 1100 Monte Vista Dr Lockhart, TX | 3.0 | 2.0 | 1154 | $1,850 | $1.60 | 17d | 1 | 0.57mi |
| 1309 Monte Vista Dr Lockhart, TX | 3.0 | 2.0 | 1349 | $1,550 | $1.15 | 43d | 1 | 0.71mi |
| 329 Flores St Lockhart, TX | 2.0 | 1.0 | 1116 | $1,500 | $1.34 | 43d | 1 | 0.73mi |
| 1320 Wilson St Unit 236 Lockhart, TX | 2.0 | 1.0 | 853 | $759 | $0.89 | 43d | 1 | 0.78mi |
| 518 Laredo St Lockhart, TX | 2.0 | 1.0 | 720 | $1,050 | $1.46 | 43d | 1 | 0.80mi |
| 1015 Fir Ln Lockhart, TX | 2.0 | 1.0 | 900 | $1,100 | $1.22 | 11d | 1 | 0.84mi |
| 1015 Fir Ln Lockhart, TX | 2.0 | 1.0 | 900 | $1,100 | $1.22 | 4d | 1 | 0.84mi |
| 728 W San Antonio St Unit 730 A Lockhart, TX | 2.0 | 1.0 | 944 | $1,000 | $1.06 | 4d | 1 | 0.89mi |
| 728 W San Antonio St Lockhart, TX | 2.0 | 1.0 | 944 | $1,125 | $1.19 | 4d | 1 | 0.89mi |
| 115 S Frio St Unit H Lockhart, TX | 2.0 | 1.5 | 959 | $1,125 | $1.17 | 43d | 1 | 0.94mi |
| 115 S Frio St Unit A Lockhart, TX | 2.0 | 1.5 | 959 | $1,125 | $1.17 | 4d | 1 | 0.94mi |
| 100 N Brazos St Lockhart, TX | 3.0 | 1.0 | 1299 | $1,600 | $1.23 | 23d | 1 | 1.11mi |
| 117 Quail Cv Unit A Lockhart, TX | 3.0 | 2.0 | 1250 | $1,575 | $1.26 | 17d | 1 | 1.23mi |
| 331 N Richland Dr Lockhart, TX | 3.0 | 2.0 | 1281 | $1,800 | $1.41 | 43d | 1 | 1.31mi |
| 1702 Miller Ter Lockhart, TX | 3.0 | 2.0 | 1253 | $1,895 | $1.51 | 43d | 1 | 1.34mi |
| 413 Abbey Ln Lockhart, TX | 3.0 | 2.0 | 1297 | $1,750 | $1.35 | 23d | 1 | 1.40mi |
| 903 E Live Oak St Unit A Lockhart, TX | 3.0 | 1.0 | 800 | $1,300 | $1.62 | 43d | 1 | 1.41mi |
| 903 E Live Oak St Unit B Lockhart, TX | 3.0 | 1.0 | 1200 | $1,450 | $1.21 | 43d | 1 | 1.41mi |
Listing history 11 events
-
2026-06-09days on market $52,900 Active 61 DOM
-
2026-06-08days on market $52,900 Active 60 DOM
-
2026-06-07days on market $52,900 Active 59 DOM
-
2026-06-04days on market $52,900 Active 56 DOM
-
2026-06-03days on market $52,900 Active 55 DOM
-
2026-06-02days on market $52,900 Active 54 DOM
-
2026-06-01days on market $52,900 Active 53 DOM
-
2026-05-31days on market $52,900 Active 52 DOM
-
2026-05-16price $1,509
-
2026-04-10$1,399
-
2026-04-09$52,900 Active 710-char remark
Show marketing remark (710 chars)
TAX SEASON IS HERE! STOP RENTING AND BUY A HOME TODAY! Stunning 3 Bedroom Home For Rent! 3 Bedrooms | 2 Bathrooms | 1,216 Sq Ft This modern home has it all: Large master bathroom Vinyl wood flooring throughout Spacious family room with dining area Big kitchen, perfect for entertaining Spacious laundry room with extra storage Move In ready condition Community Perks: Basketball court Brand new playground Designated parking Pet Friendly community Fresh new roads This home is available for rent at $1,399 per month and yes, you can own it for just $52,900. Message us today to schedule your tour. Your future home is waiting. Photos may be virtually staged. Visit in person to see the home for yourself.
ⓘ Source: listings_history table (triggers on properties + properties_extension) + one-shot
backfill from property_details.listing_events for pre-trigger history.
Climate risk First Street
- Flood 1/10 Low FEMA zone X (unshaded) · 0% chance over 30 yrs
- Wildfire 5/10 Major
- Heat 8/10 Severe 7 d/yr ≥108°F today · 22 d/yr by 30 yrs out
- Wind 8/10 Severe 80% chance of damaging wind over 30 yrs
- Air quality 1/10 Low 0 unhealthy d/yr today · 0 by 30 yrs out
Nearby sold comps map
Loading sold comps map…
Walkable amenities ~0.75 mi
Loading nearby amenities…
Taxation est. · year 1
- Rental income
- $19,159
- − Mortgage interest
- −$2,963
- − Property taxes
- −$794
- − Insurance
- −$264
- − Repairs & maintenance
- −$1,533
- − Management
- −$1,533
- − Depreciation
- −$1,539
- Taxable income
- $10,534
- Est. tax owed @ 24.0%
- −$2,528
- After-tax cash flow
- $8,221/yr
For passive investors: Depreciation is non-cash, so a rental often shows a tax loss while cash-flowing — sheltering income. Rental losses are passive: they offset passive income freely, and up to $25,000/yr can offset ordinary (W-2) income if you actively participate and your MAGI is under $100k (phasing out to $0 by $150k); unused losses carry forward. On sale, claimed depreciation is recaptured at up to 25%, and gains may owe capital-gains tax (a 1031 exchange can defer both). Figures are a year-1 estimate at your 24.0% rate — not tax advice; consult a CPA.
Condition & rehab AI · 1 photo
This move-in ready manufactured home is in excellent condition with no visible repairs needed. It offers a good return on investment with updates that can significantly increase its resale and rental value.
Value-add opportunities
- Both Painting exterior and interior — Enhances curb appeal and interior aesthetics
- Both Landscaping and curb appeal improvements — Improves curb appeal and enhances property value
- Both New flooring in bathrooms and kitchen — Enhances functionality and aesthetics
- Both New window treatments — Enhances curb appeal and interior aesthetics
Renovation cost estimate screening
Value-add ROI direction
- Both Painting exterior and interior — Enhances curb appeal and interior aesthetics ↑
- Both Landscaping and curb appeal improvements — Improves curb appeal and enhances property value ↑
- Both New flooring in bathrooms and kitchen — Enhances functionality and aesthetics ↑
- Both New window treatments — Enhances curb appeal and interior aesthetics ↑
ⓘ Cost ranges are severity-bucket heuristics (US national rule-of-thumb). Get contractor quotes + a written scope before underwriting a rehab budget.
Schools (NCES district)
- District
- Lockhart ISD
- NCES district ID
- 4827870
- Math proficiency
- 27% ▼ -12.00%
- Reading proficiency
- 29% ▼ -2.00%
- Median HH income
- $48,868
- Composite
- 24.44/100
- National rank
- #7674
- State rank
- #657 of 826 in TX
Livability — Lockhart
- Score
- 67/100
- State rank
- #535
- US rank
- #10453
Category grades
Schools grade is shown separately in the Schools card above.
Census & demographics
- Census place
- Lockhart, TX
- County
- Caldwell County · 25,195 people
- City population
- 22,348
- Metro
- Austin-Round Rock-Georgetown, TX
- Population (ZIP)
- 22,348
- Household income
- $74,709
- Rent vs Own
- Severe rent burden
- 324.0
Population outlook (Caldwell County) Hauer SSP2
- Today (2025)
- 46,557 people
- By 2030
- 49,673 · +6.7%
- By 2040
- 55,827 · +19.9%
- By 2050
- 61,832 · +32.8%
- By 2075
- 77,212 · +65.8%
- By 2100
- 89,225 · +91.6%
Race, ethnicity, and origin ACS 2023
- Neighborhood character
- Diverse neighborhood (Simpson 0.57)
- Race & ethnicity
- Hispanic / Latino 52% White 39% Two or more races 23% Black 4% Asian 1%
- Hispanic origin (detail)
- Mexican 45% Puerto Rican 2%
- Common ancestry
- Italian 1% Lithuanian 1% Serbian 1%
- Foreign-born
- 9% · Canada
- Languages at home
- 67% English-only · Spanish 32%
Political lean MEDSL · Caldwell
- 2024 margin
- R (+14.4) · D 42.2% · R 56.6% · Other 1.2%
- 2008→2024 swing
- -8.4pp toward R · 2008: -6.0pp · 2024: -14.4pp
- All cycles
- 2024: R+14.4 2020: R+9.1 2016: R+15.8 2012: R+11.1 2008: R+6.0
Not yet ingested
- Civics
- —
Market trends
- HPI YoY
- ▼ -99.62%
- Current HPI
- 239.7906
- Rent YoY
- —
- Metro
- Austin-Round Rock-Georgetown, TX
- State GDP YoY
- ▲ 3.95%
- F500 in state
- 110
Industry mix (Fortune 500 HQ in TX)
| Industry | F500 HQs | Revenue |
|---|---|---|
| Energy | 16 | $1,198B |
|
||
| Technology | 5 | $198B |
|
||
| Engineering / Construction | 4 | $72B |
|
||
| Energy Services | 3 | $60B |
|
||
| Utilities | 3 | $41B |
|
||
| Healthcare | 2 | $330B |
|
||
Price history
-97.1% since first listed3 events — show timeline
- 2026-05-16 Price Changed $1,509 ZUMPER1
- 2026-04-10 Listed for Rent $1,399 ZUMPER1
- 2026-04-09 Listed $52,900 Zillow
Cash-flow waterfall
monthlySold comps — $/sqft
last 12 mo · ≤1 miLoading sold comps…