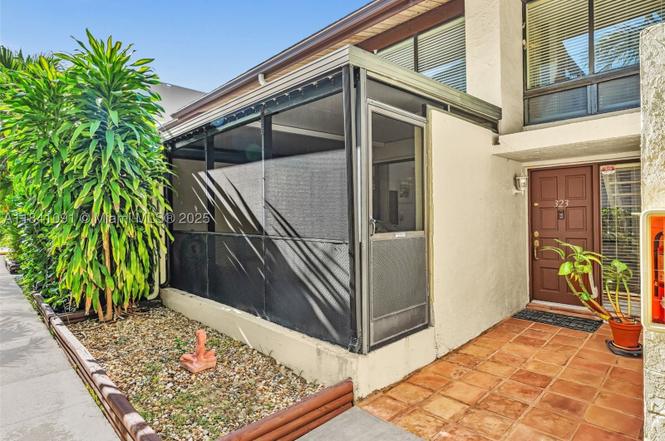
19200 NE 25th Ave Unit 323C · Ojus, FL
Flood risk 7/10 · Major
- FEMA flood zone
- AE
- Chance of flooding over 30 yrs
- 0.75%
- Est. flood insurance / yr
- $1,737 – $8,500
Fire risk 1/10 · Minimal
- Est. fire insurance / yr
- $947 – $1,759
Heat risk 10/10 · Severe
- Hot days now (above 104°F)
- 7 days/yr
- Hot days in 30 yrs
- 28 days/yr
Wind risk 10/10 · Severe
- Chance of severe wind over 30 yrs
- 99.0%
Air-quality risk 2/10 · Minimal
- Unhealthy air days now
- 2 days/yr
- Unhealthy air days in 30 yrs
- 2 days/yr
Risk factors via First Street. Map © Google.
Why this score? — see what drove the D+ grade
The composite is a weighted blend of 9 inputs, each scored 0–100. Each bar is that input's sub-score; the figure is the points it added to the 100-point composite (weight × sub-score).
- Cash flow +15.5/30.0
- ARV discount +7.5/15.0
- 1% rule +7.0/10.0
- DSCR +4.8/10.0
- Schools +4.2/10.0
- Livability +4.2/5.0
- Condition / age +2.5/5.0
- Rent growth +2.1/5.0
- Appreciation +0.0/10.0
$409,000
🖨 Deal sheet (PDF) 📄 Offer letter ✓ Due diligence
Listing remarks
Rare opportunity in the heart of the Aventura area! PETS WELCOME. ASSESSMENT PAID IN FULL. MAINTENANCE INCLUDES RESERVES. Water, cable, and high-speed internet are included. This spacious 1,590 SQFT townhouse offers 3 large bedrooms, 2 bathrooms, abundant closet space, a modern kitchen, tile floors throughout, a beautifully remodeled primary bathroom, and an in-unit washer and dryer. Enjoy indoor-outdoor living with a covered front patio and a screened back patio, perfect for relaxing or entertaining year-round. Located in a gated 11-acre community surrounded by nature and the peaceful Enchanted Lake, residents enjoy a unique waterfront lifestyle ideal for kayaking and scenic walks. RECENT
Key facts
- Gated community
- 11-acre community
- Modern kitchen
Tags
Property features AI
Finance
- Financial info: Pets allowed with size limit (more than 20 lbs permitted)
- HOA & community: Monthly association fee; Association fee covers cable TV, insurance, internet, structure maintenance, recreation facilities, roof, trash, and water; Community amenities include basketball court, clubhouse, community kitchen, playground, and pool; Community size: 128 units
Exterior
- Parking: Assigned parking; Guest parking; One assigned space
- Security: Closed-circuit camera(s); Key card entry; Smoke detector(s)
- Utilities: Cable available
- Home design: 2-story property; Entry level: 1; Faces north; Updated/remodeled condition; Attached property
- Construction: Block construction; Resale property
- Exterior features: Balcony; Enclosed porch; Screened porch; Storm/security shutters; Wall fencing; Exterior lighting; Association pool
Interior
- Kitchen: Kitchen island; Dishwasher; Electric range; Microwave; Disposal; Refrigerator
- Bedrooms: Bedroom on main level; Loft (additional living/bedroom space)
- Flooring: Hardwood; Tile; Wood
- Bathrooms: 2 full bathrooms; 1 half bathroom; Dual sinks in bath area
- Heating & cooling: Central heating; Central air conditioning; Ceiling fan(s)
- Interior features: Blinds on windows; Furnishing negotiable; Closet cabinetry; Dual sinks; First-floor entry; Kitchen island; Combined living/dining area; Main living area on entry level; Upper-level primary suite; Walk-in closet(s); Loft
- Laundry & utility: Washer; Dryer; Electric water heater
Neighborhood map
What this means for you Summary
Snapshot
- This is a 2-bed/2.0-bath condo listed at $409k.
Deal economics
- At list price, monthly cash flow is $-259 ($-3k/yr) — negative.
- To cash-flow at today's rent, offer at most $372k (9.1% below list).
- Meets the 1% rule at list price ($5k rent vs $409k).
- Recommended offer: $360k (12.0% below list) — sets the bar for market timing.
- Cap rate 6.8% vs local median 8.7% in Ojus — below-typical yield; the buyer is paying a premium for something (appreciation thesis, condition, location) that the cap rate doesn't capture.
Location & tenants
- Location reads 83/100 on livability (#58 in FL, #1,031 nationally) — a professional / high-income tenant draw. Strengths: commute A+, housing A+, health & safety A+; Watch: schools D+, amenities F.
- Miami-Dade (suburban): math 45% / reading 54% proficiency, ranked #40 of 73 in FL (top 55%) — families likely to look elsewhere, expect single-tenant / working-renter base with shorter leases; 64% free/reduced lunch — lower-income household profile, screen leases tightly.
- Market conditions: Rents soft (-1.5%/yr); 985 active listings in the ZIP; solid renter incomes; 10,051 units permitted in Miami-Dade County in 2024 (7,758 in 5+ unit buildings).
- At $4,927/mo this rent would consume 65% of the median local household income ($91k/yr) (locally 1838% of renters already pay >50% of income on rent) — very limited rent-growth headroom before tenants either downsize or default.
Forward outlook
- Local home prices are declining (-3.0%/yr); year-one equity from $3k of loan paydown is wiped out by about $12k of value loss. Plan a longer hold.
- Miami-Dade County population projected at +28% by 2050 — long-run rental-demand tailwind backs the buy-and-hold thesis.
Negotiation context
- It's been on market 267 days — a 12% lower offer ($360k) is reasonable based on typical stale-listing flexibility.
- 2 sale attempts with the ask held roughly flat each time — persistent listings suggest the price (not the market) is what's stuck; bring a comps-based counter.
- Current owner paid $133k; list at $409k implies a 208% gain — meaningful room to come down on a strong offer.
Risks & watch-outs
- Watch-outs: flood insurance adds $427/mo.
- Climate carrying-cost: in FEMA flood zone AE (mandatory federal flood insurance); severe wind risk, 99% chance of damaging wind over 30y; extreme-heat days projected 7→28/yr by 2055 (HVAC capex compounding) — expect insurance premiums to compound above CPI over the hold.
Questions for the listing agent
- What do current leases actually rent for vs. the listed asking? Can we see a recent rent roll and the last 12 months of T-12 income?
- It's been on market 267 days. Have you received any prior offers? Is the seller open to a 12% concession, seller financing, or rate buy-down credit?
- Built in 1974 — when were the roof, HVAC, electrical panel, plumbing, and water heater last replaced?
- What's the actual annual flood-insurance premium (NFIP or private), and is the property in a SFHA with mandatory coverage?
- What does the HOA fee cover, when was the last increase, and are there any pending special assessments or reserve-fund shortfalls?
- Any open or pending special assessments — roof, HVAC, plumbing, elevator, façade? What's the per-unit balance and payoff schedule, and is the seller paying it off at close or rolling it to the buyer?
- Why hasn't it sold? Are there any deal-killer items the seller is aware of (foundation, flood, title, zoning, code violations)?
- Is there a deadline driving the sale (1031 exchange, divorce, estate, relocation)? That informs how much negotiation room exists.
- Schools are D-rated, which usually means shorter tenancies and higher turnover. Who's the typical renter profile here, and what's been the actual vacancy rate?
- The area grade is low — what's the realistic commute time and amenity access for the typical tenant pool here? Any planned neighborhood developments (good or bad) we should know about?
- What's the average days-on-market for RENTAL listings here right now (not sales)? A rising rental-DOM trend means longer vacancies and softer asking-rent achievability than the comps imply.
- What's the recent tenant-quality profile in this submarket — average credit score on applications, eviction rate, late-payment / NSF rate, and stable-employment percentage? A property-management company in the area should have these aggregated.
- How much new apartment / multifamily construction is in the pipeline within 1–3 miles? Heavy new supply (>2% of stock underway) typically softens rents 12–24 months out; light construction supports rent growth.
Investment metrics
- 1% rule
- 1.20% ✓
- Cap rate
- 6.79%
- Cash-on-cash
- 1.76%
- DSCR
- 1.08
- GRM
- 6.9
CMA / ARV
No comps found within radius.
Projected returns pro-forma
-3.0% appreciation · 0.0% rent growth · sell at horizon
- IRR
- -25.8%
- Equity multiple
- 0.16×
- Total profit
- $-96,297
- Equity at exit
- $60,983
- IRR
- -48.7%
- Equity multiple
- -0.37×
- Total profit
- $-157,256
- Equity at exit
- $35,363
Cash invested: $114,520 (down + closing). Projections, not guarantees.
Landlord ↔ Tenant lean methodology
- Overall (STATE)
- 87 Strongly Landlord-Friendly
- State Florida
- 87 Strongly Landlord-Friendly · R+3
- County
- — inherits STATE
- City
- — inherits STATE
ZIP-level market 33180
- Rents YoY
- -1.5%
- Active inventory
- 985
- Price-to-rent
- 6.9×
Monthly cashflow live
- Estimated rent
- $4,927 medium interval (Pro) →
- Mortgage (P&I)
- −$2,145
- Tax est. 1.5%
- −$511 /mo · $6,135/yr
- Insurance
- −$170
- Flood insurance flood zone
- −$427 /mo · $5,118/yr
- HOA
- −$898
- Vacancy / Maint / Mgmt
- −$1,035
- Net cashflow
- $-259
Break-even live
Sensitivity live
| Price | -10% $24 | -5% $-117 | +0% $-259 | +5% $-400 | +10% $-541 |
|---|---|---|---|---|---|
| Rent | -10% $-648 | -5% $-453 | +0% $-259 | +5% $-64 | +10% $131 |
| Rate | -1.0pp $-53 | -0.5pp $-155 | base $-259 | +0.5pp $-365 | +1.0pp $-472 |
UW: 25.0% down · 7.5% · 30yr · 1.5% tax · 5.0% vac · 8.0% maint · 8.0% mgmt
Financing live
Cash to close
- Down payment
- $102,250
- Closing costs
- $12,270
- Reserves months
- —
- Total cash needed
- —
Loan-product check · same deal, 3 products live
Conventional
25% down · 7.5% · 30yr
- Down + closing
- —
- Monthly P&I
- —
- Monthly cashflow
- —
- DSCR
- —
- Eligible?
- —
Personal DTI + credit; lowest rate.
DSCR
20% down · 8.5% · 30yr
- Down + closing
- —
- Monthly P&I
- —
- Monthly cashflow
- —
- DSCR
- —
- Eligible?
- —
No personal income docs; deal must DSCR.
Hard money
10% down · 12.0% · 12mo
- Down + closing
- —
- Monthly P&I
- —
- Monthly cashflow
- —
- DSCR
- —
- Eligible?
- —
Short-term bridge; refi at stabilization.
HOA detail condo
- Monthly dues
- $898 · $10,776/yr
- Likely covers
- waterinternetcablesecurity
- Assessments
- None detected in remarks — confirm with the listing agent.
Listing history 22 events
-
2026-06-18days on market $409,000 Active 267 DOM
-
2026-06-17days on market $409,000 Active 266 DOM
-
2026-06-16days on market $409,000 Active 265 DOM
-
2026-06-15days on market $409,000 Active 264 DOM
-
2026-06-13days on market $409,000 Active 262 DOM
-
2026-06-09days on market $409,000 Active 258 DOM
-
2026-06-08days on market $409,000 Active 257 DOM
-
2026-06-08days on market $409,000 Active 256 DOM
-
2026-06-04days on market $409,000 Active 253 DOM
-
2026-06-03days on market $409,000 Active 252 DOM
-
2026-06-02days on market $409,000 Active 251 DOM
-
2026-06-02remarks 699-char remark
-
2026-06-01days on market $409,000 Active 250 DOM
-
2026-05-31days on market $409,000 Active 249 DOM
-
2026-04-23price $409,000
-
2026-01-24status Active
-
2025-11-14historical
-
2025-07-15price $414,900
-
2025-07-15$414,500 Active
-
2002-01-02soldstatus $133,000
-
1997-01-30soldstatus $72,000
-
1995-02-02soldstatus $72,000
ⓘ Source: listings_history table (triggers on properties + properties_extension) + one-shot
backfill from property_details.listing_events for pre-trigger history.
Climate risk First Street
- Flood 7/10 Severe FEMA zone AE · 75% chance over 30 yrs
- Wildfire 1/10 Low
- Heat 10/10 Extreme 7 d/yr ≥104°F today · 28 d/yr by 30 yrs out
- Wind 10/10 Extreme 99% chance of damaging wind over 30 yrs
- Air quality 2/10 Low 2 unhealthy d/yr today · 2 by 30 yrs out
Nearby sold comps map
Loading sold comps map…
Walkable amenities ~0.75 mi
Loading nearby amenities…
Taxation est. · year 1
- Rental income
- $59,126
- − Mortgage interest
- −$22,910
- − Property taxes
- −$6,135
- − Insurance
- −$7,164
- − Repairs & maintenance
- −$4,730
- − Management
- −$4,730
- − HOA
- −$10,776
- − Depreciation
- −$11,898
- Taxable loss
- −$9,217
- Est. tax savings @ 24.0%
- +$2,212
- After-tax cash flow
- $-891/yr
For passive investors: Depreciation is non-cash, so a rental often shows a tax loss while cash-flowing — sheltering income. Rental losses are passive: they offset passive income freely, and up to $25,000/yr can offset ordinary (W-2) income if you actively participate and your MAGI is under $100k (phasing out to $0 by $150k); unused losses carry forward. On sale, claimed depreciation is recaptured at up to 25%, and gains may owe capital-gains tax (a 1031 exchange can defer both). Figures are a year-1 estimate at your 24.0% rate — not tax advice; consult a CPA.
Schools (NCES district)
- District
- Miami-Dade
- NCES district ID
- 1200390
- Math proficiency
- 45% ▼ -16.00%
- Reading proficiency
- 54% ▼ -5.00%
- Median HH income
- $43,928
- Composite
- 41.76/100
- National rank
- #3397
- State rank
- #40 of 73 in FL
Livability — Ojus
- Score
- 83/100
- State rank
- #58
- US rank
- #1031
Category grades
Schools grade is shown separately in the Schools card above.
Census & demographics
- Census place
- Ojus, FL
- County
- Miami-Dade County · 2,697,751 people
- Metro
- Miami-Fort Lauderdale-Pompano Beach, FL
- Population (ZIP)
- 34,147
- Household income
- $91,055
- Rent vs Own
- Severe rent burden
- 1838.0
Population outlook (Miami-Dade County) Hauer SSP2
- Today (2025)
- 3,126,439 people
- By 2030
- 3,325,765 · +6.4%
- By 2040
- 3,697,561 · +18.3%
- By 2050
- 4,012,134 · +28.3%
- By 2075
- 4,605,612 · +47.3%
- By 2100
- 4,866,598 · +55.7%
Race, ethnicity, and origin ACS 2023
- Neighborhood character
- Diverse neighborhood (Simpson 0.59)
- Race & ethnicity
- White 46% Hispanic / Latino 45% Two or more races 28% Black 2% Asian 2%
- Hispanic origin (detail)
- Mexican 2% Puerto Rican 2% Cuban 7% Dominican 1% Salvadoran 6%
- Common ancestry
- Scotch-Irish 5% Romanian 5% Italian 3%
- Foreign-born
- 52% · Canada, Jamaica, Dominican Republic
- Languages at home
- 30% English-only · Spanish 49% Other Indo-European 6% Russian/Polish/Slavic 4%
Political lean MEDSL · Miami-Dade
- 2024 margin
- R (+11.4) · D 43.9% · R 55.4%
- 2008→2024 swing
- -27.6pp toward R · 2008: 16.1pp · 2024: -11.4pp
- All cycles
- 2024: R+11.4 2020: D+7.3 2016: D+29.6 2012: D+23.7 2008: D+16.1
Not yet ingested
- Civics
- —
Market trends
- HPI YoY
- ▼ -343.81%
- Current HPI
- 234.7715
- Rent YoY
- ▼ -1.51%
- Metro
- Miami-Fort Lauderdale-Pompano Beach, FL
- State GDP YoY
- ▲ 3.28%
- F500 in state
- 36
Industry mix (Fortune 500 HQ in FL)
| Industry | F500 HQs | Revenue |
|---|---|---|
| Industrial Technology | 2 | $29B |
|
||
| Insurance | 2 | $17B |
|
||
| Retail | 1 | $60B |
|
||
| Technology Distribution | 1 | $58B |
|
||
| Homebuilding | 1 | $35B |
|
||
| Technology Manufacturing | 1 | $35B |
|
||
Price history
+468.1% since first listed8 events — show timeline
- 2026-04-23 Price Changed $409,000 MARMLS
- 2026-01-24 Relisted — MARMLS
- 2025-11-14 Listing Removed — MARMLS
- 2025-07-15 Price Changed $414,900 MARMLS
- 2025-07-15 Listed $414,500 MARMLS
- 2002-01-02 Sold (Public Records) $133,000 Public Records
- 1997-01-30 Sold (Public Records) $72,000 Public Records
- 1995-02-02 Sold (Public Records) $72,000 Public Records
Property tax history
-0.4%/yrLatest (2025): $739 · +5.0% YoY. Source: county tax records.
Cash-flow waterfall
monthlySold comps — $/sqft
last 12 mo · ≤1 miLoading sold comps…