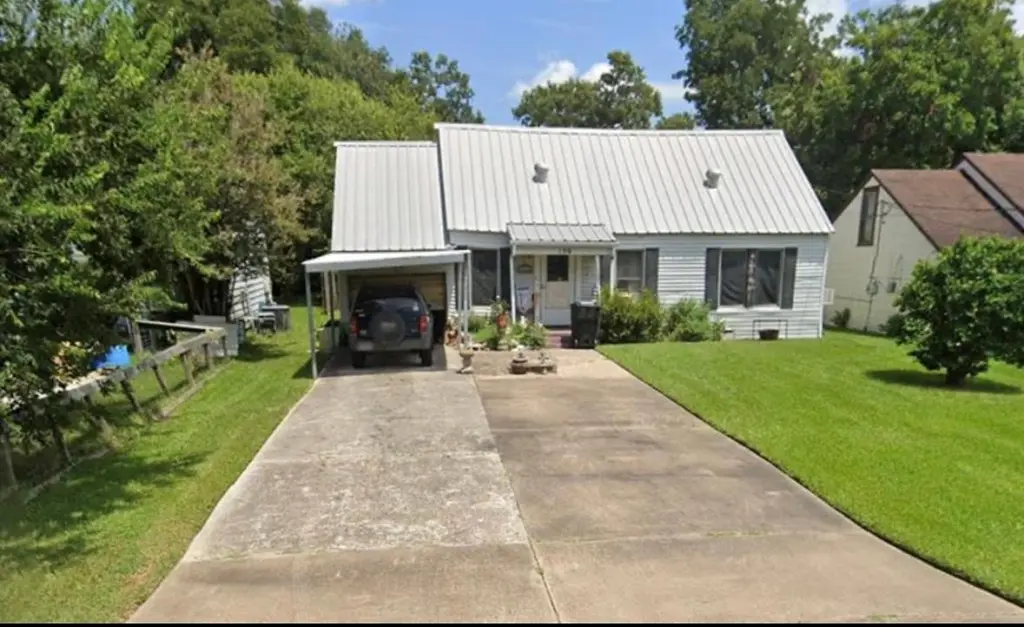
156 Hilldale Dr · Nederland, TX
Flood risk 7/10 · Major
- FEMA flood zone
- X
- Chance of flooding over 30 yrs
- 0.6%
- Est. flood insurance / yr
- $507 – $1,088
Fire risk 2/10 · Minimal
- Est. fire insurance / yr
- $1,222 – $2,270
Heat risk 9/10 · Severe
- Hot days now (above 110°F)
- 7 days/yr
- Hot days in 30 yrs
- 24 days/yr
Wind risk 9/10 · Severe
- Chance of severe wind over 30 yrs
- 99.0%
Air-quality risk 2/10 · Minimal
- Unhealthy air days now
- 1 days/yr
- Unhealthy air days in 30 yrs
- 1 days/yr
Risk factors via First Street. Map © Google.
Why this score? — see what drove the B+ grade
The composite is a weighted blend of 9 inputs, each scored 0–100. Each bar is that input's sub-score; the figure is the points it added to the 100-point composite (weight × sub-score).
- Cash flow +30.0/30.0
- ARV discount +15.0/15.0
- DSCR +10.0/10.0
- 1% rule +8.8/10.0
- Rent growth +4.8/5.0
- Schools +4.5/10.0
- Livability +3.8/5.0
- Condition / age +2.5/5.0
- Appreciation +0.0/10.0
$139,678
🖨 Deal sheet 📄 Offer letter ✓ Due diligence
Listing remarks MLS
Investor special on oversized lot. Great schools in Nederland ISD. New roads in Neighborhood with underground storm sewer lines. 2 Bedrooms and 2 bathroom downstairs with 1 Bedroom and 1 Bathroom upstairs. Potential for an additional large 22 x 23 room Upstairs has another living area that can be converted to more bedrooms. Foundation recently leveled. Newer metal roof. Two storage sheds. Large patio.
Key facts
- Large patio
- Two storage sheds
- Oversized lot
Tags
Neighborhood map
What this means for you Summary
Snapshot
- This is a 4-bed/3.0-bath single-family listed at $140k.
Deal economics
- At list price, monthly cash flow is $488 ($6k/yr) — positive.
- The deal already cash-flows at list — no discount required.
- Meets the 1% rule at list price ($2k rent vs $140k).
- Recommended offer: $123k (12.0% below list) — sets the bar for market timing.
- Cap rate 11.1% vs local median 4.6% in Nederland — top-decile yield for the area; either an underpriced asset or a hidden risk that comps aren't pricing in. Stress-test before assuming the spread holds.
Location & tenants
- Location reads 75/100 on livability (#129 in TX, #3,906 nationally) — a middle-class / working-renter tenant base. Strengths: employment A+, cost of living A+, housing A+; Watch: amenities F, commute F.
- Nederland ISD (suburban): math 51% / reading 52% proficiency, ranked #138 of 826 in TX (top 17%) — acceptable for families but not a draw, mixed tenant base, ~2y average lease.
- Market conditions: Rents rising fast (+9.3%/yr); 111 active listings in the ZIP; 6 comparable units currently listed for rent nearby; rentals at typical pace (median 23d on market — plan ~3-4 weeks tenant-placement turnaround); solid renter incomes; 343 units permitted in Jefferson County in 2024 (0 in 5+ unit buildings).
Forward outlook
- Local home prices are declining (-3.0%/yr); year-one equity from $966 of loan paydown is wiped out by about $4k of value loss. Plan a longer hold.
- At projected returns (-3.0% appreciation + 8.0% rent growth), your $39k cash investment doubles in ~6 years — after that, you're playing with house money.
Negotiation context
- It's been on market 322 days — a 12% lower offer ($123k) is reasonable based on typical stale-listing flexibility.
- 3 sale attempts since 3y ago; this cycle's ask has dropped $8k (6%) from the opening price — seller is motivated, your offer sets the floor, not the list.
Risks & watch-outs
- Watch-outs: flood insurance adds $66/mo.
- Climate carrying-cost: major flood risk; severe wind risk, 99% chance of damaging wind over 30y; extreme-heat days projected 7→24/yr by 2055 (HVAC capex compounding) — expect insurance premiums to compound above CPI over the hold.
Questions for the listing agent
- It's been on market 322 days. Have you received any prior offers? Is the seller open to a 12% concession, seller financing, or rate buy-down credit?
- Built in 1962 — when were the roof, HVAC, electrical panel, plumbing, and water heater last replaced?
- What's the actual annual flood-insurance premium (NFIP or private), and is the property in a SFHA with mandatory coverage?
- Why hasn't it sold? Are there any deal-killer items the seller is aware of (foundation, flood, title, zoning, code violations)?
- Is there a deadline driving the sale (1031 exchange, divorce, estate, relocation)? That informs how much negotiation room exists.
- Schools are A-rated — typically a magnet for longer-tenancy family renters. What's the average tenant stay here, and is there a school-zone premium baked into asking?
- What's the average days-on-market for RENTAL listings here right now (not sales)? A rising rental-DOM trend means longer vacancies and softer asking-rent achievability than the comps imply.
- What's the recent tenant-quality profile in this submarket — average credit score on applications, eviction rate, late-payment / NSF rate, and stable-employment percentage? A property-management company in the area should have these aggregated.
- How much new for-sale + rental construction is in the pipeline within 1–3 miles? Heavy new supply typically softens prices + rents 12–24 months out; constrained supply supports both.
Investment metrics
- 1% rule
- 1.38% ✓
- Cap rate
- 11.05%
- Cash-on-cash
- 17.00%
- DSCR
- 1.76
- GRM
- 6.0
CMA / ARV
- ARV (median comp)
- $227,804
- List price
- $139,678
- Delta
- -38.68%
- Verdict
- UNDERPRICED
- Comps
- 20 within 1.0 mi
Show comp detail 12 sales within ~0.75 mi
| Address | Dist | Beds/Ba | Sqft | Sold | Price | $/sf | Match |
|---|---|---|---|---|---|---|---|
| 2719 Avenue M | 0.26mi | 3/2.5 (-1) | 1,908 (-2%) | 4mo | $229,900 | $120 | 75 |
| 189 Hilldale Dr | 0.10mi | 4/2.0 | 2,148 (+11%) | 10mo | $185,000 | $86 | 65 |
| 3003 Avenue O | 0.16mi | 3/1.5 (-1) | 2,051 (+6%) | 14mo | $199,900 | $97 | 60 |
| 1016 S 27th St | 0.34mi | 3/2.0 (-1) | 2,198 (+13%) | 2mo | $279,900 | $127 | 51 |
| 2411 Avenue M | 0.45mi | 3/2.0 (-1) | 1,838 (-5%) | 13mo | $335,000 | $182 | 50 |
| 1104 S 22nd St | 0.66mi | 3/2.5 (-1) | 1,923 (-1%) | 14mo | $269,900 | $140 | 50 |
| 912 S 21st St | 0.74mi | 3/2.0 (-1) | 1,848 (-5%) | 2mo | $251,500 | $136 | 47 |
| 2777 Poydras Ct | 0.47mi | 3/2.5 (-1) | 1,669 (-14%) | 8mo | $370,000 | $222 | 42 |
| 4100 Willow Bend Ln | 0.74mi | 4/2.5 | 2,080 (+7%) | 14mo | $269,900 | $130 | 40 |
| 3849 Cobblestone Ln | 0.63mi | 3/2.0 (-1) | 1,880 (-3%) | 22mo | $201,500 | $107 | 38 |
| 3920 Blackberry Ln | 0.67mi | 3/2.0 (-1) | 2,136 (+10%) | 11mo | $260,000 | $122 | 34 |
| 919 S 22nd | 0.70mi | 3/2.0 (-1) | 1,647 (-15%) | 14mo | $199,900 | $121 | 22 |
Match score weights: distance 35% · size 25% · config 20% · recency 20%. Top-matched comps best support the ARV.
Projected returns pro-forma
-3.0% appreciation · 8.0% rent growth · sell at horizon
- IRR
- 11.4%
- Equity multiple
- 1.48×
- Total profit
- $18,724
- Equity at exit
- $20,826
- IRR
- 24.3%
- Equity multiple
- 3.64×
- Total profit
- $103,132
- Equity at exit
- $12,077
Cash invested: $39,110 (down + closing). Projections, not guarantees.
Landlord ↔ Tenant lean methodology
- Overall (STATE)
- 87 Strongly Landlord-Friendly
- State Texas
- 87 Strongly Landlord-Friendly · R+5
- County
- — inherits STATE
- City
- — inherits STATE
ZIP-level market 77627
- Rents YoY
- 9.3%
- Active inventory
- 111
- Price-to-rent
- 6.0×
Monthly cashflow live
- Estimated rent
- $1,934 high interval (Pro) →
- Mortgage (P&I)
- −$732
- Tax from tax record
- −$183 /mo · $2,200/yr
- Insurance
- −$58
- Flood insurance flood zone
- −$66 /mo · $798/yr
- HOA
- −$0
- Vacancy / Maint / Mgmt
- −$406
- Net cashflow
- $488
Break-even live
UW: 25.0% down · 7.5% · 30yr · 1.5% tax · 5.0% vac · 8.0% maint · 8.0% mgmt
Financing live
Cash to close
- Down payment
- $34,920
- Closing costs
- $4,190
- Reserves months
- —
- Total cash needed
- —
Loan-product check · same deal, 3 products live
Conventional
25% down · 7.5% · 30yr
- Down + closing
- —
- Monthly P&I
- —
- Monthly cashflow
- —
- DSCR
- —
- Eligible?
- —
Personal DTI + credit; lowest rate.
DSCR
20% down · 8.5% · 30yr
- Down + closing
- —
- Monthly P&I
- —
- Monthly cashflow
- —
- DSCR
- —
- Eligible?
- —
No personal income docs; deal must DSCR.
Hard money
10% down · 12.0% · 12mo
- Down + closing
- —
- Monthly P&I
- —
- Monthly cashflow
- —
- DSCR
- —
- Eligible?
- —
Short-term bridge; refi at stabilization.
Rent comps 6 comps
| Address | Beds | Baths | Sqft | Rent | $/sqft | DOM | Units | Dist |
|---|---|---|---|---|---|---|---|---|
| 617 Hardy Ave Nederland, TX | 3.0 | 2.0 | 1295 | $1,700 | $1.31 | 23d | 1 | 0.48mi |
| 8849 Pinewood Dr Port Arthur, TX | 1.0–3.0 | 1.0–2.0 | 990 | $1,949 | $1.97 | 13d | 1 | 0.76mi |
| 2512 Avenue A Unit A Nederland, TX | 3.0 | 1.5 | 1387 | $1,795 | $1.29 | 23d | 1 | 0.86mi |
| 2640 Hickory Cove Ln Port Arthur, TX | 4.0 | 2.5 | 1850 | $2,600 | $1.41 | 13d | 1 | 1.00mi |
| 7724 Golfhill Dr Unit 1514820P Port Arthur, TX | 5.0 | 2.0 | 2389 | $13,073 | $5.47 | 23d | 1 | 1.07mi |
| 3119 Moor Dr Nederland, TX | 3.0 | 1.5 | 1448 | $1,795 | $1.24 | 43d | 1 | 1.08mi |
Listing history 33 events
-
2026-06-17days on market $139,678 Active 322 DOM
-
2026-06-16remarks 417-char remark
-
2026-06-16days on market $139,678 Active 321 DOM
-
2026-06-15days on market $139,678 Active 320 DOM
-
2026-06-14days on market $139,678 Active 318 DOM
-
2026-06-13days on market $139,678 Active 317 DOM
-
2026-06-10days on market $139,678 Active 315 DOM
-
2026-06-09days on market $139,678 Active 314 DOM
-
2026-06-08days on market $139,678 Active 313 DOM
-
2026-06-07days on market $139,678 Active 312 DOM
-
2026-06-05days on market $139,678 Active 309 DOM
-
2026-06-03days on market $139,678 Active 308 DOM
-
2026-06-02days on market $139,678 Active 307 DOM
-
2026-06-01days on market $139,678 Active 306 DOM
-
2026-05-31days on market $139,678 Active 305 DOM
-
2026-05-30days on market $139,678 Active 304 DOM
-
2025-12-03price $139,678 404-char remark
Show marketing remark (404 chars)
Investor special on oversized lot. Great schools in Nederland ISD. New roads in Neighborhood with underground storm sewer lines. 2 Bedrooms and 2 bathroom downstairs with 1 Bedroom and 1 Bathroom upstairs. Potential for an additional large 22 x 23 room Upstairs has another living area that can be converted to more bedrooms. Foundation recently leveled. Newer metal roof. Two storage sheds. Large patio.
-
2025-08-05price $141,948 404-char remark
Show marketing remark (404 chars)
Investor special on oversized lot. Great schools in Nederland ISD. New roads in Neighborhood with underground storm sewer lines. 2 Bedrooms and 2 bathroom downstairs with 1 Bedroom and 1 Bathroom upstairs. Potential for an additional large 22 x 23 room Upstairs has another living area that can be converted to more bedrooms. Foundation recently leveled. Newer metal roof. Two storage sheds. Large patio.
-
2025-07-30$147,948 Active 404-char remark
Show marketing remark (404 chars)
Investor special on oversized lot. Great schools in Nederland ISD. New roads in Neighborhood with underground storm sewer lines. 2 Bedrooms and 2 bathroom downstairs with 1 Bedroom and 1 Bathroom upstairs. Potential for an additional large 22 x 23 room Upstairs has another living area that can be converted to more bedrooms. Foundation recently leveled. Newer metal roof. Two storage sheds. Large patio.
-
2025-06-25historical
-
2025-06-03price $146,900
-
2024-12-13price $134,500
-
2024-11-01price $145,500
-
2024-10-04price $139,500
-
2024-09-26price $144,500
-
2024-09-05price $149,000
-
2024-08-23$154,000 Active
-
2024-08-13historical
-
2023-04-13soldstatus
-
2023-04-12soldstatus
-
2023-04-06historical
-
2023-03-08price $85,000
-
2023-02-17$110,000 Active
ⓘ Source: listings_history table (triggers on properties + properties_extension) + one-shot
backfill from property_details.listing_events for pre-trigger history.
Tax reassessment forecast TX · Resets to sale price
- Current annual tax
- $2,200 · $183/mo
- Projected year-2 tax
- $2,556 · $213/mo
- Expected delta
- +$356/yr (+$30/mo · 16.2%)
ⓘ Screening estimate from a state-policy table — verify with the county assessor before closing.
Climate risk First Street
- Flood 7/10 Severe FEMA zone X · 60% chance over 30 yrs
- Wildfire 2/10 Low
- Heat 9/10 Extreme 7 d/yr ≥110°F today · 24 d/yr by 30 yrs out
- Wind 9/10 Extreme 99% chance of damaging wind over 30 yrs
- Air quality 2/10 Low 1 unhealthy d/yr today · 1 by 30 yrs out
Nearby sold comps map
Loading sold comps map…
Walkable amenities ~0.75 mi
Loading nearby amenities…
Taxation est. · year 1
- Rental income
- $23,212
- − Mortgage interest
- −$7,824
- − Property taxes
- −$2,200
- − Insurance
- −$1,496
- − Repairs & maintenance
- −$1,857
- − Management
- −$1,857
- − Depreciation
- −$4,063
- Taxable income
- $3,915
- Est. tax owed @ 24.0%
- −$940
- After-tax cash flow
- $4,912/yr
For passive investors: Depreciation is non-cash, so a rental often shows a tax loss while cash-flowing — sheltering income. Rental losses are passive: they offset passive income freely, and up to $25,000/yr can offset ordinary (W-2) income if you actively participate and your MAGI is under $100k (phasing out to $0 by $150k); unused losses carry forward. On sale, claimed depreciation is recaptured at up to 25%, and gains may owe capital-gains tax (a 1031 exchange can defer both). Figures are a year-1 estimate at your 24.0% rate — not tax advice; consult a CPA.
Schools (NCES district)
- District
- Nederland ISD
- NCES district ID
- 4832280
- Math proficiency
- 51% ▼ -3.00%
- Reading proficiency
- 52% ▼ -3.00%
- Median HH income
- $59,647
- Composite
- 44.95/100
- National rank
- #2709
- State rank
- #138 of 826 in TX
Livability — Nederland
- Score
- 75/100
- State rank
- #129
- US rank
- #3906
Category grades
Schools grade is shown separately in the Schools card above.
Census & demographics
- Census place
- Nederland, TX
- County
- Jefferson County · 203,592 people
- City population
- 22,357
- Metro
- Beaumont-Port Arthur, TX
- Population (ZIP)
- 22,357
- Household income
- $78,001
- Rent vs Own
- Severe rent burden
- 572.0
Population outlook (Jefferson County) Hauer SSP2
- Today (2025)
- 259,015 people
- By 2030
- 260,685 · +0.6%
- By 2040
- 263,309 · +1.7%
- By 2050
- 265,237 · +2.4%
- By 2075
- 270,193 · +4.3%
- By 2100
- 255,628 · -1.3%
Race, ethnicity, and origin ACS 2023
- Neighborhood character
- Predominantly White (78%)
- Race & ethnicity
- White 78% Hispanic / Latino 12% Two or more races 8% Black 4% Asian 3%
- Hispanic origin (detail)
- Mexican 8%
- Common ancestry
- Lithuanian 10% Slovak 3% Italian 2%
- Foreign-born
- 5% · Canada, Vietnam
- Languages at home
- 87% English-only · Spanish 8% Other Indo-European 1% Vietnamese 1%
Political lean MEDSL · Jefferson
- 2024 margin
- Lean R (+8.9) · D 45.1% · R 54.0%
- 2008→2024 swing
- -11.1pp toward R · 2008: 2.2pp · 2024: -8.9pp
- All cycles
- 2024: R+8.9 2020: R+1.6 2016: R+0.5 2012: D+1.6 2008: D+2.2
Not yet ingested
- Civics
- —
Market trends
- HPI YoY
- ▼ -228.91%
- Current HPI
- 176.2132
- Rent YoY
- ▲ 9.27%
- Metro
- Beaumont-Port Arthur, TX
- State GDP YoY
- ▲ 3.95%
- F500 in state
- 110
Industry mix (Fortune 500 HQ in TX)
| Industry | F500 HQs | Revenue |
|---|---|---|
| Energy | 16 | $1,198B |
|
||
| Technology | 5 | $198B |
|
||
| Engineering / Construction | 4 | $72B |
|
||
| Energy Services | 3 | $60B |
|
||
| Utilities | 3 | $41B |
|
||
| Healthcare | 2 | $330B |
|
||
Price history
+27.0% since first listed17 events — show timeline
- 2025-12-03 Price Changed $139,678 HARMLS
- 2025-08-05 Price Changed $141,948 HARMLS
- 2025-07-30 Listed $147,948 HARMLS
- 2025-06-25 Listing Removed — HARMLS
- 2025-06-03 Price Changed $146,900 HARMLS
- 2024-12-13 Price Changed $134,500 HARMLS
- 2024-11-01 Price Changed $145,500 HARMLS
- 2024-10-04 Price Changed $139,500 HARMLS
- 2024-09-26 Price Changed $144,500 HARMLS
- 2024-09-05 Price Changed $149,000 HARMLS
- 2024-08-23 Listed $154,000 HARMLS
- 2024-08-13 Coming Soon — HARMLS
- 2023-04-13 Sold (Public Records) — Public Records
- 2023-04-12 Sold (Public Records) — Public Records
- 2023-04-06 Listing Removed — HARMLS
- 2023-03-08 Price Changed $85,000 HARMLS
- 2023-02-17 Listed $110,000 HARMLS
Property tax history
+2.2%/yrLatest (2025): $2,200 · +17.2% YoY. Source: county tax records.
Cash-flow waterfall
monthlySold comps — $/sqft
last 12 mo · ≤1 miLoading sold comps…