 Fourplex
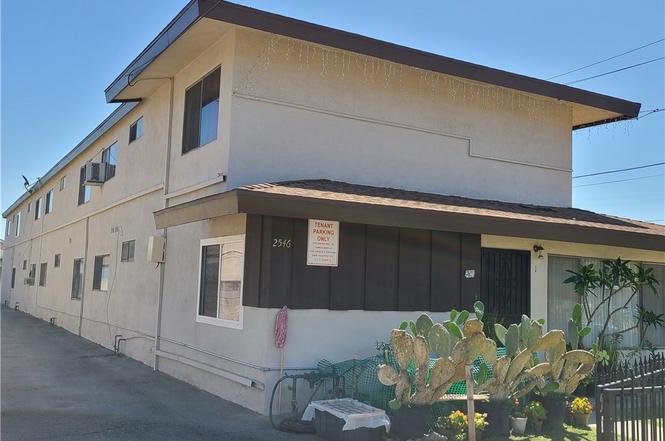
2546 Potrero Ave · El Monte, CA
Flood risk 1/10 · Minimal
- FEMA flood zone
- X (unshaded)
- Chance of flooding over 30 yrs
- 0.0%
- Est. flood insurance / yr
- $507 – $1,088
Fire risk 1/10 · Minimal
- Est. fire insurance / yr
- $659 – $1,223
Heat risk 6/10 · Moderate
- Hot days now (above 99°F)
- 7 days/yr
- Hot days in 30 yrs
- 20 days/yr
Wind risk 1/10 · Minimal
- Chance of severe wind over 30 yrs
- —
Air-quality risk 6/10 · Moderate
- Unhealthy air days now
- 10 days/yr
- Unhealthy air days in 30 yrs
- 10 days/yr
Risk factors via First Street. Map © Google.
Why this score? — see what drove the C- grade
The composite is a weighted blend of 9 inputs, each scored 0–100. Each bar is that input's sub-score; the figure is the points it added to the 100-point composite (weight × sub-score).
- Cash flow +21.4/30.0
- ARV discount +7.5/15.0
- DSCR +6.8/10.0
- 1% rule +5.7/10.0
- Schools +4.2/10.0
- Livability +3.1/5.0
- Rent growth +2.5/5.0
- Condition / age +2.5/5.0
- Appreciation +0.0/10.0
$1,750,000
🖨 Deal sheet (PDF) 📄 Offer letter ✓ Due diligence
Multi-family units
County records classify this as Multi-Family (5+ Unit). Listing-text estimate: 4 units. estimate disagrees with records
5+ unit building — per-unit beds/baths from public records are typically unavailable; the breakdown below (if shown) is an estimate from the listing text.
Listing remarks
Huge opportunity for investors to get into CA’s ever lasting hot rental market!! This 13 bedrooms, 7 bathrooms, 7-units complex (2 bed/1 bath: 6 units, & 1 bd/1 bath) sprawls on a 6,046 sqft of living space, has a common laundry area, parking in the back and the front, and conveniently located near the Garvey commercial business; business district and Potrero Elementary. Remodeled between 2017/2018, the property is well kept and features upgrades such as a newly installed roof, newer bathrooms and kitchens, carpets, and a new electrical panel. Renters are on a yearly lease basis and the leases will be transferred to the buyer(s). The chance to become an investor/landlord in Cal
Key facts
- 8,504 sq ft lot
- Garage
- Built 1962
Property features AI
Finance
- Other: Property has separate meters: 8 electric meters, 8 gas meters, 1 separate water meter; Total building area reported as 6,045
- Financial info: Total actual rent for property: $8,620; Gross scheduled income: $103,440; Laundry income: $425; Net operating income: $90,872; Operating expenses: $12,568; Expenses include: Insurance $4,808; Water/Sewer $5,760; Electric $1,000; Trash $1,000; Seven leased units
- HOA & community: Community apartment common interest
Exterior
- Parking: Eight total parking spaces; Eight carport or covered parking spaces; Individual unit garages: some units listed with 1 garage space each
- Utilities: District/public water; Public sewer; Natural gas connected; Electricity connected; Standard electric service
- Home design: Attached apartment community; Two-story building; Single building on the parcel; Estimated year built
- Construction: Composition roof; Drywall exterior walls; Attached construction with shared walls (2+ common walls)
- Exterior features: No pool; Street lighting in the neighborhood; Garden lot characteristics
Interior
- Kitchen: Kitchens in each unit (appliances not specified)
- Bedrooms: Several units with 2 bedrooms; One unit with 1 bedroom
- Bathrooms: Each unit has 1 full bathroom
- Heating & cooling: Wall heaters; Wall/window air conditioning units
- Interior features: Front entry; Entry at ground level; Wall heaters; Wall/window cooling units; Community laundry
- Laundry & utility: On-site community laundry
Neighborhood map
What this means for you Summary
Snapshot
- This is a 4 × 3-bed/?-bath units multifamily listed at $1.75M.
Deal economics
- At list price, monthly cash flow is $3k ($31k/yr) — positive. Per door: $646/mo.
- The deal already cash-flows at list — no discount required.
- Meets the 1% rule at list price ($19k rent vs $1.75M).
- Recommended offer: $1.54M (12.0% below list) — sets the bar for market timing.
- Cap rate 8.1% vs local median 2.4% in El Monte — top-decile yield for the area; either an underpriced asset or a hidden risk that comps aren't pricing in. Stress-test before assuming the spread holds.
Location & tenants
- Location reads 61/100 on livability (#554 in CA) — a middle-class / working-renter tenant base. Strengths: commute A+; Watch: crime D, amenities F, cost of living F.
- El Monte Union High (suburban): math 34% / reading 59% proficiency, ranked #543 of 1,400 in CA (top 39%) — families likely to look elsewhere, expect single-tenant / working-renter base with shorter leases.
- Zoned schools: Wilkerson Elementary (343 students, 91% FRL); South El Monte High (1,300 students, 86% FRL).
- Market conditions: 57 active listings in the ZIP; 19,697 units permitted in Los Angeles County in 2024 (9,426 in 5+ unit buildings).
- At $18,767/mo this rent would consume 330% of the median local household income ($68k/yr) (locally 2017% of renters already pay >50% of income on rent) — very limited rent-growth headroom before tenants either downsize or default.
Forward outlook
- Local home prices are declining (-3.0%/yr); year-one equity from $12k of loan paydown is wiped out by about $52k of value loss. Plan a longer hold.
- Los Angeles County population projected at +9% by 2050 — modest demand growth; plan on rents tracking national, not racing it.
Negotiation context
- It's been on market 411 days — a 12% lower offer ($1.54M) is reasonable based on typical stale-listing flexibility.
- 5 sale attempts since 5y ago with the ask held roughly flat each time — persistent listings suggest the price (not the market) is what's stuck; bring a comps-based counter.
Risks & watch-outs
- Climate carrying-cost: extreme-heat days projected 7→20/yr by 2055 (HVAC capex compounding) — expect insurance premiums to compound above CPI over the hold.
Questions for the listing agent
- It's been on market 411 days. Have you received any prior offers? Is the seller open to a 12% concession, seller financing, or rate buy-down credit?
- Can we see the unit-by-unit rent roll, current vacancy, and any below-market leases? What's the average tenancy length?
- What capital expenditures (roof, boiler, parking lot, exteriors) have been made in the last 5 years, and what's planned in the next 2?
- Built in 1962 — when were the roof, HVAC, electrical panel, plumbing, and water heater last replaced?
- Why hasn't it sold? Are there any deal-killer items the seller is aware of (foundation, flood, title, zoning, code violations)?
- Is there a deadline driving the sale (1031 exchange, divorce, estate, relocation)? That informs how much negotiation room exists.
- Schools are D-rated, which usually means shorter tenancies and higher turnover. Who's the typical renter profile here, and what's been the actual vacancy rate?
- Crime grade is D in this area — have there been break-ins, vandalism, or insurance claims at this property in the last 3 years? What carrier currently insures it and at what premium?
- What's the average days-on-market for RENTAL listings here right now (not sales)? A rising rental-DOM trend means longer vacancies and softer asking-rent achievability than the comps imply.
- What's the recent tenant-quality profile in this submarket — average credit score on applications, eviction rate, late-payment / NSF rate, and stable-employment percentage? A property-management company in the area should have these aggregated.
- How much new apartment / multifamily construction is in the pipeline within 1–3 miles? Heavy new supply (>2% of stock underway) typically softens rents 12–24 months out; light construction supports rent growth.
Investment metrics
- 1% rule
- 1.07% ✓
- Cap rate
- 8.07%
- Cash-on-cash
- 6.33%
- DSCR
- 1.28
- GRM
- 7.8
CMA / ARV
No comps found within radius.
Projected returns pro-forma
-3.0% appreciation · 3.0% rent growth · sell at horizon
- IRR
- -6.5%
- Equity multiple
- 0.76×
- Total profit
- $-118,540
- Equity at exit
- $260,931
- IRR
- 3.1%
- Equity multiple
- 1.23×
- Total profit
- $110,322
- Equity at exit
- $151,308
Cash invested: $490,000 (down + closing). Projections, not guarantees.
Landlord ↔ Tenant lean methodology
- Overall (STATE)
- 18 Strongly Tenant-Friendly
- State California
- 18 Strongly Tenant-Friendly · D+13
- County
- — inherits STATE
- City
- — inherits STATE
ZIP-level market 91733
- Active inventory
- 57
- Price-to-rent
- 31.1×
Monthly cashflow live
- Estimated rent
- $18,767 high interval (Pro) →
- Mortgage (P&I)
- −$9,177
- Tax from tax record
- −$2,334 /mo · $28,011/yr
- Insurance
- −$729
- HOA
- −$0
- Vacancy / Maint / Mgmt
- −$3,941
- Net cashflow
- $2,585
Break-even live
Sensitivity live
| Price | -10% $3,576 | -5% $3,081 | +0% $2,585 | +5% $2,090 | +10% $1,595 |
|---|---|---|---|---|---|
| Rent | -10% $1,103 | -5% $1,844 | +0% $2,585 | +5% $3,327 | +10% $4,068 |
| Rate | -1.0pp $3,467 | -0.5pp $3,030 | base $2,585 | +0.5pp $2,132 | +1.0pp $1,671 |
4-unit breakdown (identical units grouped — click to expand)
| Units | Beds | Baths | Est. rent |
|---|---|---|---|
| 4× units | 3 | — | $18,768 |
| #1 | 3 | — | $4,692 |
| #2 | 3 | — | $4,692 |
| #3 | 3 | — | $4,692 |
| #4 | 3 | — | $4,692 |
| Total (4 units) | $18,767 | ||
UW: 25.0% down · 7.5% · 30yr · 1.5% tax · 5.0% vac · 8.0% maint · 8.0% mgmt
Financing live
Cash to close
- Down payment
- $437,500
- Closing costs
- $52,500
- Reserves months
- —
- Total cash needed
- —
Loan-product check · same deal, 3 products live
Conventional
25% down · 7.5% · 30yr
- Down + closing
- —
- Monthly P&I
- —
- Monthly cashflow
- —
- DSCR
- —
- Eligible?
- —
Personal DTI + credit; lowest rate.
DSCR
20% down · 8.5% · 30yr
- Down + closing
- —
- Monthly P&I
- —
- Monthly cashflow
- —
- DSCR
- —
- Eligible?
- —
No personal income docs; deal must DSCR.
Hard money
10% down · 12.0% · 12mo
- Down + closing
- —
- Monthly P&I
- —
- Monthly cashflow
- —
- DSCR
- —
- Eligible?
- —
Short-term bridge; refi at stabilization.
Listing history 32 events
-
2026-06-21days on market $1,750,000 Active 411 DOM
-
2026-06-18days on market $1,750,000 Active 408 DOM
-
2026-06-17days on market $1,750,000 Active 407 DOM
-
2026-06-16days on market $1,750,000 Active 406 DOM
-
2026-06-15days on market $1,750,000 Active 405 DOM
-
2026-06-13days on market $1,750,000 Active 403 DOM
-
2026-06-13days on market $1,750,000 Active 402 DOM
-
2026-06-09days on market $1,750,000 Active 399 DOM
-
2026-06-08days on market $1,750,000 Active 398 DOM
-
2026-06-07days on market $1,750,000 Active 397 DOM
-
2026-06-04days on market $1,750,000 Active 394 DOM
-
2026-06-03days on market $1,750,000 Active 393 DOM
-
2026-06-02days on market $1,750,000 Active 392 DOM
-
2026-06-01days on market $1,750,000 Active 391 DOM
-
2026-05-31days on market $1,750,000 Active 390 DOM
-
2026-04-21price $1,750,000
-
2025-05-06$1,800,000 Active
-
2025-05-02historical $1,800,000
-
2024-12-31historical
-
2024-11-16price $1,900,000
-
2024-05-23$1,990,000 Active
-
2024-05-22historical
-
2023-04-03historical
-
2022-08-03$2,100,000 Active
-
2022-06-27historical
-
2022-05-06$2,100,000 Active
-
2022-05-01historical
-
2021-10-22soldstatus $1,745,000 Closed Sale
-
2021-10-22soldstatus $1,745,000
-
2021-10-19status Pending Sale
-
2021-10-12historical Active Under Contract
-
2021-09-20$1,775,000 Active
ⓘ Source: listings_history table (triggers on properties + properties_extension) + one-shot
backfill from property_details.listing_events for pre-trigger history.
Tax reassessment forecast CA · Resets to sale price
- Current annual tax
- $28,011 · $2,334/mo
- Projected year-2 tax
- $28,011 · $2,334/mo
- Expected delta
- $0/yr ($0/mo · 0.0%)
ⓘ Screening estimate from a state-policy table — verify with the county assessor before closing.
Climate risk First Street
- Flood 1/10 Low FEMA zone X (unshaded) · 0% chance over 30 yrs
- Wildfire 1/10 Low
- Heat 6/10 Major 7 d/yr ≥99°F today · 20 d/yr by 30 yrs out
- Wind 1/10 Low
- Air quality 6/10 Major 10 unhealthy d/yr today · 10 by 30 yrs out
Nearby sold comps map
Loading sold comps map…
Walkable amenities ~0.75 mi
Loading nearby amenities…
Taxation est. · year 1
- Rental income
- $225,204
- − Mortgage interest
- −$98,027
- − Property taxes
- −$28,011
- − Insurance
- −$8,750
- − Repairs & maintenance
- −$18,016
- − Management
- −$18,016
- − Depreciation
- −$50,909
- Taxable income
- $3,474
- Est. tax owed @ 24.0%
- −$834
- After-tax cash flow
- $30,190/yr
For passive investors: Depreciation is non-cash, so a rental often shows a tax loss while cash-flowing — sheltering income. Rental losses are passive: they offset passive income freely, and up to $25,000/yr can offset ordinary (W-2) income if you actively participate and your MAGI is under $100k (phasing out to $0 by $150k); unused losses carry forward. On sale, claimed depreciation is recaptured at up to 25%, and gains may owe capital-gains tax (a 1031 exchange can defer both). Figures are a year-1 estimate at your 24.0% rate — not tax advice; consult a CPA.
Schools (NCES district)
- District
- El Monte Union High
- NCES district ID
- 0612120
- Math proficiency
- 34% ▲ 4.00%
- Reading proficiency
- 59% ▲ 3.00%
- Median HH income
- $46,859
- Composite
- 41.69/100
- National rank
- #7198
- State rank
- #543 of 1400 in CA
Livability — El Monte
- Score
- 61/100
- State rank
- #554
- US rank
- #18369
Category grades
Schools grade is shown separately in the Schools card above.
Census & demographics
- Census place
- El Monte, CA
- County
- Los Angeles County · 9,444,647 people
- City population
- 85,051
- Metro
- Los Angeles-Long Beach-Anaheim, CA
- Population (ZIP)
- 41,255
- Household income
- $68,278
- Rent vs Own
- Severe rent burden
- 2017.0
Population outlook (Los Angeles County) Hauer SSP2
- Today (2025)
- 10,940,515 people
- By 2030
- 11,256,481 · +2.9%
- By 2040
- 11,729,929 · +7.2%
- By 2050
- 11,948,407 · +9.2%
- By 2075
- 11,818,114 · +8.0%
- By 2100
- 10,842,928 · -0.9%
Race, ethnicity, and origin ACS 2023
- Neighborhood character
- Predominantly Hispanic (71%)
- Race & ethnicity
- Hispanic / Latino 71% Asian 24% Two or more races 15% White 3%
- Hispanic origin (detail)
- Mexican 64%
- Common ancestry
- Lithuanian 1%
- Foreign-born
- 51% · Canada, Vietnam, China
- Languages at home
- 16% English-only · Spanish 60% Chinese 11% Vietnamese 9%
Political lean MEDSL · Los Angeles
- 2024 margin
- Solid D (+32.9) · D 64.8% · R 31.9% · Other 3.3%
- 2008→2024 swing
- -7.4pp toward R · 2008: 40.4pp · 2024: 32.9pp
- All cycles
- 2024: D+32.9 2020: D+44.2 2016: D+48.0 2012: D+40.0 2008: D+40.4
Not yet ingested
- Civics
- —
Market trends
- HPI YoY
- ▼ -496.14%
- Current HPI
- 450.8012
- Rent YoY
- —
- Metro
- Los Angeles-Long Beach-Anaheim, CA
- State GDP YoY
- ▲ 3.21%
- F500 in state
- 116
Industry mix (Fortune 500 HQ in CA)
| Industry | F500 HQs | Revenue |
|---|---|---|
| Technology | 27 | $1,492B |
|
||
| Financial Services | 3 | $174B |
|
||
| Retail | 3 | $44B |
|
||
| Insurance | 3 | $26B |
|
||
| Media / Entertainment | 2 | $115B |
|
||
| Pharmaceuticals / Biotech | 2 | $62B |
|
||
Price history
-1.4% since first listed17 events — show timeline
- 2026-04-21 Price Changed $1,750,000 CRMLS
- 2025-05-06 Listed $1,800,000 CRMLS
- 2025-05-02 Coming Soon $1,800,000 CRMLS
- 2024-12-31 Listing Removed — CRMLS
- 2024-11-16 Price Changed $1,900,000 CRMLS
- 2024-05-23 Listed $1,990,000 CRMLS
- 2024-05-22 Coming Soon — CRMLS
- 2023-04-03 Listing Removed — CRMLS
- 2022-08-03 Listed $2,100,000 CRMLS
- 2022-06-27 Listing Removed — CRMLS
- 2022-05-06 Listed $2,100,000 CRMLS
- 2022-05-01 Coming Soon — CRMLS
- 2021-10-22 Sold (Public Records) $1,745,000 Public Records
- 2021-10-22 Sold (MLS) $1,745,000 CRMLS
- 2021-10-19 Pending — CRMLS
- 2021-10-12 Contingent — CRMLS
- 2021-09-20 Listed $1,775,000 CRMLS
Property tax history
+11.4%/yrLatest (2025): $28,011 · +8.0% YoY. Source: county tax records.
Cash-flow waterfall
monthlySold comps — $/sqft
last 12 mo · ≤1 miLoading sold comps…