4229 Us-421 · Manchester, KY
Flood risk 1/10 · Minimal
- FEMA flood zone
- X (unshaded)
- Chance of flooding over 30 yrs
- 0.0%
- Est. flood insurance / yr
- $507 – $1,088
Fire risk 4/10 · Minor
- Est. fire insurance / yr
- $839 – $1,559
Heat risk 4/10 · Minor
- Hot days now (above 100°F)
- 7 days/yr
- Hot days in 30 yrs
- 19 days/yr
Wind risk 2/10 · Minimal
- Chance of severe wind over 30 yrs
- 4.0%
Air-quality risk 2/10 · Minimal
- Unhealthy air days now
- 1 days/yr
- Unhealthy air days in 30 yrs
- 1 days/yr
Risk factors via First Street. Map © Google.
Why this score? — see what drove the C- grade
The composite is a weighted blend of 9 inputs, each scored 0–100. Each bar is that input's sub-score; the figure is the points it added to the 100-point composite (weight × sub-score).
- Cash flow +16.3/30.0
- Appreciation +10.0/10.0
- ARV discount +7.5/15.0
- DSCR +5.1/10.0
- 1% rule +4.2/10.0
- Livability +3.2/5.0
- Rent growth +2.5/5.0
- Condition / age +2.5/5.0
- Schools +2.3/10.0
$112,900
🖨 Deal sheet (PDF) 📄 Offer letter ✓ Due diligence
Listing remarks
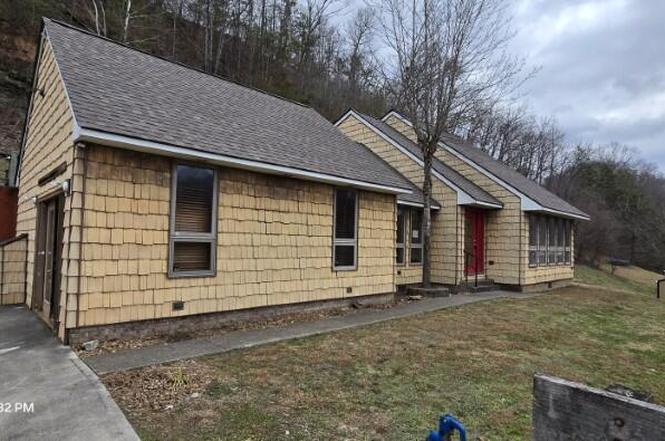
This property is eligible under the Freddie Mac First Look Initiative through 2/14/26. Make this fine home your own and complete the interior as you imagine your new home to be. Seller just installed new roof and the interior is yours to create the home you desire. This 1.5 story 3 bed 2 bath fixer upper will provide you with beautiful views of the valley around from your hillside home. Previous occupant damaged cabinets, bases and floor coverings but the shell is solid and ready for finishing touches. Please look at pictures and then schedule your visit.
Key facts
- Hillside home
- Beautiful views
- New roof
Tags
Neighborhood map
What this means for you Summary
Snapshot
- This is a 3-bed/2.0-bath single-family listed at $113k.
Deal economics
- At list price, monthly cash flow is $63 ($754/yr) — positive.
- The deal already cash-flows at list — no discount required.
- To meet the 1% rule (rent ≥ 1% of price), the offer needs to be $104k (8.3% below list).
- Recommended offer: $104k (8.3% below list) — sets the bar for 1% rule.
- Cap rate 7.0% vs local median 2.6% in Manchester — top-decile yield for the area; either an underpriced asset or a hidden risk that comps aren't pricing in. Stress-test before assuming the spread holds.
Location & tenants
- Location reads 64/100 on livability (#299 in KY) — a middle-class / working-renter tenant base. Strengths: cost of living A+, crime A-, health & safety A-; Watch: amenities F, commute F, employment F.
- Clay County (rural): math 21% / reading 37% proficiency, ranked #130 of 165 in KY (top 79%) — low school quality limits family demand, transient renter base, plan for 1-2y turnover; 66% free/reduced lunch — lower-income household profile, screen leases tightly.
- Zoned schools: Manchester Elementary School (math 36% / reading 40%, grade F, #242 of 676 statewide, top 37%, 388 students, 71% FRL); Clay County Middle School (math 21% / reading 38%, grade F, #151 of 217 statewide, top 71%, 407 students, 74% FRL); Clay County High School (math 17% / reading 27%, grade F, #202 of 254 statewide, top 82%, 717 students, 70% FRL).
- Market conditions: 85 active listings in the ZIP.
Forward outlook
- In year one you build about $12k of equity ($781 loan paydown + $11k appreciation (10.0% local appreciation)).
- Clay County population projected at -21% by 2050 — secular population decline; favor cash flow + early exit over multi-decade hold.
- At projected returns (10.0% appreciation + 3.0% rent growth), your $32k cash investment doubles in ~3 years — after that, you're playing with house money.
- By year 3, paydown + projected appreciation supports a ~$31k cash-out refi (75% LTV) — recoverable capital for the next deal without selling this one.
Negotiation context
- It's been on market 76 days — a 6% lower offer ($106k) is reasonable based on typical stale-listing flexibility.
Questions for the listing agent
- It's been on market 76 days. Have you received any prior offers? Is the seller open to a 8% concession, seller financing, or rate buy-down credit?
- Why hasn't it sold? Are there any deal-killer items the seller is aware of (foundation, flood, title, zoning, code violations)?
- Is there a deadline driving the sale (1031 exchange, divorce, estate, relocation)? That informs how much negotiation room exists.
- Schools are D-rated, which usually means shorter tenancies and higher turnover. Who's the typical renter profile here, and what's been the actual vacancy rate?
- What's the average days-on-market for RENTAL listings here right now (not sales)? A rising rental-DOM trend means longer vacancies and softer asking-rent achievability than the comps imply.
- What's the recent tenant-quality profile in this submarket — average credit score on applications, eviction rate, late-payment / NSF rate, and stable-employment percentage? A property-management company in the area should have these aggregated.
- How much new for-sale + rental construction is in the pipeline within 1–3 miles? Heavy new supply typically softens prices + rents 12–24 months out; constrained supply supports both.
Investment metrics
- 1% rule
- 0.92% ✗
- Cap rate
- 6.96%
- Cash-on-cash
- 2.38%
- DSCR
- 1.11
- GRM
- 9.1
CMA / ARV
No comps found within radius.
Projected returns pro-forma
10.0% appreciation · 3.0% rent growth · sell at horizon
- IRR
- 26.0%
- Equity multiple
- 3.07×
- Total profit
- $65,488
- Equity at exit
- $101,709
- IRR
- 22.8%
- Equity multiple
- 7.00×
- Total profit
- $189,708
- Equity at exit
- $219,340
Cash invested: $31,612 (down + closing). Projections, not guarantees.
Landlord ↔ Tenant lean methodology
- Overall (STATE)
- 83 Strongly Landlord-Friendly
- State Kentucky
- 83 Strongly Landlord-Friendly · R+16
- County
- — inherits STATE
- City
- — inherits STATE
ZIP-level market 40962
- Home prices YoY
- 21.0%
- Active inventory
- 85
- Price-to-rent
- 9.1×
Monthly cashflow live
- Estimated rent
- $1,036 medium interval (Pro) →
- Mortgage (P&I)
- −$592
- Tax from tax record
- −$116 /mo · $1,397/yr
- Insurance
- −$47
- HOA
- −$0
- Lot rent
- −$0
- Vacancy / Maint / Mgmt
- −$218
- Net cashflow
- $63
Break-even live
Sensitivity live
| Price | -10% $127 | -5% $95 | +0% $63 | +5% $31 | +10% $-1 |
|---|---|---|---|---|---|
| Rent | -10% $-19 | -5% $22 | +0% $63 | +5% $104 | +10% $145 |
| Rate | -1.0pp $120 | -0.5pp $92 | base $63 | +0.5pp $34 | +1.0pp $4 |
UW: 25.0% down · 7.5% · 30yr · 1.5% tax · 5.0% vac · 8.0% maint · 8.0% mgmt
Financing live
Cash to close
- Down payment
- $28,225
- Closing costs
- $3,387
- Reserves months
- —
- Total cash needed
- —
Loan-product check · same deal, 3 products live
Conventional
25% down · 7.5% · 30yr
- Down + closing
- —
- Monthly P&I
- —
- Monthly cashflow
- —
- DSCR
- —
- Eligible?
- —
Personal DTI + credit; lowest rate.
DSCR
20% down · 8.5% · 30yr
- Down + closing
- —
- Monthly P&I
- —
- Monthly cashflow
- —
- DSCR
- —
- Eligible?
- —
No personal income docs; deal must DSCR.
Hard money
10% down · 12.0% · 12mo
- Down + closing
- —
- Monthly P&I
- —
- Monthly cashflow
- —
- DSCR
- —
- Eligible?
- —
Short-term bridge; refi at stabilization.
Listing history 2 events
-
2026-04-01status Pending
-
2026-01-15$112,900 Active
ⓘ Source: listings_history table (triggers on properties + properties_extension) + one-shot
backfill from property_details.listing_events for pre-trigger history.
Tax reassessment forecast KY · Resets to sale price
- Current annual tax
- $1,397 · $116/mo
- Projected year-2 tax
- $1,397 · $116/mo
- Expected delta
- $0/yr ($0/mo · 0.0%)
ⓘ Screening estimate from a state-policy table — verify with the county assessor before closing.
Climate risk First Street
- Flood 1/10 Low FEMA zone X (unshaded) · 0% chance over 30 yrs
- Wildfire 4/10 Moderate
- Heat 4/10 Moderate 7 d/yr ≥100°F today · 19 d/yr by 30 yrs out
- Wind 2/10 Low 4% chance of damaging wind over 30 yrs
- Air quality 2/10 Low 1 unhealthy d/yr today · 1 by 30 yrs out
Nearby sold comps map
Loading sold comps map…
Walkable amenities ~0.75 mi
Loading nearby amenities…
Taxation est. · year 1
- Rental income
- $12,430
- − Mortgage interest
- −$6,324
- − Property taxes
- −$1,397
- − Insurance
- −$564
- − Repairs & maintenance
- −$994
- − Management
- −$994
- − Depreciation
- −$3,284
- Taxable loss
- −$1,129
- Est. tax savings @ 24.0%
- +$271
- After-tax cash flow
- $1,024/yr
For passive investors: Depreciation is non-cash, so a rental often shows a tax loss while cash-flowing — sheltering income. Rental losses are passive: they offset passive income freely, and up to $25,000/yr can offset ordinary (W-2) income if you actively participate and your MAGI is under $100k (phasing out to $0 by $150k); unused losses carry forward. On sale, claimed depreciation is recaptured at up to 25%, and gains may owe capital-gains tax (a 1031 exchange can defer both). Figures are a year-1 estimate at your 24.0% rate — not tax advice; consult a CPA.
Schools (NCES district)
- District
- Clay County
- NCES district ID
- 2101230
- Math proficiency
- 21% ▼ -30.00%
- Reading proficiency
- 37% ▼ -20.00%
- Median HH income
- $23,180
- Composite
- 22.75/100
- National rank
- #8031
- State rank
- #130 of 165 in KY
Livability — Manchester
- Score
- 64/100
- State rank
- #299
- US rank
- #14340
Category grades
Schools grade is shown separately in the Schools card above.
Census & demographics
- Population (ZIP)
- 17,390
Population outlook (Clay County) Hauer SSP2
- Today (2025)
- 20,004 people
- By 2030
- 19,285 · -3.6%
- By 2040
- 17,619 · -11.9%
- By 2050
- 15,782 · -21.1%
- By 2075
- 11,489 · -42.6%
- By 2100
- 7,949 · -60.3%
Race, ethnicity, and origin ACS 2023
- Neighborhood character
- Predominantly White (90%)
- Race & ethnicity
- White 90% Black 5% Two or more races 3% Hispanic / Latino 1%
- Common ancestry
- Slovak 2% Italian 1%
- Foreign-born
- 1% · Canada
- Languages at home
- 99% English-only · Spanish 1%
Political lean MEDSL · Clay
- 2024 margin
- Solid R (+80.3) · D 9.2% · R 89.5% · Other 1.3%
- 2008→2024 swing
- -23.9pp toward R · 2008: -56.5pp · 2024: -80.3pp
- All cycles
- 2024: R+80.3 2020: R+77.0 2016: R+75.6 2012: R+68.6 2008: R+56.5
Not yet ingested
- Civics
- —
Market trends
- HPI YoY
- ▲ 50.40%
- Current HPI
- 290.0025
- Rent YoY
- —
- Metro
- —
- State GDP YoY
- ▲ 1.81%
- F500 in state
- 4
Industry mix (Fortune 500 HQ in KY)
| Industry | F500 HQs | Revenue |
|---|---|---|
| Healthcare | 1 | $118B |
|
||
| Food / Beverage | 1 | $7B |
|
||
Price history
2 events — show timeline
- 2026-04-01 Pending — ImagineMLS
- 2026-01-15 Listed $112,900 ImagineMLS
Property tax history
+7.1%/yrLatest (2025): $1,397 · -0.1% YoY. Source: county tax records.
Cash-flow waterfall
monthlySold comps — $/sqft
last 12 mo · ≤1 miLoading sold comps…