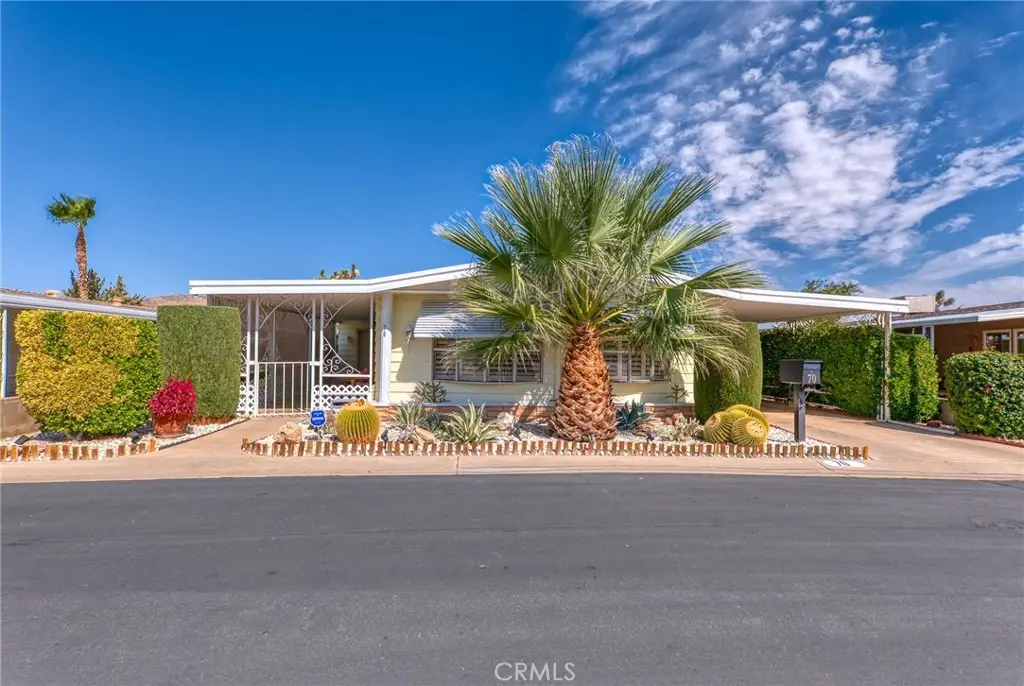
7501 Palm Ave Spc 70 · Yucca Valley, CA
Flood risk 1/10 · Minimal
- FEMA flood zone
- X (unshaded)
- Chance of flooding over 30 yrs
- 0.0%
- Est. flood insurance / yr
- $507 – $1,088
Fire risk 5/10 · Moderate
- Est. fire insurance / yr
- $659 – $1,223
Heat risk 6/10 · Moderate
- Hot days now (above 97°F)
- 7 days/yr
- Hot days in 30 yrs
- 21 days/yr
Wind risk 1/10 · Minimal
- Chance of severe wind over 30 yrs
- —
Air-quality risk 7/10 · Major
- Unhealthy air days now
- 13 days/yr
- Unhealthy air days in 30 yrs
- 17 days/yr
Risk factors via First Street. Map © Google.
Why this score? — see what drove the B- grade
The composite is a weighted blend of 9 inputs, each scored 0–100. Each bar is that input's sub-score; the figure is the points it added to the 100-point composite (weight × sub-score).
- Cash flow +30.0/30.0
- 1% rule +10.0/10.0
- DSCR +10.0/10.0
- ARV discount +7.5/15.0
- Rent growth +3.5/5.0
- Livability +3.0/5.0
- Condition / age +2.5/5.0
- Schools +2.2/10.0
- Appreciation +0.0/10.0
$129,900
🖨 Deal sheet 📄 Offer letter ✓ Due diligence
Listing remarks MLS
Welcome to your serene sanctuary in the highly sought-after Gates of Spain Mobile Home Park! A quiet, 55+ community nestled in the heart of the desert. Surrounded by stunning desert landscapes and breathtaking mountain views, this home offers the perfect blend of comfort, security, and tranquility. LUXURIOUS SPA-INSPIRED BATH EXPERIENCE: One of the standout features of this home is the like-new Safe Step walk-in tub, valued at over $30,000. Designed for both relaxation and healing, it includes all the premium features—hydrotherapy jets, heated seat, and Bluetooth pairing to stream your favorite calming music or podcasts while you unwind. CUSTOM KITCHEN UPGRADES: The interior has been recently remodeled, featuring a custom kitchen island that adds both function and flair—perfect for cooking, entertaining, or casual dining. SMART SECURITY & PEACE OF MIND: Stay secure with a camera surveillance system already installed. Simply connect with Brinks upon close of escrow to activate and personalize your home monitoring setup. OUTDOOR LIVING MADE EASY: Enjoy easy-care landscaping with automatic irrigation on a timer, so you can spend less time maintaining and more time enjoying the beautiful surroundings. NEW ROOF: The roof has been recently replaced by the previous owner, offering added peace of mind and long-term value. This home is more than just a place to live—it’s a lifestyle upgrade in one of the most peaceful, well-maintained 55+ communities around. Don’t miss the opportunity to call this desert gem your own!
Key facts
- Walk-in tub
- Automatic irrigation
- New roof
Tags
Neighborhood map
What this means for you Summary
Snapshot
- This is a 3-bed/2.0-bath manufactured listed at $130k.
Deal economics
- At list price, monthly cash flow is $949 ($11k/yr) — positive.
- The deal already cash-flows at list — no discount required.
- Meets the 1% rule at list price ($2k rent vs $130k).
- Recommended offer: $114k (12.0% below list) — sets the bar for market timing.
- Cap rate 15.1% vs local median 3.6% in Yucca Valley — top-decile yield for the area; either an underpriced asset or a hidden risk that comps aren't pricing in. Stress-test before assuming the spread holds.
Location & tenants
- Location reads 60/100 on livability (#566 in CA) — a middle-class / working-renter tenant base. Strengths: commute A+, housing A+; Watch: cost of living D+, schools F, crime D-.
- Morongo Unified (town): math 15% / reading 38% proficiency, ranked #395 of 517 in CA (top 76%) — low school quality limits family demand, transient renter base, plan for 1-2y turnover.
- Market conditions: Rents rising fast (+4.1%/yr); 563 active listings in the ZIP; 11 comparable units currently listed for rent nearby; rentals lingering (median 44d on market — plan ~5-8 weeks vacancy on turnover, expect pricing pressure); 73% of comp listings sitting > 30 days — soft ceiling on asking rent; 5,458 units permitted in San Bernardino County in 2024 (1,500 in 5+ unit buildings).
- At $2,337/mo this rent would consume 48% of the median local household income ($58k/yr) (locally 1132% of renters already pay >50% of income on rent) — very limited rent-growth headroom before tenants either downsize or default.
Forward outlook
- Local home prices are declining (-3.0%/yr); year-one equity from $898 of loan paydown is wiped out by about $4k of value loss. Plan a longer hold.
- San Bernardino County population projected at +15% by 2050 — modest demand growth; plan on rents tracking national, not racing it.
- At projected returns (-3.0% appreciation + 4.1% rent growth), your $36k cash investment doubles in ~4 years — after that, you're playing with house money.
Negotiation context
- It's been on market 245 days — a 12% lower offer ($114k) is reasonable based on typical stale-listing flexibility.
- 8 sale attempts since 14y ago; this cycle's ask has dropped $20k (13%) from the opening price — seller is motivated, your offer sets the floor, not the list.
- Current owner paid $20k; list at $130k implies a 550% gain — meaningful room to come down on a strong offer.
Risks & watch-outs
- Climate carrying-cost: moderate wildfire risk; extreme-heat days projected 7→21/yr by 2055 (HVAC capex compounding) — expect insurance premiums to compound above CPI over the hold.
Questions for the listing agent
- It's been on market 245 days. Have you received any prior offers? Is the seller open to a 12% concession, seller financing, or rate buy-down credit?
- Built in 1978 — when were the roof, HVAC, electrical panel, plumbing, and water heater last replaced?
- Why hasn't it sold? Are there any deal-killer items the seller is aware of (foundation, flood, title, zoning, code violations)?
- Is there a deadline driving the sale (1031 exchange, divorce, estate, relocation)? That informs how much negotiation room exists.
- Schools are F-rated, which usually means shorter tenancies and higher turnover. Who's the typical renter profile here, and what's been the actual vacancy rate?
- Crime grade is D in this area — have there been break-ins, vandalism, or insurance claims at this property in the last 3 years? What carrier currently insures it and at what premium?
- What's the average days-on-market for RENTAL listings here right now (not sales)? A rising rental-DOM trend means longer vacancies and softer asking-rent achievability than the comps imply.
- What's the recent tenant-quality profile in this submarket — average credit score on applications, eviction rate, late-payment / NSF rate, and stable-employment percentage? A property-management company in the area should have these aggregated.
- How much new for-sale + rental construction is in the pipeline within 1–3 miles? Heavy new supply typically softens prices + rents 12–24 months out; constrained supply supports both.
Investment metrics
- 1% rule
- 1.80% ✓
- Cap rate
- 15.06%
- Cash-on-cash
- 31.30%
- DSCR
- 2.39
- GRM
- 4.6
CMA / ARV
- ARV (median comp)
- $56,380
- List price
- $129,900
- Delta
- 130.40%
- Verdict
- OVERPRICED
- Comps
- 10 within 1.0 mi
Show comp detail 7 sales within ~0.75 mi
| Address | Dist | Beds/Ba | Sqft | Sold | Price | $/sf | Match |
|---|---|---|---|---|---|---|---|
| 7501 Palm #100 | 0.00mi | 2/2.0 (-1) | 1,760 (-1%) | 0mo | $129,900 | $74 | 92 |
| 7501 Palm Ave #111 | 0.00mi | 2/2.0 (-1) | 1,780 (-0%) | 11mo | $119,000 | $67 | 86 |
| 7501 Palm Ave #78 | 0.00mi | 3/2.0 | 1,800 (+1%) | 16mo | $115,000 | $64 | 85 |
| 7501 Palm Ave #145 | 0.00mi | 2/2.0 (-1) | 1,856 (+4%) | 5mo | $45,000 | $24 | 84 |
| 7501 Palm Ave #83 | 0.00mi | 2/2.0 (-1) | 1,703 (-4%) | 17mo | $67,500 | $40 | 74 |
| 7501-133 Palm Ave #133 | 0.00mi | 2/2.0 (-1) | 1,840 (+3%) | 23mo | $80,000 | $43 | 71 |
| 7501 Palm Ave #88 | 0.00mi | 2/2.0 (-1) | 1,536 (-14%) | 23mo | $92,000 | $60 | 52 |
Match score weights: distance 35% · size 25% · config 20% · recency 20%. Top-matched comps best support the ARV.
Projected returns pro-forma
-3.0% appreciation · 4.12% rent growth · sell at horizon
- IRR
- 27.4%
- Equity multiple
- 2.16×
- Total profit
- $42,073
- Equity at exit
- $19,369
- IRR
- 35.6%
- Equity multiple
- 4.46×
- Total profit
- $125,766
- Equity at exit
- $11,231
Cash invested: $36,372 (down + closing). Projections, not guarantees.
Landlord ↔ Tenant lean methodology
- Overall (STATE)
- 18 Strongly Tenant-Friendly
- State California
- 18 Strongly Tenant-Friendly · D+13
- County
- — inherits STATE
- City
- — inherits STATE
ZIP-level market 92284
- Home prices YoY
- -33.1%
- Rents YoY
- 4.1%
- Active inventory
- 563
- Price-to-rent
- 4.6×
Monthly cashflow live
- Estimated rent
- $2,337 high interval (Pro) →
- Mortgage (P&I)
- −$681
- Tax est. 1.5%
- −$162 /mo · $1,948/yr
- Insurance
- −$54
- HOA
- −$0
- Vacancy / Maint / Mgmt
- −$491
- Net cashflow
- $949
Break-even live
UW: 25.0% down · 7.5% · 30yr · 1.5% tax · 5.0% vac · 8.0% maint · 8.0% mgmt
Financing live
Cash to close
- Down payment
- $32,475
- Closing costs
- $3,897
- Reserves months
- —
- Total cash needed
- —
Loan-product check · same deal, 3 products live
Conventional
25% down · 7.5% · 30yr
- Down + closing
- —
- Monthly P&I
- —
- Monthly cashflow
- —
- DSCR
- —
- Eligible?
- —
Personal DTI + credit; lowest rate.
DSCR
20% down · 8.5% · 30yr
- Down + closing
- —
- Monthly P&I
- —
- Monthly cashflow
- —
- DSCR
- —
- Eligible?
- —
No personal income docs; deal must DSCR.
Hard money
10% down · 12.0% · 12mo
- Down + closing
- —
- Monthly P&I
- —
- Monthly cashflow
- —
- DSCR
- —
- Eligible?
- —
Short-term bridge; refi at stabilization.
Rent comps 11 comps
| Address | Beds | Baths | Sqft | Rent | $/sqft | DOM | Units | Dist |
|---|---|---|---|---|---|---|---|---|
| 7448 Del Rio Vis Yucca Valley, CA | 3.0 | 4.0 | 1770 | $2,500 | $1.41 | 44d | 1 | 0.15mi |
| 7397 Village Way Yucca Valley, CA | 3.0 | 2.0 | 1501 | $2,000 | $1.33 | 44d | 1 | 0.20mi |
| 7453 Dumosa Ave Yucca Valley, CA | 3.0 | 2.0 | 1394 | $2,200 | $1.58 | 44d | 1 | 0.69mi |
| 56594 Joshua Dr Yucca Valley, CA | 3.0 | 2.0 | 1307 | $2,250 | $1.72 | 44d | 1 | 0.74mi |
| 56769 Joshua Dr Unit Main Home Yucca Valley, CA | 3.0 | 2.0 | 2000 | $2,400 | $1.20 | 2d | 1 | 0.81mi |
| 56615 Bonanza Dr Yucca Valley, CA | 2.0 | 1.5 | 1342 | $1,900 | $1.42 | 17d | 1 | 0.94mi |
| 55897 Santa Fe Trl Yucca Valley, CA | 3.0 | 2.0 | 1701 | $2,300 | $1.35 | 2d | 1 | 0.95mi |
| 56811 Desert Gold Dr Yucca Valley, CA | 3.0 | 2.0 | 1375 | $2,095 | $1.52 | 44d | 1 | 1.11mi |
| 56996 Crestview Dr Yucca Valley, CA | 3.0 | 3.0 | 2432 | $3,500 | $1.44 | 44d | 1 | 1.11mi |
| 7420 Geronimo Trl Yucca Valley, CA | 3.0 | 1.0 | 1280 | $1,700 | $1.33 | 44d | 1 | 1.22mi |
| 8523 Barberry Ave Yucca Valley, CA | 3.0 | 2.0 | 1448 | $3,325 | $2.30 | 44d | 1 | 1.41mi |
Listing history 24 events
-
2026-06-01days on market $129,900 Active 245 DOM
-
2026-05-31days on market $129,900 Active 244 DOM
-
2025-10-24price $129,900 1570-char remark
Show marketing remark (1570 chars)
Welcome to your serene sanctuary in the highly sought-after Gates of Spain Mobile Home Park! A quiet, 55+ community nestled in the heart of the desert. Surrounded by stunning desert landscapes and breathtaking mountain views, this home offers the perfect blend of comfort, security, and tranquility. LUXURIOUS SPA-INSPIRED BATH EXPERIENCE: One of the standout features of this home is the like-new Safe Step walk-in tub, valued at over $30,000. Designed for both relaxation and healing, it includes all the premium features—hydrotherapy jets, heated seat, and Bluetooth pairing to stream your favorite calming music or podcasts while you unwind. CUSTOM KITCHEN UPGRADES: The interior has been recently remodeled, featuring a custom kitchen island that adds both function and flair—perfect for cooking, entertaining, or casual dining. SMART SECURITY & PEACE OF MIND: Stay secure with a camera surveillance system already installed. Simply connect with Brinks upon close of escrow to activate and personalize your home monitoring setup. OUTDOOR LIVING MADE EASY: Enjoy easy-care landscaping with automatic irrigation on a timer, so you can spend less time maintaining and more time enjoying the beautiful surroundings. NEW ROOF: The roof has been recently replaced by the previous owner, offering added peace of mind and long-term value. This home is more than just a place to live—it’s a lifestyle upgrade in one of the most peaceful, well-maintained 55+ communities around. Don’t miss the opportunity to call this desert gem your own!
-
2025-09-29$149,900 Active 1570-char remark
Show marketing remark (1570 chars)
Welcome to your serene sanctuary in the highly sought-after Gates of Spain Mobile Home Park! A quiet, 55+ community nestled in the heart of the desert. Surrounded by stunning desert landscapes and breathtaking mountain views, this home offers the perfect blend of comfort, security, and tranquility. LUXURIOUS SPA-INSPIRED BATH EXPERIENCE: One of the standout features of this home is the like-new Safe Step walk-in tub, valued at over $30,000. Designed for both relaxation and healing, it includes all the premium features—hydrotherapy jets, heated seat, and Bluetooth pairing to stream your favorite calming music or podcasts while you unwind. CUSTOM KITCHEN UPGRADES: The interior has been recently remodeled, featuring a custom kitchen island that adds both function and flair—perfect for cooking, entertaining, or casual dining. SMART SECURITY & PEACE OF MIND: Stay secure with a camera surveillance system already installed. Simply connect with Brinks upon close of escrow to activate and personalize your home monitoring setup. OUTDOOR LIVING MADE EASY: Enjoy easy-care landscaping with automatic irrigation on a timer, so you can spend less time maintaining and more time enjoying the beautiful surroundings. NEW ROOF: The roof has been recently replaced by the previous owner, offering added peace of mind and long-term value. This home is more than just a place to live—it’s a lifestyle upgrade in one of the most peaceful, well-maintained 55+ communities around. Don’t miss the opportunity to call this desert gem your own!
-
2025-07-18status Pending Sale
-
2025-05-22historical Active Under Contract
-
2025-05-22historical
-
2025-05-17price $140,000
-
2025-03-05$150,000 Active
-
2024-12-31historical
-
2024-08-06$150,000 Active
-
2024-02-10historical
-
2023-12-03$150,000 Active
-
2023-11-29historical
-
2023-05-30price $164,999
-
2023-05-26$175,000 Active
-
2017-11-06historical
-
2017-08-27$45,900 Active
-
2015-04-30soldstatus $20,000 Closed Sale
-
2015-04-20status Pending Sale
-
2015-03-18$27,500 Active
-
2012-03-02soldstatus $24,000 Closed
-
2012-02-08status Pending
-
2012-01-30$24,000 Active
ⓘ Source: listings_history table (triggers on properties + properties_extension) + one-shot
backfill from property_details.listing_events for pre-trigger history.
Climate risk First Street
- Flood 1/10 Low FEMA zone X (unshaded) · 0% chance over 30 yrs
- Wildfire 5/10 Major
- Heat 6/10 Major 7 d/yr ≥97°F today · 21 d/yr by 30 yrs out
- Wind 1/10 Low
- Air quality 7/10 Severe 13 unhealthy d/yr today · 17 by 30 yrs out
Nearby sold comps map
Loading sold comps map…
Walkable amenities ~0.75 mi
Loading nearby amenities…
Taxation est. · year 1
- Rental income
- $28,047
- − Mortgage interest
- −$7,276
- − Property taxes
- −$1,948
- − Insurance
- −$650
- − Repairs & maintenance
- −$2,244
- − Management
- −$2,244
- − Depreciation
- −$3,779
- Taxable income
- $9,906
- Est. tax owed @ 24.0%
- −$2,377
- After-tax cash flow
- $9,007/yr
For passive investors: Depreciation is non-cash, so a rental often shows a tax loss while cash-flowing — sheltering income. Rental losses are passive: they offset passive income freely, and up to $25,000/yr can offset ordinary (W-2) income if you actively participate and your MAGI is under $100k (phasing out to $0 by $150k); unused losses carry forward. On sale, claimed depreciation is recaptured at up to 25%, and gains may owe capital-gains tax (a 1031 exchange can defer both). Figures are a year-1 estimate at your 24.0% rate — not tax advice; consult a CPA.
Schools (NCES district)
- District
- Morongo Unified
- NCES district ID
- 0625860
- Math proficiency
- 15% ▼ -12.00%
- Reading proficiency
- 38% ▼ -3.00%
- Median HH income
- $39,399
- Composite
- 22.19/100
- National rank
- #8156
- State rank
- #395 of 517 in CA
Livability — Yucca Valley
- Score
- 60/100
- State rank
- #566
- US rank
- #18584
Category grades
Schools grade is shown separately in the Schools card above.
Census & demographics
- Census place
- Yucca Valley, CA
- County
- San Bernardino County · 2,030,291 people
- City population
- 25,415
- Metro
- Riverside-San Bernardino-Ontario, CA
- Population (ZIP)
- 25,415
- Household income
- $58,373
- Rent vs Own
- Severe rent burden
- 1132.0
Population outlook (San Bernardino County) Hauer SSP2
- Today (2025)
- 2,300,329 people
- By 2030
- 2,378,907 · +3.4%
- By 2040
- 2,523,137 · +9.7%
- By 2050
- 2,642,388 · +14.9%
- By 2075
- 2,880,769 · +25.2%
- By 2100
- 2,909,436 · +26.5%
Race, ethnicity, and origin ACS 2023
- Neighborhood character
- Diverse neighborhood (Simpson 0.55)
- Race & ethnicity
- White 62% Hispanic / Latino 25% Two or more races 18% Black 2% Native American 2% Asian 2% Pacific Islander 1%
- Hispanic origin (detail)
- Mexican 20%
- Common ancestry
- Italian 4% Romanian 2% Slovak 2%
- Foreign-born
- 9% · Canada
- Languages at home
- 82% English-only · Spanish 14% Other Indo-European 1% Other Asian/Pacific 1%
Political lean MEDSL · San Bernardino
- 2024 margin
- Toss-up / Even · D 47.5% · R 49.7% · Other 2.8%
- 2008→2024 swing
- -8.5pp toward R · 2008: 6.3pp · 2024: -2.1pp
- All cycles
- 2024: R+2.1 2020: D+10.7 2016: D+9.8 2012: D+5.4 2008: D+6.3
Not yet ingested
- Civics
- —
Market trends
- HPI YoY
- ▼ -241.13%
- Current HPI
- 486.7185
- Rent YoY
- ▲ 4.12%
- Metro
- Riverside-San Bernardino-Ontario, CA
- State GDP YoY
- ▲ 3.21%
- F500 in state
- 116
Industry mix (Fortune 500 HQ in CA)
| Industry | F500 HQs | Revenue |
|---|---|---|
| Technology | 27 | $1,492B |
|
||
| Financial Services | 3 | $174B |
|
||
| Retail | 3 | $44B |
|
||
| Insurance | 3 | $26B |
|
||
| Media / Entertainment | 2 | $115B |
|
||
| Pharmaceuticals / Biotech | 2 | $62B |
|
||
Price history
+441.2% since first listed22 events — show timeline
- 2025-10-24 Price Changed $129,900 CRMLS
- 2025-09-29 Listed $149,900 CRMLS
- 2025-07-18 Pending — CRMLS
- 2025-05-22 Contingent — CRMLS
- 2025-05-22 Listing Removed — CRMLS
- 2025-05-17 Price Changed $140,000 CRMLS
- 2025-03-05 Listed $150,000 CRMLS
- 2024-12-31 Listing Removed — CRMLS
- 2024-08-06 Listed $150,000 CRMLS
- 2024-02-10 Listing Removed — CRMLS
- 2023-12-03 Listed $150,000 CRMLS
- 2023-11-29 Listing Removed — CRMLS
- 2023-05-30 Price Changed $164,999 CRMLS
- 2023-05-26 Listed $175,000 CRMLS
- 2017-11-06 Listing Removed — CRMLS
- 2017-08-27 Listed $45,900 CRMLS
- 2015-04-30 Sold (MLS) $20,000 CRMLS
- 2015-04-20 Pending — CRMLS
- 2015-03-18 Listed $27,500 CRMLS
- 2012-03-02 Sold (MLS) $24,000 CRMLS
- 2012-02-08 Pending — CRMLS
- 2012-01-30 Listed $24,000 CRMLS
Property tax history
+9.2%/yrLatest (2025): $130 · +3.2% YoY. Source: county tax records.
Cash-flow waterfall
monthlySold comps — $/sqft
last 12 mo · ≤1 miLoading sold comps…