 Triplex
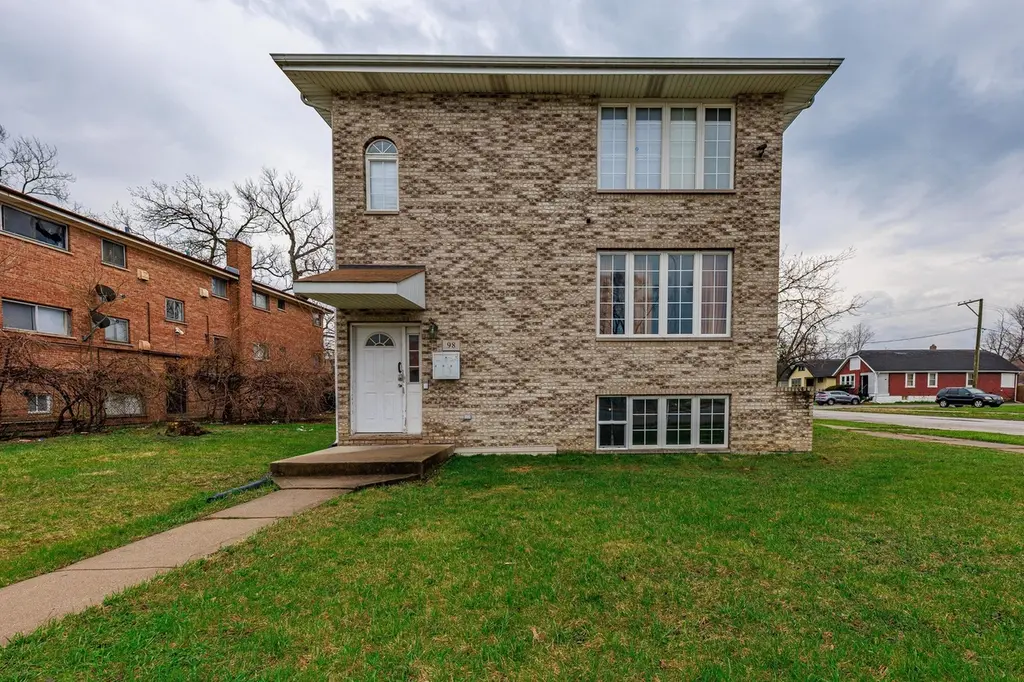
98 W 154th St · Harvey, IL
Flood risk 4/10 · Minor
- FEMA flood zone
- X (unshaded)
- Chance of flooding over 30 yrs
- 0.22%
- Est. flood insurance / yr
- $473 – $860
Fire risk 1/10 · Minimal
- Est. fire insurance / yr
- $804 – $1,492
Heat risk 3/10 · Minor
- Hot days now (above 102°F)
- 7 days/yr
- Hot days in 30 yrs
- 15 days/yr
Wind risk 2/10 · Minimal
- Chance of severe wind over 30 yrs
- —
Air-quality risk 3/10 · Minor
- Unhealthy air days now
- 4 days/yr
- Unhealthy air days in 30 yrs
- 4 days/yr
Risk factors via First Street. Map © Google.
Why this score? — see what drove the B+ grade
The composite is a weighted blend of 9 inputs, each scored 0–100. Each bar is that input's sub-score; the figure is the points it added to the 100-point composite (weight × sub-score).
- Cash flow +30.0/30.0
- 1% rule +10.0/10.0
- DSCR +10.0/10.0
- Appreciation +10.0/10.0
- ARV discount +7.5/15.0
- Livability +3.4/5.0
- Rent growth +2.5/5.0
- Condition / age +2.5/5.0
- Schools +0.7/10.0
$280,000
🖨 Deal sheet (PDF) 📄 Offer letter ✓ Due diligence
Multi-family units
County records classify this as Multi-Family (2-4 Unit). Listing-text estimate: 3 units. confirmed
Listing remarks
Cash-flowing 3-unit property generating approximately $4,800 per month. Built in 2010, this well-maintained building features spacious 3-bedroom, 2-bath units, with furnaces and water heaters in great condition. Two units are currently vacant, offering immediate rental upside, while one unit is occupied by a month-to-month tenant, providing flexibility for investors or owner-occupants. One unit requires some TLC, creating a great value-add opportunity. Finished units must be viewed in person to fully appreciate the condition and layout. Conveniently located near I-294 and the University of Chicago Hospital. Property is being sold as-is.
Key facts
- 3 unit property
- Rental upside
- Conveniently located
Tags
Property features AI
Finance
- Other: Three-unit building (total units: 3); Possession at closing
- Financial info: Special service area: No
Exterior
- Parking: Two owned parking spaces
- Utilities: Water from Lake Michigan and public supply; Public sewer
- Home design: Two- to four-unit property; Fee simple ownership; Approximately 16–20 years old; Brick construction
- Construction: Brick exterior
- Exterior features: Lot dimensions approximately 25 x 125; Lot smaller than 0.25 acre
Interior
- Kitchen: Each unit includes a stove and refrigerator
- Bedrooms: Nine total bedrooms; Three 3-bedroom units in the building
- Bathrooms: Six full bathrooms
- Heating & cooling: Natural gas heating
- Interior features: 24 total rooms; Unfinished/partial basement
- Laundry & utility: Tenant utilities vary by unit (some pay electric, gas, heat; others pay nothing)
Neighborhood map
What this means for you Summary
Snapshot
- This is a 3 × 3-bed/2.0-bath units multifamily listed at $280k.
Deal economics
- At list price, monthly cash flow is $2k ($30k/yr) — positive. Per door: $826/mo.
- The deal already cash-flows at list — no discount required.
- Meets the 1% rule at list price ($6k rent vs $280k).
- Recommended offer: $263k (6.0% below list) — sets the bar for market timing.
- Cap rate 16.9% vs local median 9.3% in Harvey — top-decile yield for the area; either an underpriced asset or a hidden risk that comps aren't pricing in. Stress-test before assuming the spread holds.
Location & tenants
- Location reads 67/100 on livability (#539 in IL) — a middle-class / working-renter tenant base. Strengths: commute A+, cost of living A+, housing A-; Watch: health & safety D+, crime F, amenities F.
- Thornton Twp Hsd 205 (suburban): math 7% / reading 8% proficiency, ranked #594 of 620 in IL (top 96%) — low school quality limits family demand, transient renter base, plan for 1-2y turnover.
- Zoned schools: Rosa L Parks Middle School (319 students, 0% FRL); Thornton Township High School (math 7% / reading 7%, grade F, #605 of 693 statewide, top 87%, 1,628 students, 0% FRL).
- Market conditions: 133 active listings in the ZIP; 6,272 units permitted in Cook County in 2024 (4,658 in 5+ unit buildings).
Forward outlook
- In year one you build about $30k of equity ($2k loan paydown + $28k appreciation (10.0% local appreciation)).
- At projected returns (10.0% appreciation + 3.0% rent growth), your $78k cash investment doubles in ~2 years — after that, you're playing with house money.
- By year 2, paydown + projected appreciation supports a ~$48k cash-out refi (75% LTV) — recoverable capital for the next deal without selling this one.
Negotiation context
- It's been on market 80 days — a 6% lower offer ($263k) is reasonable based on typical stale-listing flexibility.
- 9 sale attempts since 11y ago; this cycle's ask has dropped $20k (7%) from the opening price — seller is motivated, your offer sets the floor, not the list.
Questions for the listing agent
- It's been on market 80 days. Have you received any prior offers? Is the seller open to a 6% concession, seller financing, or rate buy-down credit?
- Can we see the unit-by-unit rent roll, current vacancy, and any below-market leases? What's the average tenancy length?
- What capital expenditures (roof, boiler, parking lot, exteriors) have been made in the last 5 years, and what's planned in the next 2?
- Why hasn't it sold? Are there any deal-killer items the seller is aware of (foundation, flood, title, zoning, code violations)?
- Is there a deadline driving the sale (1031 exchange, divorce, estate, relocation)? That informs how much negotiation room exists.
- Schools are F-rated, which usually means shorter tenancies and higher turnover. Who's the typical renter profile here, and what's been the actual vacancy rate?
- Crime grade is F in this area — have there been break-ins, vandalism, or insurance claims at this property in the last 3 years? What carrier currently insures it and at what premium?
- What's the average days-on-market for RENTAL listings here right now (not sales)? A rising rental-DOM trend means longer vacancies and softer asking-rent achievability than the comps imply.
- What's the recent tenant-quality profile in this submarket — average credit score on applications, eviction rate, late-payment / NSF rate, and stable-employment percentage? A property-management company in the area should have these aggregated.
- How much new apartment / multifamily construction is in the pipeline within 1–3 miles? Heavy new supply (>2% of stock underway) typically softens rents 12–24 months out; light construction supports rent growth.
Investment metrics
- 1% rule
- 1.99% ✓
- Cap rate
- 16.91%
- Cash-on-cash
- 37.92%
- DSCR
- 2.69
- GRM
- 4.2
CMA / ARV
No comps found within radius.
Projected returns pro-forma
10.0% appreciation · 3.0% rent growth · sell at horizon
- IRR
- 53.5%
- Equity multiple
- 4.96×
- Total profit
- $310,350
- Equity at exit
- $252,246
- IRR
- 47.1%
- Equity multiple
- 11.08×
- Total profit
- $790,027
- Equity at exit
- $543,978
Cash invested: $78,400 (down + closing). Projections, not guarantees.
Landlord ↔ Tenant lean methodology
- Overall (STATE)
- 43 Moderately Tenant-Leaning
- State Illinois
- 43 Moderately Tenant-Leaning · D+7
- County
- — inherits STATE
- City
- — inherits STATE
ZIP-level market 60426
- Home prices YoY
- 6.9%
- Active inventory
- 133
- Price-to-rent
- 12.5×
Monthly cashflow live
- Estimated rent
- $5,585 medium interval (Pro) →
- Mortgage (P&I)
- −$1,468
- Tax est. 1.5%
- −$350 /mo · $4,200/yr
- Insurance
- −$117
- HOA
- −$0
- Vacancy / Maint / Mgmt
- −$1,173
- Net cashflow
- $2,477
Break-even live
Sensitivity live
| Price | -10% $2,671 | -5% $2,574 | +0% $2,477 | +5% $2,380 | +10% $2,284 |
|---|---|---|---|---|---|
| Rent | -10% $2,036 | -5% $2,257 | +0% $2,477 | +5% $2,698 | +10% $2,918 |
| Rate | -1.0pp $2,618 | -0.5pp $2,548 | base $2,477 | +0.5pp $2,405 | +1.0pp $2,331 |
3-unit breakdown (identical units grouped — click to expand)
| Units | Beds | Baths | Est. rent |
|---|---|---|---|
| 3× units | 3 | 2 | $5,586 |
| #1 | 3 | 2 | $1,862 |
| #2 | 3 | 2 | $1,862 |
| #3 | 3 | 2 | $1,862 |
| Total (3 units) | $5,585 | ||
UW: 25.0% down · 7.5% · 30yr · 1.5% tax · 5.0% vac · 8.0% maint · 8.0% mgmt
Financing live
Cash to close
- Down payment
- $70,000
- Closing costs
- $8,400
- Reserves months
- —
- Total cash needed
- —
Loan-product check · same deal, 3 products live
Conventional
25% down · 7.5% · 30yr
- Down + closing
- —
- Monthly P&I
- —
- Monthly cashflow
- —
- DSCR
- —
- Eligible?
- —
Personal DTI + credit; lowest rate.
DSCR
20% down · 8.5% · 30yr
- Down + closing
- —
- Monthly P&I
- —
- Monthly cashflow
- —
- DSCR
- —
- Eligible?
- —
No personal income docs; deal must DSCR.
Hard money
10% down · 12.0% · 12mo
- Down + closing
- —
- Monthly P&I
- —
- Monthly cashflow
- —
- DSCR
- —
- Eligible?
- —
Short-term bridge; refi at stabilization.
Listing history 43 events
-
2026-06-21days on market $280,000 Active 80 DOM
-
2026-06-18days on market $280,000 Active 77 DOM
-
2026-06-17days on market $280,000 Active 76 DOM
-
2026-06-16days on market $280,000 Active 75 DOM
-
2026-06-15days on market $280,000 Active 74 DOM
-
2026-06-13days on market $280,000 Active 72 DOM
-
2026-06-13days on market $280,000 Active 71 DOM
-
2026-06-09days on market $280,000 Active 68 DOM
-
2026-06-08days on market $280,000 Active 67 DOM
-
2026-06-07days on market $280,000 Active 66 DOM
-
2026-06-04days on market $280,000 Active 63 DOM
-
2026-06-03days on market $280,000 Active 62 DOM
-
2026-06-02days on market $280,000 Active 61 DOM
-
2026-06-01days on market $280,000 Active 60 DOM
-
2026-05-31days on market $280,000 Active 59 DOM
-
2026-04-21price $280,000
-
2026-04-04price $299,999
-
2026-04-02$299,900 Active
-
2026-03-17historical
-
2026-01-21price
-
2025-12-30status Active
-
2025-11-18historical Contingent - Continue to Show
-
2025-10-30Active
-
2025-09-30historical
-
2025-05-22status Active
-
2025-04-25historical Contingent - Continue to Show
-
2025-01-31status Active
-
2025-01-21historical Contingent - No Showings
-
2025-01-10price
-
2025-01-10price
-
2024-05-06Active
-
2017-01-11historical
-
2016-12-27status Reactivated
-
2016-12-02historical Contingent
-
2016-11-10price
-
2016-11-04price
-
2016-10-28price
-
2016-10-16price
-
2016-10-10price
-
2016-10-04New
-
2015-12-31historical
-
2015-09-16price
-
2015-08-07New
ⓘ Source: listings_history table (triggers on properties + properties_extension) + one-shot
backfill from property_details.listing_events for pre-trigger history.
Climate risk First Street
- Flood 4/10 Moderate FEMA zone X (unshaded) · 22% chance over 30 yrs
- Wildfire 1/10 Low
- Heat 3/10 Moderate 7 d/yr ≥102°F today · 15 d/yr by 30 yrs out
- Wind 2/10 Low
- Air quality 3/10 Moderate 4 unhealthy d/yr today · 4 by 30 yrs out
Nearby sold comps map
Loading sold comps map…
Walkable amenities ~0.75 mi
Loading nearby amenities…
Taxation est. · year 1
- Rental income
- $67,020
- − Mortgage interest
- −$15,684
- − Property taxes
- −$4,200
- − Insurance
- −$1,400
- − Repairs & maintenance
- −$5,362
- − Management
- −$5,362
- − Depreciation
- −$8,145
- Taxable income
- $26,867
- Est. tax owed @ 24.0%
- −$6,448
- After-tax cash flow
- $23,278/yr
For passive investors: Depreciation is non-cash, so a rental often shows a tax loss while cash-flowing — sheltering income. Rental losses are passive: they offset passive income freely, and up to $25,000/yr can offset ordinary (W-2) income if you actively participate and your MAGI is under $100k (phasing out to $0 by $150k); unused losses carry forward. On sale, claimed depreciation is recaptured at up to 25%, and gains may owe capital-gains tax (a 1031 exchange can defer both). Figures are a year-1 estimate at your 24.0% rate — not tax advice; consult a CPA.
Schools (NCES district)
- District
- Thornton Twp Hsd 205
- NCES district ID
- 1738970
- Math proficiency
- 7% ▬ 0.00%
- Reading proficiency
- 8% ▼ -2.00%
- Median HH income
- $43,392
- Composite
- 6.92/100
- National rank
- #9976
- State rank
- #594 of 620 in IL
Livability — Harvey
- Score
- 67/100
- State rank
- #539
- US rank
- #11162
Category grades
Schools grade is shown separately in the Schools card above.
Census & demographics
- Census place
- Harvey, IL
- City population
- 23,066
- Population (ZIP)
- 23,066
Population outlook (Cook County) Hauer SSP2
- Today (2025)
- 5,347,519 people
- By 2030
- 5,357,703 · +0.2%
- By 2040
- 5,324,924 · -0.4%
- By 2050
- 5,230,762 · -2.2%
- By 2075
- 4,785,735 · -10.5%
- By 2100
- 4,188,836 · -21.7%
Race, ethnicity, and origin ACS 2023
- Neighborhood character
- Majority Black (59%)
- Race & ethnicity
- Black 59% Hispanic / Latino 33% Two or more races 12% White 3% Asian 2%
- Hispanic origin (detail)
- Mexican 31%
- Foreign-born
- 17% · Canada
- Languages at home
- 67% English-only · Spanish 30% Other Indo-European 2% French/Haitian/Cajun 1%
Political lean MEDSL · Cook
- 2024 margin
- Solid D (+42.0) · D 70.4% · R 28.4% · Other 1.2%
- 2008→2024 swing
- -11.4pp toward R · 2008: 53.4pp · 2024: 42.0pp
- All cycles
- 2024: D+42.0 2020: D+50.3 2016: D+53.0 2012: D+49.4 2008: D+53.4
Not yet ingested
- Civics
- —
Market trends
- HPI YoY
- ▲ 20.36%
- Current HPI
- 313.7895
- Rent YoY
- —
- Metro
- —
- State GDP YoY
- ▲ 1.59%
- F500 in state
- 60
Industry mix (Fortune 500 HQ in IL)
| Industry | F500 HQs | Revenue |
|---|---|---|
| Insurance | 4 | $201B |
|
||
| Consumer Goods | 4 | $87B |
|
||
| Industrial Machinery | 3 | $64B |
|
||
| Healthcare | 2 | $55B |
|
||
| Retail / Pharmacy | 1 | $148B |
|
||
| Agriculture / Food | 1 | $86B |
|
||
Price history
-6.6% since first listed28 events — show timeline
- 2026-04-21 Price Changed $280,000 MRED as Distributed by MLS Grid
- 2026-04-04 Price Changed $299,999 MRED as Distributed by MLS Grid
- 2026-04-02 Listed $299,900 MRED as Distributed by MLS Grid
- 2026-03-17 Listing Removed — MRED as Distributed by MLS Grid
- 2026-01-21 Price Changed — MRED as Distributed by MLS Grid
- 2025-12-30 Relisted — MRED as Distributed by MLS Grid
- 2025-11-18 Contingent — MRED as Distributed by MLS Grid
- 2025-10-30 Listed — MRED as Distributed by MLS Grid
- 2025-09-30 Listing Removed — MRED as Distributed by MLS Grid
- 2025-05-22 Relisted — MRED as Distributed by MLS Grid
- 2025-04-25 Contingent — MRED as Distributed by MLS Grid
- 2025-01-31 Relisted — MRED as Distributed by MLS Grid
- 2025-01-21 Contingent — MRED as Distributed by MLS Grid
- 2025-01-10 Price Changed — MRED as Distributed by MLS Grid
- 2025-01-10 Price Changed — MRED as Distributed by MLS Grid
- 2024-05-06 Listed — MRED as Distributed by MLS Grid
- 2017-01-11 Listing Removed — MRED as Distributed by MLS Grid
- 2016-12-27 Relisted — MRED as Distributed by MLS Grid
- 2016-12-02 Contingent — MRED as Distributed by MLS Grid
- 2016-11-10 Price Changed — MRED as Distributed by MLS Grid
- 2016-11-04 Price Changed — MRED as Distributed by MLS Grid
- 2016-10-28 Price Changed — MRED as Distributed by MLS Grid
- 2016-10-16 Price Changed — MRED as Distributed by MLS Grid
- 2016-10-10 Price Changed — MRED as Distributed by MLS Grid
- 2016-10-04 Listed — MRED as Distributed by MLS Grid
- 2015-12-31 Listing Removed — MRED as Distributed by MLS Grid
- 2015-09-16 Price Changed — MRED as Distributed by MLS Grid
- 2015-08-07 Listed — MRED as Distributed by MLS Grid
Property tax history
-2.0%/yrLatest (2023): $14,188 · -4.2% YoY. Source: county tax records.
Cash-flow waterfall
monthlySold comps — $/sqft
last 12 mo · ≤1 miLoading sold comps…