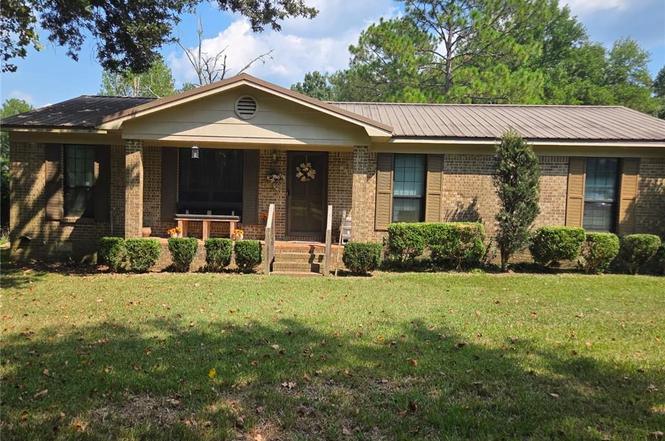
395 Norton Rd · Mobile, AL
Flood risk 1/10 · Minimal
- FEMA flood zone
- X (unshaded)
- Chance of flooding over 30 yrs
- 0.0%
- Est. flood insurance / yr
- $507 – $1,088
Fire risk 6/10 · Moderate
- Est. fire insurance / yr
- $916 – $1,700
Heat risk 9/10 · Severe
- Hot days now (above 105°F)
- 7 days/yr
- Hot days in 30 yrs
- 20 days/yr
Wind risk 9/10 · Severe
- Chance of severe wind over 30 yrs
- 99.0%
Air-quality risk 1/10 · Minimal
- Unhealthy air days now
- 0 days/yr
- Unhealthy air days in 30 yrs
- 0 days/yr
Risk factors via First Street. Map © Google.
Why this score? — see what drove the C grade
The composite is a weighted blend of 9 inputs, each scored 0–100. Each bar is that input's sub-score; the figure is the points it added to the 100-point composite (weight × sub-score).
- Cash flow +19.5/30.0
- ARV discount +15.0/15.0
- DSCR +6.2/10.0
- 1% rule +4.1/10.0
- Rent growth +4.0/5.0
- Livability +3.8/5.0
- Condition / age +2.5/5.0
- Schools +2.3/10.0
- Appreciation +0.0/10.0
$170,000
🖨 Deal sheet (PDF) 📄 Offer letter ✓ Due diligence
Listing remarks MLS
This Brick home is tucked away in the Tosh Acres neighborhood off of Snow Road. It has a partially fenced back yard, double paned windows and a metal roof. The bathrooms have been renovated! Looking for a traditional brick ranch to fix up? This is the house for you! This one has a formal living/dining room and family room! Part of an estate - must have probate approval - SOLD AS IS!!
Key facts
- Spacious family room
- 0.5 acre lot
- Built 1978
Tags
Neighborhood map
What this means for you Summary
Snapshot
- This is a 3-bed/2.0-bath single-family listed at $170k.
Deal economics
- At list price, monthly cash flow is $194 ($2k/yr) — positive.
- The deal already cash-flows at list — no discount required.
- To meet the 1% rule (rent ≥ 1% of price), the offer needs to be $155k (8.7% below list).
- Recommended offer: $150k (12.0% below list) — sets the bar for market timing.
- Cap rate 7.7% vs local median 4.9% in Mobile — top-decile yield for the area; either an underpriced asset or a hidden risk that comps aren't pricing in. Stress-test before assuming the spread holds.
Location & tenants
- Location reads 75/100 on livability (#20 in AL, #4,262 nationally) — a middle-class / working-renter tenant base. Strengths: commute A+, cost of living A+, housing A+; Watch: crime F, employment D-.
- Mobile County (urban): math 15% / reading 39% proficiency, ranked #81 of 129 in AL (top 63%) — low school quality limits family demand, transient renter base, plan for 1-2y turnover; 67% free/reduced lunch — lower-income household profile, screen leases tightly.
- Zoned schools: Elsie Collier Elementary School (math 35% / reading 61%, grade D, #135 of 627 statewide, top 22%, 743 students, 55% FRL); Bernice J Causey Middle School (math 17% / reading 51%, grade F, #98 of 257 statewide, top 38%, 1,418 students, 53% FRL); Baker High School (math 25% / reading 28%, grade F, #107 of 305 statewide, top 36%, 2,491 students, 42% FRL) — zoned schools average 50% FRL vs 67% district-wide (18 pts lower); this property's tenant base skews higher-income than the district average.
- Market conditions: Rents rising fast (+6.2%/yr); 341 active listings in the ZIP; 6 comparable units currently listed for rent nearby; rentals lingering (median 46d on market — plan ~5-8 weeks vacancy on turnover, expect pricing pressure); 50% of comp listings sitting > 30 days — soft ceiling on asking rent; 1,678 units permitted in Mobile County in 2024 (264 in 5+ unit buildings).
- This rent runs 30% of the median local income ($61k/yr) — at the standard rent-burdened threshold; future hikes will face affordability resistance.
Forward outlook
- Local home prices are declining (-3.0%/yr); year-one equity from $1k of loan paydown is wiped out by about $5k of value loss. Plan a longer hold.
- Mobile County population projected to shrink 8% by 2050 — rents likely to lag national; underwrite the cash flow, not the appreciation.
Negotiation context
- It's been on market 218 days — a 12% lower offer ($150k) is reasonable based on typical stale-listing flexibility.
- 3 sale attempts since 4y ago; this cycle's ask has dropped $20k (10%) from the opening price — seller is motivated, your offer sets the floor, not the list.
- Current owner paid $131k; 30% above their basis — modest negotiation headroom, anchor on the comps not their cost.
Risks & watch-outs
- Climate carrying-cost: severe wind risk, 99% chance of damaging wind over 30y; major wildfire risk; extreme-heat days projected 7→20/yr by 2055 (HVAC capex compounding) — expect insurance premiums to compound above CPI over the hold.
Questions for the listing agent
- It's been on market 218 days. Have you received any prior offers? Is the seller open to a 12% concession, seller financing, or rate buy-down credit?
- Built in 1978 — when were the roof, HVAC, electrical panel, plumbing, and water heater last replaced?
- Why hasn't it sold? Are there any deal-killer items the seller is aware of (foundation, flood, title, zoning, code violations)?
- Is there a deadline driving the sale (1031 exchange, divorce, estate, relocation)? That informs how much negotiation room exists.
- Schools are D-rated, which usually means shorter tenancies and higher turnover. Who's the typical renter profile here, and what's been the actual vacancy rate?
- Crime grade is F in this area — have there been break-ins, vandalism, or insurance claims at this property in the last 3 years? What carrier currently insures it and at what premium?
- What's the average days-on-market for RENTAL listings here right now (not sales)? A rising rental-DOM trend means longer vacancies and softer asking-rent achievability than the comps imply.
- What's the recent tenant-quality profile in this submarket — average credit score on applications, eviction rate, late-payment / NSF rate, and stable-employment percentage? A property-management company in the area should have these aggregated.
- How much new for-sale + rental construction is in the pipeline within 1–3 miles? Heavy new supply typically softens prices + rents 12–24 months out; constrained supply supports both.
Investment metrics
- 1% rule
- 0.91% ✗
- Cap rate
- 7.66%
- Cash-on-cash
- 4.89%
- DSCR
- 1.22
- GRM
- 9.1
CMA / ARV
- ARV (on-the-fly)
- $208,926
- Comps found
- 12
Show comp detail 12 sales within ~0.75 mi
| Address | Dist | Beds/Ba | Sqft | Sold | Price | $/sf | Match |
|---|---|---|---|---|---|---|---|
| 395 Norton Rd | 0.00mi | 3/2.0 | 1,431 (0%) | 1mo | $170,000 | $119 | 100 |
| 750 Hale Rd | 0.50mi | 3/2.0 | 1,438 (+0%) | 2mo | $200,000 | $139 | 74 |
| 789 Royal Woods Dr W | 0.57mi | 3/2.0 | 1,398 (-2%) | 6mo | $223,000 | $160 | 65 |
| 835 Royal Woods Dr E | 0.65mi | 3/2.0 | 1,386 (-3%) | 2mo | $215,000 | $155 | 63 |
| 9475 Ironwood Ct | 0.62mi | 3/2.0 | 1,403 (-2%) | 7mo | $205,000 | $146 | 62 |
| 811 Royal Woods Dr W | 0.59mi | 3/2.0 | 1,392 (-3%) | 8mo | $190,000 | $136 | 61 |
| 735 Copperfield Dr E | 0.56mi | 3/2.0 | 1,387 (-3%) | 10mo | $235,000 | $169 | 60 |
| 9841 Shadow Wood Dr | 0.59mi | 4/3.0 (+1) | 1,472 (+3%) | 1mo | $214,975 | $146 | 58 |
| 801 Copperfield Dr E | 0.63mi | 3/2.0 | 1,531 (+7%) | 2mo | $220,000 | $144 | 58 |
| 781 W Copperfield Dr | 0.57mi | 3/2.0 | 1,567 (+10%) | 6mo | $197,500 | $126 | 53 |
| 9730 Trailwood Dr | 0.70mi | 3/2.0 | 1,535 (+7%) | 12mo | $125,000 | $81 | 45 |
| 740 Trailwood Dr E | 0.58mi | 3/2.0 | 1,224 (-14%) | 15mo | $220,000 | $180 | 36 |
Match score weights: distance 35% · size 25% · config 20% · recency 20%. Top-matched comps best support the ARV.
Projected returns pro-forma
-3.0% appreciation · 6.15% rent growth · sell at horizon
- IRR
- -5.6%
- Equity multiple
- 0.79×
- Total profit
- $-10,180
- Equity at exit
- $25,348
- IRR
- 7.2%
- Equity multiple
- 1.61×
- Total profit
- $28,994
- Equity at exit
- $14,698
Cash invested: $47,600 (down + closing). Projections, not guarantees.
Landlord ↔ Tenant lean methodology
- Overall (STATE)
- 90 Strongly Landlord-Friendly
- State Alabama
- 90 Strongly Landlord-Friendly · R+15
- County
- — inherits STATE
- City
- — inherits STATE
ZIP-level market 36608
- Rents YoY
- 6.2%
- Active inventory
- 341
- Price-to-rent
- 9.1×
Monthly cashflow live
- Estimated rent
- $1,551 high interval (Pro) →
- Mortgage (P&I)
- −$891
- Tax from tax record
- −$69 /mo · $831/yr
- Insurance
- −$71
- HOA
- −$0
- Vacancy / Maint / Mgmt
- −$326
- Net cashflow
- $194
Break-even live
Sensitivity live
| Price | -10% $290 | -5% $242 | +0% $194 | +5% $146 | +10% $98 |
|---|---|---|---|---|---|
| Rent | -10% $71 | -5% $133 | +0% $194 | +5% $255 | +10% $317 |
| Rate | -1.0pp $280 | -0.5pp $237 | base $194 | +0.5pp $150 | +1.0pp $105 |
UW: 25.0% down · 7.5% · 30yr · 1.5% tax · 5.0% vac · 8.0% maint · 8.0% mgmt
Financing live
Cash to close
- Down payment
- $42,500
- Closing costs
- $5,100
- Reserves months
- —
- Total cash needed
- —
Loan-product check · same deal, 3 products live
Conventional
25% down · 7.5% · 30yr
- Down + closing
- —
- Monthly P&I
- —
- Monthly cashflow
- —
- DSCR
- —
- Eligible?
- —
Personal DTI + credit; lowest rate.
DSCR
20% down · 8.5% · 30yr
- Down + closing
- —
- Monthly P&I
- —
- Monthly cashflow
- —
- DSCR
- —
- Eligible?
- —
No personal income docs; deal must DSCR.
Hard money
10% down · 12.0% · 12mo
- Down + closing
- —
- Monthly P&I
- —
- Monthly cashflow
- —
- DSCR
- —
- Eligible?
- —
Short-term bridge; refi at stabilization.
Rent comps 6 comps
| Address | Beds | Baths | Sqft | Rent | $/sqft | DOM | Units | Dist |
|---|---|---|---|---|---|---|---|---|
| 9760 Royal Woods Dr N Mobile, AL | 3.0 | 2.0 | 1127 | $1,395 | $1.24 | 45d | 1 | 0.54mi |
| 725 Copperfield Dr E Mobile, AL | 3.0 | 2.0 | 1454 | $1,500 | $1.03 | 15d | 1 | 0.55mi |
| 791 Copperfield Dr E Mobile, AL | 3.0 | 2.0 | 1256 | $1,495 | $1.19 | 45d | 1 | 0.62mi |
| 9650 Trailwood Dr S Mobile, AL | 3.0 | 2.0 | 1118 | $1,275 | $1.14 | 15d | 1 | 0.69mi |
| 9490 Cinder Dr Mobile, AL | 3.0 | 3.0 | 1783 | $1,800 | $1.01 | 15d | 1 | 0.74mi |
| 1345 Baker Ct Mobile, AL | 3.0 | 2.0 | 1252 | $1,500 | $1.20 | 45d | 1 | 1.43mi |
Listing history 11 events
-
2026-04-24status Pending
-
2026-04-03price $170,000
-
2026-04-03status Active
-
2026-03-29status Pending
-
2026-02-11price $179,900
-
2025-09-13$189,900 Active
-
2022-06-01soldstatus $131,000
-
2022-05-23soldstatus $131,000 Closed 386-char remark
Show marketing remark (393 chars)
This Brick home is tucked away in the Tosh Acres neighborhood off of Snow Road. It has a partially fenced back yard, double paned windows and a metal roof. The bathrooms have been renovated! Looking for a traditional brick ranch to fix up? This is the house for you! This one has a formal living/dining room and family room! Part of an estate - must have probate approval - SOLD AS IS!!
-
2022-05-23soldstatus $131,000 393-char remark
Show marketing remark (393 chars)
This Brick home is tucked away in the Tosh Acres neighborhood off of Snow Road. It has a partially fenced back yard, double paned windows and a metal roof. The bathrooms have been renovated! Looking for a traditional brick ranch to fix up? This is the house for you! This one has a formal living/dining room and family room! Part of an estate - must have probate approval - SOLD AS IS!!
-
2022-03-02status Pending 386-char remark
Show marketing remark (386 chars)
This Brick home is tucked away in the Tosh Acres neighborhood off of Snow Road. It has a partially fenced back yard, double paned windows and a metal roof. The bathrooms have been renovated! Looking for a traditional brick ranch to fix up? This is the house for you! This one has a formal living/dining room and family room! Part of an estate - must have probate approval - SOLD AS IS!!
-
2022-02-16$140,000 Active 386-char remark
Show marketing remark (386 chars)
This Brick home is tucked away in the Tosh Acres neighborhood off of Snow Road. It has a partially fenced back yard, double paned windows and a metal roof. The bathrooms have been renovated! Looking for a traditional brick ranch to fix up? This is the house for you! This one has a formal living/dining room and family room! Part of an estate - must have probate approval - SOLD AS IS!!
ⓘ Source: listings_history table (triggers on properties + properties_extension) + one-shot
backfill from property_details.listing_events for pre-trigger history.
Tax reassessment forecast AL · Resets to sale price
- Current annual tax
- $831 · $69/mo
- Projected year-2 tax
- $831 · $69/mo
- Expected delta
- $0/yr ($0/mo · 0.0%)
ⓘ Screening estimate from a state-policy table — verify with the county assessor before closing.
Climate risk First Street
- Flood 1/10 Low FEMA zone X (unshaded) · 0% chance over 30 yrs
- Wildfire 6/10 Major
- Heat 9/10 Extreme 7 d/yr ≥105°F today · 20 d/yr by 30 yrs out
- Wind 9/10 Extreme 99% chance of damaging wind over 30 yrs
- Air quality 1/10 Low 0 unhealthy d/yr today · 0 by 30 yrs out
Nearby sold comps map
Loading sold comps map…
Walkable amenities ~0.75 mi
Loading nearby amenities…
Taxation est. · year 1
- Rental income
- $18,618
- − Mortgage interest
- −$9,523
- − Property taxes
- −$831
- − Insurance
- −$850
- − Repairs & maintenance
- −$1,489
- − Management
- −$1,489
- − Depreciation
- −$4,945
- Taxable loss
- −$511
- Est. tax savings @ 24.0%
- +$123
- After-tax cash flow
- $2,451/yr
For passive investors: Depreciation is non-cash, so a rental often shows a tax loss while cash-flowing — sheltering income. Rental losses are passive: they offset passive income freely, and up to $25,000/yr can offset ordinary (W-2) income if you actively participate and your MAGI is under $100k (phasing out to $0 by $150k); unused losses carry forward. On sale, claimed depreciation is recaptured at up to 25%, and gains may owe capital-gains tax (a 1031 exchange can defer both). Figures are a year-1 estimate at your 24.0% rate — not tax advice; consult a CPA.
Schools (NCES district)
- District
- Mobile County
- NCES district ID
- 0102370
- Math proficiency
- 15% ▼ -28.00%
- Reading proficiency
- 39% ▬ 0.00%
- Median HH income
- $42,455
- Composite
- 22.9/100
- National rank
- #8002
- State rank
- #81 of 129 in AL
Livability — Mobile
- Score
- 75/100
- State rank
- #20
- US rank
- #4262
Category grades
Schools grade is shown separately in the Schools card above.
Census & demographics
- County
- Mobile County · 246,577 people
- City population
- 205,729
- Metro
- Mobile, AL
- Population (ZIP)
- 38,890
- Household income
- $61,146
- Rent vs Own
- Severe rent burden
- 1823.0
Population outlook (Mobile County) Hauer SSP2
- Today (2025)
- 415,303 people
- By 2030
- 411,755 · -0.9%
- By 2040
- 399,670 · -3.8%
- By 2050
- 382,616 · -7.9%
- By 2075
- 337,353 · -18.8%
- By 2100
- 283,391 · -31.8%
Race, ethnicity, and origin ACS 2023
- Neighborhood character
- Diverse neighborhood (Simpson 0.56)
- Race & ethnicity
- White 56% Black 35% Two or more races 4% Hispanic / Latino 4% Asian 2%
- Common ancestry
- Lithuanian 3% Italian 2% Slovak 2%
- Foreign-born
- 4% · Canada
- Languages at home
- 95% English-only · Spanish 2% Arabic 1% Other Indo-European 1%
Political lean MEDSL · Mobile
- 2024 margin
- R (+16.4) · D 41.3% · R 57.7%
- 2008→2024 swing
- -7.7pp toward R · 2008: -8.7pp · 2024: -16.4pp
- All cycles
- 2024: R+16.4 2020: R+11.9 2016: R+13.9 2012: R+9.3 2008: R+8.7
Not yet ingested
- Civics
- —
Market trends
- HPI YoY
- ▼ -224.52%
- Current HPI
- 198.9469
- Rent YoY
- ▲ 6.15%
- Metro
- Mobile, AL
- State GDP YoY
- ▲ 2.94%
- F500 in state
- 4
Industry mix (Fortune 500 HQ in AL)
| Industry | F500 HQs | Revenue |
|---|---|---|
| Financial Services | 1 | $8B |
|
||
| Healthcare | 1 | $5B |
|
||
Price history
+21.4% since first listed11 events — show timeline
- 2026-04-24 Pending — GCMLS AL
- 2026-04-03 Price Changed $170,000 GCMLS AL
- 2026-04-03 Relisted — GCMLS AL
- 2026-03-29 Pending — GCMLS AL
- 2026-02-11 Price Changed $179,900 GCMLS AL
- 2025-09-13 Listed $189,900 GCMLS AL
- 2022-06-01 Sold (Public Records) $131,000 Public Records
- 2022-05-23 Sold (MLS) $131,000 GCMLS AL
- 2022-05-23 Sold (MLS) $131,000 BCAR
- 2022-03-02 Pending — BCAR
- 2022-02-16 Listed $140,000 BCAR
Property tax history
+12.7%/yrLatest (2025): $831 · +5.9% YoY. Source: county tax records.
Cash-flow waterfall
monthlySold comps — $/sqft
last 12 mo · ≤1 miLoading sold comps…