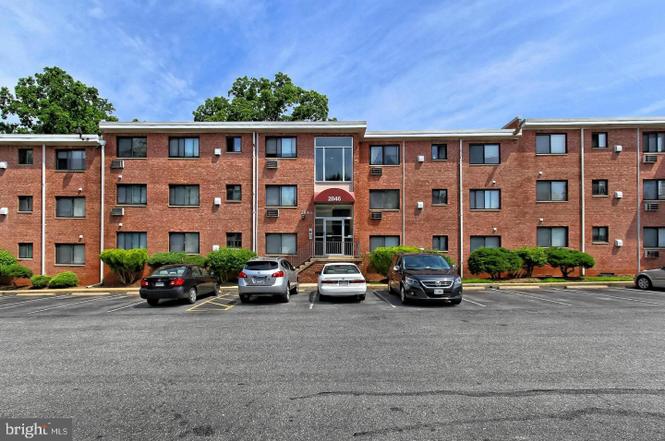
2846 Annandale Rd #220 · West Falls Church, VA
Flood risk 1/10 · Minimal
- FEMA flood zone
- X (unshaded)
- Chance of flooding over 30 yrs
- 0.0%
- Est. flood insurance / yr
- $507 – $1,088
Fire risk 1/10 · Minimal
- Est. fire insurance / yr
- $666 – $1,236
Heat risk 7/10 · Major
- Hot days now (above 104°F)
- 7 days/yr
- Hot days in 30 yrs
- 16 days/yr
Wind risk 4/10 · Minor
- Chance of severe wind over 30 yrs
- 15.0%
Air-quality risk 3/10 · Minor
- Unhealthy air days now
- 3 days/yr
- Unhealthy air days in 30 yrs
- 4 days/yr
Risk factors via First Street. Map © Google.
Why this score? — see what drove the D+ grade
The composite is a weighted blend of 9 inputs, each scored 0–100. Each bar is that input's sub-score; the figure is the points it added to the 100-point composite (weight × sub-score).
- Cash flow +15.9/30.0
- ARV discount +7.5/15.0
- Schools +6.3/10.0
- 1% rule +5.9/10.0
- DSCR +4.9/10.0
- Livability +4.1/5.0
- Rent growth +2.8/5.0
- Condition / age +2.5/5.0
- Appreciation +0.0/10.0
$249,900
🖨 Deal sheet 📄 Offer letter ✓ Due diligence
Listing remarks MLS
Great updated unit! 2 bedrooms, 1 bath, All utilities included in condo fee, $357/mo. Upper level unit and freshly painted ready for move-in. Close to 495, Falls Church Farmers Market and shopping! Huge storage unit in Laundry Room area assigned to this unit. Don't forget to visit the pool on the backside of the building! Just in time for Summer!
Key facts
- Huge storage unit
- $428 HOA
- Community pool
Tags
Property features AI
Finance
- HOA & community: Monthly condo fee of $428; HOA covers electricity, exterior building maintenance, gas, heat, management, sewer, snow removal, and water; Community amenities include an outdoor pool
Exterior
- Parking: Parking lot
- Utilities: Public water; Public sewer; Electric cooling fuel; Other heating fuel; Other hot water source
- Home design: Condominium unit (Unit/Flat); Garden-style building (1–4 floors); Entry on the 2nd floor
- Construction: Brick construction
- Exterior features: Community outdoor pool; Above-grade and below-grade structures noted
Interior
- Bedrooms: Two bedrooms on the main level
- Bathrooms: One full bathroom on the main level
- Heating & cooling: Central heating; Window air conditioning units (electric)
- Interior features: No basement; Living area reported by assessor
- Laundry & utility: No in-unit washer/dryer hookup
Neighborhood map
What this means for you Summary
Snapshot
- This is a 2-bed/1.0-bath condo listed at $250k.
Deal economics
- At list price, monthly cash flow is $117 ($1k/yr) — positive.
- The deal already cash-flows at list — no discount required.
- Meets the 1% rule at list price ($3k rent vs $250k).
- Cap rate 6.9% vs local median 2.3% in West Falls Church — top-decile yield for the area; either an underpriced asset or a hidden risk that comps aren't pricing in. Stress-test before assuming the spread holds.
Location & tenants
- Location reads 82/100 on livability (#47 in VA, #1,141 nationally) — a professional / high-income tenant draw. Strengths: crime A+, commute A+, employment A+; Watch: schools C-, cost of living F.
- Fairfax County Public School District (suburban): math 61% / reading 73% proficiency, ranked #13 of 131 in VA (top 10%) — acceptable for families but not a draw, mixed tenant base, ~2y average lease.
- Market conditions: Rents rising (+1.1%/yr); 112 active listings in the ZIP; 19 comparable units currently listed for rent nearby; rentals leasing fast (median 2d on market — plan ~1-2 weeks tenant-placement turnaround); high-income renter base; 2,861 units permitted in Fairfax County in 2024 (1,829 in 5+ unit buildings).
Forward outlook
- Local home prices are declining (-3.0%/yr); year-one equity from $2k of loan paydown is wiped out by about $7k of value loss. Plan a longer hold.
- Fairfax County population projected at +13% by 2050 — modest demand growth; plan on rents tracking national, not racing it.
Negotiation context
- Only 8 days on market — expect competitive offers; lowballing is unlikely to land.
- 10 sale attempts since 30y ago with the ask held roughly flat each time — persistent listings suggest the price (not the market) is what's stuck; bring a comps-based counter.
- Current owner paid $153k; list at $250k implies a 63% gain — meaningful room to come down on a strong offer.
Risks & watch-outs
- Climate carrying-cost: extreme-heat days projected 7→16/yr by 2055 (HVAC capex compounding) — expect insurance premiums to compound above CPI over the hold.
Questions for the listing agent
- Built in 1966 — when were the roof, HVAC, electrical panel, plumbing, and water heater last replaced?
- What does the HOA fee cover, when was the last increase, and are there any pending special assessments or reserve-fund shortfalls?
- Any open or pending special assessments — roof, HVAC, plumbing, elevator, façade? What's the per-unit balance and payoff schedule, and is the seller paying it off at close or rolling it to the buyer?
- Is there a deadline driving the sale (1031 exchange, divorce, estate, relocation)? That informs how much negotiation room exists.
- The area grade is low — what's the realistic commute time and amenity access for the typical tenant pool here? Any planned neighborhood developments (good or bad) we should know about?
- What's the average days-on-market for RENTAL listings here right now (not sales)? A rising rental-DOM trend means longer vacancies and softer asking-rent achievability than the comps imply.
- What's the recent tenant-quality profile in this submarket — average credit score on applications, eviction rate, late-payment / NSF rate, and stable-employment percentage? A property-management company in the area should have these aggregated.
- How much new apartment / multifamily construction is in the pipeline within 1–3 miles? Heavy new supply (>2% of stock underway) typically softens rents 12–24 months out; light construction supports rent growth.
Investment metrics
- 1% rule
- 1.09% ✓
- Cap rate
- 6.85%
- Cash-on-cash
- 2.01%
- DSCR
- 1.09
- GRM
- 7.6
CMA / ARV
No comps found within radius.
Projected returns pro-forma
-3.0% appreciation · 1.12% rent growth · sell at horizon
- IRR
- -15.5%
- Equity multiple
- 0.46×
- Total profit
- $-37,870
- Equity at exit
- $37,261
- IRR
- -11.1%
- Equity multiple
- 0.39×
- Total profit
- $-42,425
- Equity at exit
- $21,607
Cash invested: $69,972 (down + closing). Projections, not guarantees.
Landlord ↔ Tenant lean methodology
- Overall (STATE)
- 55 Moderately Landlord-Leaning
- State Virginia
- 55 Moderately Landlord-Leaning · D+2
- County
- — inherits STATE
- City
- — inherits STATE
ZIP-level market 22042
- Rents YoY
- 1.1%
- Active inventory
- 112
- Price-to-rent
- 7.6×
Monthly cashflow live
- Estimated rent
- $2,722 high interval (Pro) →
- Mortgage (P&I)
- −$1,311
- Tax from tax record
- −$191 /mo · $2,292/yr
- Insurance
- −$104
- HOA
- −$428
- Vacancy / Maint / Mgmt
- −$572
- Net cashflow
- $117
Break-even live
UW: 25.0% down · 7.5% · 30yr · 1.5% tax · 5.0% vac · 8.0% maint · 8.0% mgmt
Financing live
Cash to close
- Down payment
- $62,475
- Closing costs
- $7,497
- Reserves months
- —
- Total cash needed
- —
Loan-product check · same deal, 3 products live
Conventional
25% down · 7.5% · 30yr
- Down + closing
- —
- Monthly P&I
- —
- Monthly cashflow
- —
- DSCR
- —
- Eligible?
- —
Personal DTI + credit; lowest rate.
DSCR
20% down · 8.5% · 30yr
- Down + closing
- —
- Monthly P&I
- —
- Monthly cashflow
- —
- DSCR
- —
- Eligible?
- —
No personal income docs; deal must DSCR.
Hard money
10% down · 12.0% · 12mo
- Down + closing
- —
- Monthly P&I
- —
- Monthly cashflow
- —
- DSCR
- —
- Eligible?
- —
Short-term bridge; refi at stabilization.
Rent comps 19 comps
| Address | Beds | Baths | Sqft | Rent | $/sqft | DOM | Units | Dist |
|---|---|---|---|---|---|---|---|---|
| 6600 Colton Crawford Cir Falls Church, VA | 1.0–3.0 | 1.0–2.5 | 1272 | $3,738 | $2.94 | 1d | 1 | 0.34mi |
| 210 E Fairfax St Falls Church, VA | 3.0 | 1.0–2.0 | 945 | $2,285 | $2.42 | 1d | 8 | 0.44mi |
| 111 E Broad St Falls Church, VA | 2.0 | 1.0–2.0 | 804 | $3,933 | $4.89 | 1d | 27 | 0.55mi |
| 301 W Broad St Falls Church, VA | 1.0 | 1.0 | 730 | $2,780 | $3.81 | 1d | 18 | 0.63mi |
| 6410 Arlington Blvd Falls Church, VA | 1.0–2.0 | 1.0–2.0 | 962 | $3,218 | $3.34 | 1d | 10 | 0.77mi |
| 450 N Washington St Falls Church, VA | 1.0–2.0 | 1.0–2.0 | 826 | $3,169 | $3.84 | 1d | 13 | 0.88mi |
| 809 W Broad St Falls Church, VA | 1.0 | 1.5 | 1075 | $2,000 | $1.86 | 3d | 10 | 0.96mi |
| 2827 Kalmia Lee Ct Falls Church, VA | 1.0 | 1.0 | 707 | $1,900 | $2.69 | 2d | 1 | 1.05mi |
| 2825 Kalmia Lee Ct #301 Falls Church, VA | 1.0 | 1.0 | 707 | $2,000 | $2.83 | 14d | 1 | 1.05mi |
| 501 Roosevelt Blvd Falls Church, VA | 2.0 | 1.0–2.0 | 823 | $2,995 | $3.64 | 2d | 33 | 1.13mi |
| 110 Founders Ave Falls Church, VA | 2.0 | 1.0–2.0 | 941 | $3,906 | $4.15 | 1d | 27 | 1.18mi |
| 500 Roosevelt Blvd Falls Church, VA | 3.0 | 1.0–1.5 | 955 | $2,597 | $2.72 | 1d | 17 | 1.20mi |
| 1033 W Broad St Falls Church, VA | 2.0 | 1.0–2.0 | 910 | $4,232 | $4.65 | 1d | 19 | 1.26mi |
| 2910 Willston Pl Apt 202 Falls Church, VA | 2.0 | 1.0 | 718 | $2,000 | $2.79 | 4d | 1 | 1.27mi |
| 2809 W Glen Dr Falls Church, VA | 2.0 | 1.0 | 627 | $2,150 | $3.43 | 7d | 7 | 1.27mi |
| 2919 Willston Pl #101 Falls Church, VA | 1.0 | 1.0 | 578 | $1,700 | $2.94 | 43d | 1 | 1.31mi |
| 2916 Peyton Randolph Dr Falls Church, VA | 1.0 | 1.0 | 578 | $1,650 | $2.85 | 43d | 1 | 1.33mi |
| 6200 Wilson Blvd Falls Church, VA | 3.0 | 1.0–2.0 | 912 | $2,892 | $3.17 | 1d | 19 | 1.43mi |
| 7481 Lee Hwy Falls Church, VA | 1.0–2.0 | 1.0 | 775 | $1,895 | $2.45 | 24d | 1 | 1.49mi |
HOA detail condo
- Monthly dues
- $428 · $5,136/yr
- Likely covers
- pool
- Assessments
- None detected in remarks — confirm with the listing agent.
Listing history 7 events
-
2026-06-18days on market $249,900 Active 8 DOM
-
2026-06-17days on market $249,900 Active 7 DOM
-
2026-06-16days on market $249,900 Active 6 DOM
-
2026-06-15days on market $249,900 Active 5 DOM
-
2026-06-13days on market $249,900 Active 3 DOM
-
2026-06-13remarks 699-char remark
-
2026-06-13$249,900 Active 2 DOM
ⓘ Source: listings_history table (triggers on properties + properties_extension) + one-shot
backfill from property_details.listing_events for pre-trigger history.
Tax reassessment forecast VA · Resets to sale price
- Current annual tax
- $2,292 · $191/mo
- Projected year-2 tax
- $2,292 · $191/mo
- Expected delta
- $0/yr ($0/mo · 0.0%)
ⓘ Screening estimate from a state-policy table — verify with the county assessor before closing.
Climate risk First Street
- Flood 1/10 Low FEMA zone X (unshaded) · 0% chance over 30 yrs
- Wildfire 1/10 Low
- Heat 7/10 Severe 7 d/yr ≥104°F today · 16 d/yr by 30 yrs out
- Wind 4/10 Moderate 15% chance of damaging wind over 30 yrs
- Air quality 3/10 Moderate 3 unhealthy d/yr today · 4 by 30 yrs out
Nearby sold comps map
Loading sold comps map…
Walkable amenities ~0.75 mi
Loading nearby amenities…
Taxation est. · year 1
- Rental income
- $32,668
- − Mortgage interest
- −$13,998
- − Property taxes
- −$2,292
- − Insurance
- −$1,250
- − Repairs & maintenance
- −$2,613
- − Management
- −$2,613
- − HOA
- −$5,136
- − Depreciation
- −$7,270
- Taxable loss
- −$2,505
- Est. tax savings @ 24.0%
- +$601
- After-tax cash flow
- $2,005/yr
For passive investors: Depreciation is non-cash, so a rental often shows a tax loss while cash-flowing — sheltering income. Rental losses are passive: they offset passive income freely, and up to $25,000/yr can offset ordinary (W-2) income if you actively participate and your MAGI is under $100k (phasing out to $0 by $150k); unused losses carry forward. On sale, claimed depreciation is recaptured at up to 25%, and gains may owe capital-gains tax (a 1031 exchange can defer both). Figures are a year-1 estimate at your 24.0% rate — not tax advice; consult a CPA.
Schools (NCES district)
- District
- Fairfax County Public School District
- NCES district ID
- 5101260
- Math proficiency
- 61% ▼ -24.00%
- Reading proficiency
- 73% ▼ -8.00%
- Median HH income
- $110,238
- Composite
- 62.59/100
- National rank
- #679
- State rank
- #13 of 131 in VA
Livability — West Falls Church
- Score
- 82/100
- State rank
- #47
- US rank
- #1141
Category grades
Schools grade is shown separately in the Schools card above.
Census & demographics
- Census place
- West Falls Church, VA
- County
- Fairfax County · 1,104,456 people
- City population
- 34,631
- Metro
- Washington-Arlington-Alexandria, DC-VA-MD-WV
- Population (ZIP)
- 35,483
- Household income
- $138,255
- Rent vs Own
- Severe rent burden
- 857.0
Population outlook (Fairfax County) Hauer SSP2
- Today (2025)
- 1,237,259 people
- By 2030
- 1,277,758 · +3.3%
- By 2040
- 1,346,508 · +8.8%
- By 2050
- 1,397,919 · +13.0%
- By 2075
- 1,493,100 · +20.7%
- By 2100
- 1,465,712 · +18.5%
Race, ethnicity, and origin ACS 2023
- Neighborhood character
- Diverse neighborhood (Simpson 0.69)
- Race & ethnicity
- White 40% Hispanic / Latino 33% Asian 18% Two or more races 12% Black 5%
- Hispanic origin (detail)
- Mexican 2%
- Common ancestry
- Romanian 2% Slovak 2% Italian 2%
- Foreign-born
- 37% · Canada, Vietnam, China
- Languages at home
- 50% English-only · Spanish 30% Vietnamese 8% Other Indo-European 4%
Political lean MEDSL · Fairfax
- 2024 margin
- Solid D (+35.0) · D 66.1% · R 31.1% · Other 2.8%
- 2008→2024 swing
- +13.8pp toward D · 2008: 21.2pp · 2024: 35.0pp
- All cycles
- 2024: D+35.0 2020: D+41.9 2016: D+36.2 2012: D+19.8 2008: D+21.2
Not yet ingested
- Civics
- —
Market trends
- HPI YoY
- ▼ -488.58%
- Current HPI
- 349.9051
- Rent YoY
- ▲ 1.12%
- Metro
- Washington-Arlington-Alexandria, DC-VA-MD-WV
- State GDP YoY
- ▲ 2.40%
- F500 in state
- 50
Industry mix (Fortune 500 HQ in VA)
| Industry | F500 HQs | Revenue |
|---|---|---|
| Aerospace / Defense | 4 | $236B |
|
||
| Technology / Defense | 3 | $32B |
|
||
| Financial Services | 2 | $176B |
|
||
| Utilities | 2 | $27B |
|
||
| Insurance | 2 | $25B |
|
||
| Technology | 2 | $15B |
|
||
Price history
+843.0% since first listed34 events — show timeline
- 2026-06-10 Listed $249,900 BRIGHT MLS
- 2014-07-14 Delisted — MRIS
- 2014-07-14 Sold (Public Records) $153,000 Public Records
- 2014-07-14 Sold (MLS) $153,000 BRIGHT MLS
- 2014-07-14 Sold (MLS) $153,000 MRIS
- 2014-06-23 Pending — MRIS
- 2014-06-21 Listing Removed — BRIGHT MLS
- 2014-06-05 Listed $157,777 MRIS
- 2014-06-05 Listed $157,777 BRIGHT MLS
- 2014-05-15 Delisted — MRIS
- 2014-05-15 Sold (Public Records) $140,000 Public Records
- 2014-05-14 Sold (MLS) $140,000 BRIGHT MLS
- 2014-05-14 Sold (MLS) $140,000 MRIS
- 2014-02-23 Pending — MRIS
- 2014-02-21 Delisted — MRIS
- 2014-02-21 Listing Removed — BRIGHT MLS
- 2014-02-19 Price Changed $140,000 MRIS
- 2014-02-19 Relisted — MRIS
- 2014-01-02 Pending — MRIS
- 2013-12-15 Listed $165,000 MRIS
- 2013-12-14 Listed $140,000 BRIGHT MLS
- 2013-12-11 Delisted — MRIS
- 2013-12-10 Listing Removed — BRIGHT MLS
- 2013-11-26 Listed $199,000 BRIGHT MLS
- 2013-11-26 Price Changed — MRIS
- 2013-11-26 Listed — MRIS
- 1997-01-21 Sold (Public Records) $49,000 Public Records
- 1997-01-15 Sold (MLS) $49,000 MRIS
- 1996-12-15 Delisted — MRIS
- 1996-09-14 Delisted — MRIS
- 1996-09-08 Listed $50,950 MRIS
- 1996-08-05 Listed — MRIS
- 1987-04-01 Sold (Public Records) $40,000 Public Records
- 1979-10-11 Sold (Public Records) $26,500 Public Records
Property tax history
+1.9%/yrLatest (2025): $2,292 · +1.8% YoY. Source: county tax records.
Cash-flow waterfall
monthlySold comps — $/sqft
last 12 mo · ≤1 miLoading sold comps…