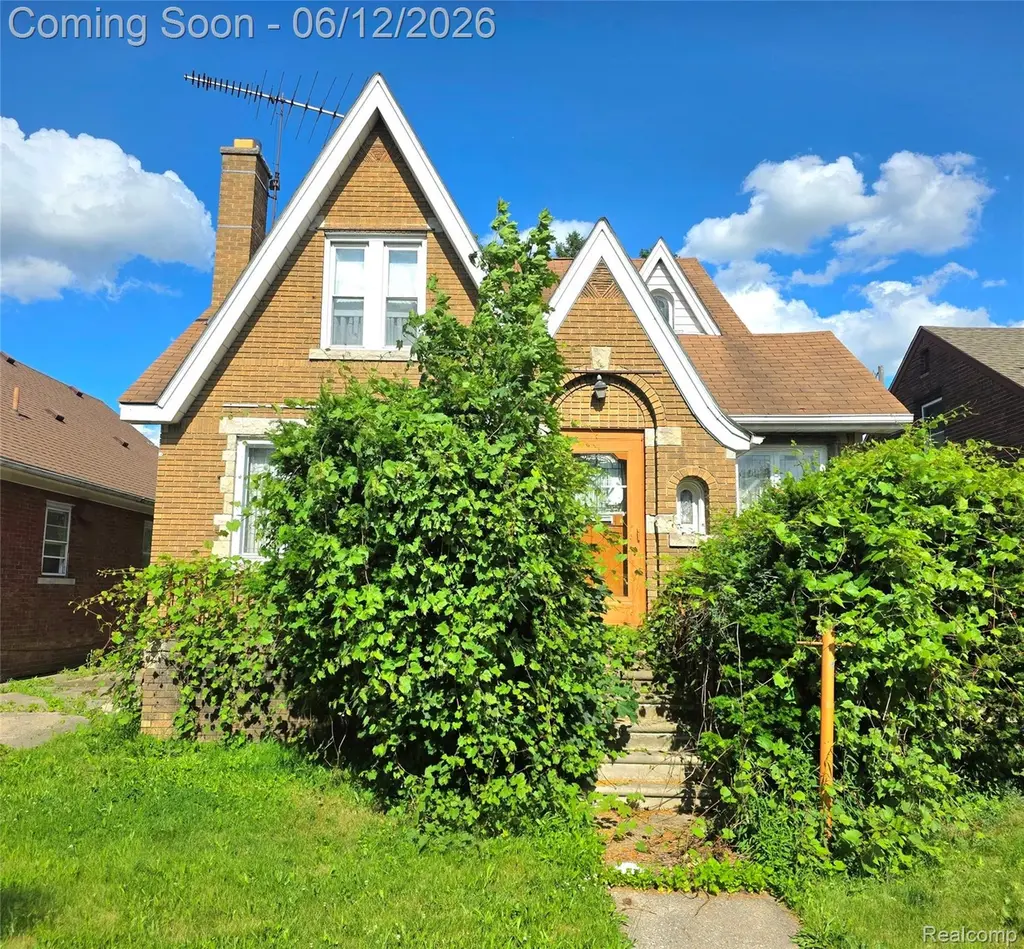
7836 Theisen St · Dearborn, MI
Flood risk 1/10 · Minimal
- FEMA flood zone
- X (unshaded)
- Chance of flooding over 30 yrs
- 0.0%
- Est. flood insurance / yr
- $473 – $860
Fire risk 1/10 · Minimal
- Est. fire insurance / yr
- $784 – $1,456
Heat risk 3/10 · Minor
- Hot days now (above 96°F)
- 7 days/yr
- Hot days in 30 yrs
- 15 days/yr
Wind risk 2/10 · Minimal
- Chance of severe wind over 30 yrs
- —
Air-quality risk 3/10 · Minor
- Unhealthy air days now
- 2 days/yr
- Unhealthy air days in 30 yrs
- 5 days/yr
Risk factors via First Street. Map © Google.
Why this score? — see what drove the D+ grade
The composite is a weighted blend of 9 inputs, each scored 0–100. Each bar is that input's sub-score; the figure is the points it added to the 100-point composite (weight × sub-score).
- ARV discount +12.6/15.0
- Cash flow +12.1/30.0
- 1% rule +6.9/10.0
- Rent growth +5.0/5.0
- Livability +4.0/5.0
- DSCR +3.6/10.0
- Schools +2.8/10.0
- Condition / age +2.5/5.0
- Appreciation +0.0/10.0
$149,900
🖨 Deal sheet (PDF) 📄 Offer letter ✓ Due diligence
Listing remarks MLS
* * MULTIPLE OFFERS RECEIVED - OFFER DEADLINE, WEDNESDAY JUNE 17TH @ 12PM * * This historic 4 bedroom, 2 full bathroom brick bungalow is located in Dearborn half of the renowned Aviation subdivision! The property needs a FULL REHAB, but some of its original charm like the hardwood floorinh throughout and the original tile bathrooms might be salvageable! The property has a spacious living room, bonus room, dining room, kitchen, breakfast nook, 1 full bath, and a bedroom on the 1st floor, while the 2nd floor has the other 3 bedrooms and the full bath! The basement was finished but will need a lot of work to restore; it does feature the half bath! This property offers a terrific opportunity for someone who wants to create a beautiful family home in the thriving Dearborn community OR for an investor looking for their next flip project! CASH OR HARD MONEY ONLY AND CASH IS STRONGLY PREFERRED - DO NOT CALL ME ASKING ABOUT SELLER FINANCING OR CONVENTIONAL. SOLD AS-IS. SALE IS SUBJECT TO COURT APPROVAL.
Key facts
- Hardwood flooring
- Bonus room
- Dining room
Tags
Property features AI
Finance
- Other: Property type: Residential, single family residence; Lot dimensions: 40 x 120 (0.11 acres)
- HOA & community: Neighborhood sidewalks
Exterior
- Parking: Detached garage with approximately 2.5 spaces
- Utilities: Public water; Public sewer; Cable available; Underground utilities
- Home design: Single family residence; One-and-one-half story; Ground-level entry with steps; Brick construction; Faces unspecified direction
- Construction: Brick exterior; Asphalt roof; Brick/mortar foundation; Built area above grade: 1,536 (square feet)
- Exterior features: Balcony; Front porch; Paved road access
Interior
- Kitchen: Includes gas water heater (no additional appliance details provided)
- Bedrooms: Total rooms: 7
- Bathrooms: 2 full bathrooms; 1 half bathroom
- Heating & cooling: Hot water heating with natural gas; No central cooling
- Interior features: Partially furnished; Gas water heater; Fireplace in the living room; Unfinished basement
- Laundry & utility: Basement utility area (basement unfinished)
Neighborhood map
What this means for you Summary
Snapshot
- This is a 4-bed/3.0-bath single-family listed at $150k.
Deal economics
- At list price, monthly cash flow is $-33 ($-396/yr) — negative.
- To cash-flow at today's rent, offer at most $144k (3.9% below list).
- Meets the 1% rule at list price ($2k rent vs $150k).
- Recommended offer: $144k (3.9% below list) — sets the bar for cash-flow.
- Cap rate 6.0% vs local median 4.3% in Dearborn — top-decile yield for the area; either an underpriced asset or a hidden risk that comps aren't pricing in. Stress-test before assuming the spread holds.
Location & tenants
- Location reads 80/100 on livability (#84 in MI, #1,904 nationally) — a professional / high-income tenant draw. Strengths: commute A+, cost of living A+, housing A+; Watch: amenities D.
- Dearborn City School District (urban): math 26% / reading 39% proficiency, ranked #325 of 540 in MI (top 60%) — families likely to look elsewhere, expect single-tenant / working-renter base with shorter leases; 66% free/reduced lunch — lower-income household profile, screen leases tightly.
- Zoned schools: Mcdonald Elementary School (math 22% / reading 17%, grade F, #1,110 of 1,397 statewide, top 81%, 335 students, 89% FRL); Unis Middle School (math 21% / reading 34%, grade F, #363 of 493 statewide, top 75%, 579 students, 87% FRL); Fordson High School (math 31% / reading 49%, grade F, #299 of 713 statewide, top 42%, 2,339 students, 85% FRL) — zoned schools average 87% FRL vs 66% district-wide (21 pts higher); higher-poverty schools than district average — tighter screening recommended.
- Market conditions: Rents rising fast (+13.2%/yr); 108 active listings in the ZIP; 8 comparable units currently listed for rent nearby; rentals lingering (median 46d on market — plan ~5-8 weeks vacancy on turnover, expect pricing pressure); 62% of comp listings sitting > 30 days — soft ceiling on asking rent; lower-income renter base — watch delinquency; 2,639 units permitted in Wayne County in 2024 (1,216 in 5+ unit buildings).
- At $1,785/mo this rent would consume 51% of the median local household income ($42k/yr) (locally 2742% of renters already pay >50% of income on rent) — very limited rent-growth headroom before tenants either downsize or default.
Forward outlook
- Local home prices are declining (-3.0%/yr); year-one equity from $1k of loan paydown is wiped out by about $4k of value loss. Plan a longer hold.
- Wayne County population projected at -17% by 2050 — secular population decline; favor cash flow + early exit over multi-decade hold.
Negotiation context
- Only 11 days on market — expect competitive offers; lowballing is unlikely to land.
- 2 sale attempts with the ask held roughly flat each time — persistent listings suggest the price (not the market) is what's stuck; bring a comps-based counter.
Risks & watch-outs
- Watch-outs: property tax is 4.8% of price; built in 1929 — expect roof / HVAC / electrical / plumbing capex.
Questions for the listing agent
- What do current leases actually rent for vs. the listed asking? Can we see a recent rent roll and the last 12 months of T-12 income?
- Built in 1929 — when were the roof, HVAC, electrical panel, plumbing, and water heater last replaced?
- Property tax is high relative to price — has the assessment been appealed recently, and will the sale trigger a re-assessment?
- Is there a deadline driving the sale (1031 exchange, divorce, estate, relocation)? That informs how much negotiation room exists.
- Schools are D-rated, which usually means shorter tenancies and higher turnover. Who's the typical renter profile here, and what's been the actual vacancy rate?
- The area grade is low — what's the realistic commute time and amenity access for the typical tenant pool here? Any planned neighborhood developments (good or bad) we should know about?
- What's the average days-on-market for RENTAL listings here right now (not sales)? A rising rental-DOM trend means longer vacancies and softer asking-rent achievability than the comps imply.
- What's the recent tenant-quality profile in this submarket — average credit score on applications, eviction rate, late-payment / NSF rate, and stable-employment percentage? A property-management company in the area should have these aggregated.
- How much new for-sale + rental construction is in the pipeline within 1–3 miles? Heavy new supply typically softens prices + rents 12–24 months out; constrained supply supports both.
Investment metrics
- 1% rule
- 1.19% ✓
- Cap rate
- 6.03%
- Cash-on-cash
- -0.94%
- DSCR
- 0.96
- GRM
- 7.0
CMA / ARV
- ARV (on-the-fly)
- $168,960
- Comps found
- 12
Show comp detail 12 sales within ~0.75 mi
| Address | Dist | Beds/Ba | Sqft | Sold | Price | $/sf | Match |
|---|---|---|---|---|---|---|---|
| 8205 Appoline St | 0.37mi | 3/1.5 (-1) | 1,580 (+3%) | 1mo | $105,000 | $66 | 66 |
| 8010 Normile St | 0.29mi | 3/2.0 (-1) | 1,600 (+4%) | 7mo | $219,999 | $137 | 65 |
| 7741 Miller Rd | 0.22mi | 4/2.0 | 1,389 (-10%) | 7mo | $280,000 | $202 | 64 |
| 5801 Oakman Blvd | 0.40mi | 4/1.5 | 1,451 (-6%) | 5mo | $160,000 | $110 | 62 |
| 8043 E Morrow Circle St E | 0.18mi | 3/2.0 (-1) | 1,398 (-9%) | 8mo | $155,000 | $111 | 61 |
| 10035 Blesser St | 0.62mi | 4/1.5 | 1,512 (-2%) | 7mo | $227,000 | $150 | 56 |
| 8860 Appoline St | 0.69mi | 5/1.5 (+1) | 1,561 (+2%) | 4mo | $61,272 | $39 | 51 |
| 8301 Northlawn St | 0.69mi | 3/2.5 (-1) | 1,636 (+6%) | 2mo | $115,000 | $70 | 48 |
| 8354 Wyoming Ave | 0.51mi | 3/1.0 (-1) | 1,620 (+6%) | 8mo | $125,000 | $77 | 48 |
| 8304 Pinehurst St | 0.36mi | 3/1.0 (-1) | 1,344 (-12%) | 9mo | $123,500 | $92 | 42 |
| 8607 Indiana St | 0.67mi | 3/1.5 (-1) | 1,457 (-5%) | 9mo | $100,000 | $69 | 42 |
| 8029 Hartwell St | 0.66mi | 3/1.5 (-1) | 1,389 (-10%) | 2mo | $165,000 | $119 | 41 |
Match score weights: distance 35% · size 25% · config 20% · recency 20%. Top-matched comps best support the ARV.
Projected returns pro-forma
-3.0% appreciation · 8.0% rent growth · sell at horizon
- IRR
- -10.2%
- Equity multiple
- 0.60×
- Total profit
- $-16,681
- Equity at exit
- $22,351
- IRR
- 6.6%
- Equity multiple
- 1.64×
- Total profit
- $26,832
- Equity at exit
- $12,961
Cash invested: $41,972 (down + closing). Projections, not guarantees.
Landlord ↔ Tenant lean methodology
- Overall (STATE)
- 62 Landlord-Friendly
- State Michigan
- 62 Landlord-Friendly · EVEN
- County
- — inherits STATE
- City
- — inherits STATE
ZIP-level market 48126
- Rents YoY
- 13.2%
- Active inventory
- 108
- Price-to-rent
- 7.0×
Monthly cashflow live
- Estimated rent
- $1,785 high interval (Pro) →
- Mortgage (P&I)
- −$786
- Tax from tax record
- −$595 /mo · $7,136/yr
- Insurance
- −$62
- HOA
- −$0
- Lot rent
- −$0
- Vacancy / Maint / Mgmt
- −$375
- Net cashflow
- $-33
Break-even live
Sensitivity live
| Price | -10% $478 | -5% $426 | +0% $-33 | +5% $-75 | +10% $-118 |
|---|---|---|---|---|---|
| Rent | -10% $-174 | -5% $-104 | +0% $-33 | +5% $38 | +10% $108 |
| Rate | -1.0pp $42 | -0.5pp $5 | base $-33 | +0.5pp $-72 | +1.0pp $-111 |
UW: 25.0% down · 7.5% · 30yr · 1.5% tax · 5.0% vac · 8.0% maint · 8.0% mgmt
Financing live
Cash to close
- Down payment
- $37,475
- Closing costs
- $4,497
- Reserves months
- —
- Total cash needed
- —
Loan-product check · same deal, 3 products live
Conventional
25% down · 7.5% · 30yr
- Down + closing
- —
- Monthly P&I
- —
- Monthly cashflow
- —
- DSCR
- —
- Eligible?
- —
Personal DTI + credit; lowest rate.
DSCR
20% down · 8.5% · 30yr
- Down + closing
- —
- Monthly P&I
- —
- Monthly cashflow
- —
- DSCR
- —
- Eligible?
- —
No personal income docs; deal must DSCR.
Hard money
10% down · 12.0% · 12mo
- Down + closing
- —
- Monthly P&I
- —
- Monthly cashflow
- —
- DSCR
- —
- Eligible?
- —
Short-term bridge; refi at stabilization.
Rent comps 8 comps
| Address | Beds | Baths | Sqft | Rent | $/sqft | DOM | Units | Dist |
|---|---|---|---|---|---|---|---|---|
| 8143 Wisconsin St Detroit, MI | 4.0 | 1.0 | 1370 | $1,800 | $1.31 | 0d | 1 | 0.56mi |
| 8230 Ohio St Detroit, MI | 3.0 | 1.0 | 1350 | $1,200 | $0.89 | 19d | 1 | 0.67mi |
| 8320 Northlawn St Detroit, MI | 3.0 | 1.0 | 1737 | $1,550 | $0.89 | 22d | 1 | 0.76mi |
| 9209 Pinehurst St Detroit, MI | 3.0 | 1.0 | 1589 | $1,500 | $0.94 | 46d | 1 | 0.88mi |
| 9355 Ward St Detroit, MI | 3.0 | 1.0 | 1200 | $1,327 | $1.11 | 46d | 1 | 1.11mi |
| 7424 Wykes St Detroit, MI | 3.0 | 1.0 | 1200 | $1,100 | $0.92 | 46d | 1 | 1.16mi |
| 10002 Manor Unit 2 Detroit, MI | 3.0 | 1.0 | 1100 | $1,150 | $1.05 | 46d | 1 | 1.41mi |
| 8047 Robson St Detroit, MI | 3.0 | 2.0 | 1184 | $1,200 | $1.01 | 46d | 1 | 1.42mi |
Listing history 8 events
-
2026-06-22days on market $149,900 Active 11 DOM
-
2026-06-21days on market $149,900 Active 10 DOM
-
2026-06-18days on market $149,900 Active 7 DOM
-
2026-06-17days on market $149,900 Active 6 DOM
-
2026-06-16days on market $149,900 Active 5 DOM
-
2026-06-15days on market $149,900 Active 4 DOM
-
2026-06-13remarks 699-char remark
-
2026-06-13$149,900 Active 2 DOM
ⓘ Source: listings_history table (triggers on properties + properties_extension) + one-shot
backfill from property_details.listing_events for pre-trigger history.
Tax reassessment forecast MI · Partial reset (capped growth)
- Current annual tax
- $7,136 · $595/mo
- Projected year-2 tax
- $7,136 · $595/mo
- Expected delta
- $0/yr ($0/mo · 0.0%)
ⓘ Screening estimate from a state-policy table — verify with the county assessor before closing.
Climate risk First Street
- Flood 1/10 Low FEMA zone X (unshaded) · 0% chance over 30 yrs
- Wildfire 1/10 Low
- Heat 3/10 Moderate 7 d/yr ≥96°F today · 15 d/yr by 30 yrs out
- Wind 2/10 Low
- Air quality 3/10 Moderate 2 unhealthy d/yr today · 5 by 30 yrs out
Nearby sold comps map
Loading sold comps map…
Walkable amenities ~0.75 mi
Loading nearby amenities…
Taxation est. · year 1
- Rental income
- $21,421
- − Mortgage interest
- −$8,397
- − Property taxes
- −$7,136
- − Insurance
- −$750
- − Repairs & maintenance
- −$1,714
- − Management
- −$1,714
- − Depreciation
- −$4,361
- Taxable loss
- −$2,649
- Est. tax savings @ 24.0%
- +$636
- After-tax cash flow
- $240/yr
For passive investors: Depreciation is non-cash, so a rental often shows a tax loss while cash-flowing — sheltering income. Rental losses are passive: they offset passive income freely, and up to $25,000/yr can offset ordinary (W-2) income if you actively participate and your MAGI is under $100k (phasing out to $0 by $150k); unused losses carry forward. On sale, claimed depreciation is recaptured at up to 25%, and gains may owe capital-gains tax (a 1031 exchange can defer both). Figures are a year-1 estimate at your 24.0% rate — not tax advice; consult a CPA.
Schools (NCES district)
- District
- Dearborn City School District
- NCES district ID
- 2611600
- Math proficiency
- 26% ▼ -14.00%
- Reading proficiency
- 39% ▼ -8.00%
- Median HH income
- $46,884
- Composite
- 27.93/100
- National rank
- #6864
- State rank
- #325 of 540 in MI
Livability — Dearborn
- Score
- 80/100
- State rank
- #84
- US rank
- #1904
Category grades
Schools grade is shown separately in the Schools card above.
Census & demographics
- Census place
- Dearborn, MI
- County
- Wayne County · 1,562,939 people
- City population
- 86,476
- Metro
- Detroit-Warren-Dearborn, MI
- Population (ZIP)
- 51,997
- Household income
- $42,140
- Rent vs Own
- Severe rent burden
- 2742.0
Population outlook (Wayne County) Hauer SSP2
- Today (2025)
- 1,675,273 people
- By 2030
- 1,620,300 · -3.3%
- By 2040
- 1,502,341 · -10.3%
- By 2050
- 1,384,039 · -17.4%
- By 2075
- 1,124,592 · -32.9%
- By 2100
- 881,193 · -47.4%
Race, ethnicity, and origin ACS 2023
- Neighborhood character
- Predominantly White (90%)
- Race & ethnicity
- White 90% Two or more races 4% Black 3% Asian 2% Hispanic / Latino 1%
- Common ancestry
- Arab 8% Romanian 2% Armenian 1%
- Foreign-born
- 43% · Canada, South Korea
- Languages at home
- 26% English-only · Arabic 70% Other Indo-European 2% Spanish 1%
Political lean MEDSL · Wayne
- 2024 margin
- Strong D (+29.0) · D 62.7% · R 33.7% · Other 3.6%
- 2008→2024 swing
- -20.5pp toward R · 2008: 49.5pp · 2024: 29.0pp
- All cycles
- 2024: D+29.0 2020: D+38.1 2016: D+37.3 2012: D+46.9 2008: D+49.5
Not yet ingested
- Civics
- —
Market trends
- HPI YoY
- ▼ -266.09%
- Current HPI
- 241.0732
- Rent YoY
- ▲ 13.15%
- Metro
- Detroit-Warren-Dearborn, MI
- State GDP YoY
- ▲ 1.37%
- F500 in state
- 28
Industry mix (Fortune 500 HQ in MI)
| Industry | F500 HQs | Revenue |
|---|---|---|
| Automotive Parts | 3 | $48B |
|
||
| Automotive | 2 | $372B |
|
||
| Chemicals | 1 | $45B |
|
||
| Automotive Retail | 1 | $29B |
|
||
| Healthcare / Medical Devices | 1 | $23B |
|
||
| Automotive Technology | 1 | $20B |
|
||
Price history
+0.0% since first listed3 events — show timeline
- 2026-06-12 Listed $149,900 MiRealSource-MiMLS
- 2026-06-12 Listed $149,900 REALCOMP
- 2026-06-11 Coming Soon $149,900 MiRealSource-MiMLS
Property tax history
+9.6%/yrLatest (2025): $7,136 · -2.1% YoY. Source: county tax records.
Cash-flow waterfall
monthlySold comps — $/sqft
last 12 mo · ≤1 miLoading sold comps…