 Duplex
3833-3835 S Bluelake Ct · Wichita, KS
Flood risk No data
- FEMA flood zone
- —
- Chance of flooding over 30 yrs
- —
- Est. flood insurance / yr
- —
Fire risk No data
- Est. fire insurance / yr
- —
Heat risk No data
- Hot days now (above threshold)
- —
- Hot days in 30 yrs
- —
Wind risk No data
- Chance of severe wind over 30 yrs
- —
Air-quality risk No data
- Unhealthy air days now
- —
- Unhealthy air days in 30 yrs
- —
Risk factors via First Street. Map © Google.
Why this score? — see what drove the C- grade
The composite is a weighted blend of 9 inputs, each scored 0–100. Each bar is that input's sub-score; the figure is the points it added to the 100-point composite (weight × sub-score).
- Cash flow +20.5/30.0
- ARV discount +7.5/15.0
- DSCR +6.5/10.0
- 1% rule +6.0/10.0
- Condition / age +4.0/5.0
- Livability +3.6/5.0
- Rent growth +2.5/5.0
- Schools +2.1/10.0
- Appreciation +0.0/10.0
$374,900
🖨 Deal sheet (PDF) 📄 Offer letter ✓ Due diligence
Multi-family units
County records classify this as Multi-Family (2-4 Unit). Listing-text estimate: 2 units. confirmed
Key facts
- Fenced in backyard
- Bar seating
- Walk in pantry
Tags
Property features AI
Finance
- Other: Property located in Sedgwick County
- Financial info: Owner pays: None
- HOA & community: Has association; Association fee approximately $2,000; HOA initiation fee approximately $200
Exterior
- Parking: Attached parking; Paved parking; More than 2 parking spaces per unit (8 total)
- Security: Fenced; Smoke detectors
- Utilities: Natural gas available; Sewer available; Public water
- Home design: Duplex
- Construction: Composition roof
- Exterior features: Fenced; Smoke detectors; Sprinkler system; Composition roof
Interior
- Bedrooms: Duplex with two total units
- Interior features: Dishwasher; Disposal; Microwave; Range; Refrigerator; Other flooring; No basement
Neighborhood map
What this means for you Summary
Snapshot
- This is a 2 × 3-bed/?-bath units multifamily listed at $375k. Condition is rated good.
Deal economics
- At list price, monthly cash flow is $494 ($6k/yr) — positive. Per door: $247/mo.
- The deal already cash-flows at list — no discount required.
- Meets the 1% rule at list price ($4k rent vs $375k).
- Recommended offer: $352k (6.0% below list) — sets the bar for market timing.
Location & tenants
- Location reads 72/100 on livability (#100 in KS) — a middle-class / working-renter tenant base. Strengths: amenities A+, cost of living A+, housing A+; Watch: employment D+, crime F, commute F.
- Haysville (suburban): math 18% / reading 29% proficiency, ranked #137 of 169 in KS (top 81%) — low school quality limits family demand, transient renter base, plan for 1-2y turnover.
- Zoned schools: Oatville Elem (math 42% / reading 57%, grade D, #165 of 684 statewide, top 28%, 401 students, 52% FRL); Haysville West Middle School (math 17% / reading 23%, grade F, #146 of 219 statewide, top 67%, 539 students, 55% FRL); Campus High Haysville (math 8% / reading 25%, grade F, #244 of 327 statewide, top 75%, 1,893 students, 48% FRL).
- Market conditions: 109 active listings in the ZIP; 2,613 units permitted in Sedgwick County in 2024 (258 in 5+ unit buildings).
Forward outlook
- Local home prices are declining (-3.0%/yr); year-one equity from $3k of loan paydown is wiped out by about $11k of value loss. Plan a longer hold.
- Sedgwick County population projected at +5% by 2050 — modest demand growth; plan on rents tracking national, not racing it.
Negotiation context
- It's been on market 90 days — a 6% lower offer ($352k) is reasonable based on typical stale-listing flexibility.
Questions for the listing agent
- It's been on market 90 days. Have you received any prior offers? Is the seller open to a 6% concession, seller financing, or rate buy-down credit?
- Can we see the unit-by-unit rent roll, current vacancy, and any below-market leases? What's the average tenancy length?
- What capital expenditures (roof, boiler, parking lot, exteriors) have been made in the last 5 years, and what's planned in the next 2?
- What does the HOA fee cover, when was the last increase, and are there any pending special assessments or reserve-fund shortfalls?
- Why hasn't it sold? Are there any deal-killer items the seller is aware of (foundation, flood, title, zoning, code violations)?
- Is there a deadline driving the sale (1031 exchange, divorce, estate, relocation)? That informs how much negotiation room exists.
- Schools are F-rated, which usually means shorter tenancies and higher turnover. Who's the typical renter profile here, and what's been the actual vacancy rate?
- Crime grade is F in this area — have there been break-ins, vandalism, or insurance claims at this property in the last 3 years? What carrier currently insures it and at what premium?
- What's the average days-on-market for RENTAL listings here right now (not sales)? A rising rental-DOM trend means longer vacancies and softer asking-rent achievability than the comps imply.
- What's the recent tenant-quality profile in this submarket — average credit score on applications, eviction rate, late-payment / NSF rate, and stable-employment percentage? A property-management company in the area should have these aggregated.
- How much new apartment / multifamily construction is in the pipeline within 1–3 miles? Heavy new supply (>2% of stock underway) typically softens rents 12–24 months out; light construction supports rent growth.
Investment metrics
- 1% rule
- 1.10% ✓
- Cap rate
- 7.87%
- Cash-on-cash
- 5.64%
- DSCR
- 1.25
- GRM
- 7.6
CMA / ARV
No comps found within radius.
Projected returns pro-forma
-3.0% appreciation · 3.0% rent growth · sell at horizon
- IRR
- -7.5%
- Equity multiple
- 0.72×
- Total profit
- $-29,135
- Equity at exit
- $55,899
- IRR
- 2.1%
- Equity multiple
- 1.15×
- Total profit
- $15,795
- Equity at exit
- $32,415
Cash invested: $104,972 (down + closing). Projections, not guarantees.
Landlord ↔ Tenant lean methodology
- Overall (STATE)
- 83 Strongly Landlord-Friendly
- State Kansas
- 83 Strongly Landlord-Friendly · R+10
- County
- — inherits STATE
- City
- — inherits STATE
ZIP-level market 67215
- Home prices YoY
- -14.1%
- Active inventory
- 109
- Price-to-rent
- 15.2×
Monthly cashflow live
- Estimated rent
- $4,116 medium interval (Pro) →
- Mortgage (P&I)
- −$1,966
- Tax est. 1.5%
- −$469 /mo · $5,624/yr
- Insurance
- −$156
- HOA
- −$167
- Vacancy / Maint / Mgmt
- −$864
- Net cashflow
- $494
Break-even live
Sensitivity live
| Price | -10% $753 | -5% $623 | +0% $494 | +5% $364 | +10% $235 |
|---|---|---|---|---|---|
| Rent | -10% $169 | -5% $331 | +0% $494 | +5% $656 | +10% $819 |
| Rate | -1.0pp $683 | -0.5pp $589 | base $494 | +0.5pp $397 | +1.0pp $298 |
2-unit breakdown (identical units grouped — click to expand)
| Units | Beds | Baths | Est. rent |
|---|---|---|---|
| 2× units | 3 | — | $4,116 |
| #1 | 3 | — | $2,058 |
| #2 | 3 | — | $2,058 |
| Total (2 units) | $4,116 | ||
UW: 25.0% down · 7.5% · 30yr · 1.5% tax · 5.0% vac · 8.0% maint · 8.0% mgmt
Financing live
Cash to close
- Down payment
- $93,725
- Closing costs
- $11,247
- Reserves months
- —
- Total cash needed
- —
Loan-product check · same deal, 3 products live
Conventional
25% down · 7.5% · 30yr
- Down + closing
- —
- Monthly P&I
- —
- Monthly cashflow
- —
- DSCR
- —
- Eligible?
- —
Personal DTI + credit; lowest rate.
DSCR
20% down · 8.5% · 30yr
- Down + closing
- —
- Monthly P&I
- —
- Monthly cashflow
- —
- DSCR
- —
- Eligible?
- —
No personal income docs; deal must DSCR.
Hard money
10% down · 12.0% · 12mo
- Down + closing
- —
- Monthly P&I
- —
- Monthly cashflow
- —
- DSCR
- —
- Eligible?
- —
Short-term bridge; refi at stabilization.
HOA detail
- Monthly dues
- $167 · $2,004/yr
Listing history 16 events
-
2026-06-18days on market $374,900 Active 90 DOM
-
2026-06-17days on market $374,900 Active 89 DOM
-
2026-06-16days on market $374,900 Active 88 DOM
-
2026-06-15days on market $374,900 Active 87 DOM
-
2026-06-14days on market $374,900 Active 85 DOM
-
2026-06-10days on market $374,900 Active 82 DOM
-
2026-06-09days on market $374,900 Active 81 DOM
-
2026-06-08days on market $374,900 Active 80 DOM
-
2026-06-07days on market $374,900 Active 79 DOM
-
2026-06-05days on market $374,900 Active 76 DOM
-
2026-06-03days on market $374,900 Active 75 DOM
-
2026-06-02days on market $374,900 Active 74 DOM
-
2026-06-01days on market $374,900 Active 73 DOM
-
2026-05-31days on market $374,900 Active 72 DOM
-
2026-05-30days on market $374,900 Active 71 DOM
-
2026-03-20$374,900 Active
ⓘ Source: listings_history table (triggers on properties + properties_extension) + one-shot
backfill from property_details.listing_events for pre-trigger history.
Nearby sold comps map
Loading sold comps map…
Walkable amenities ~0.75 mi
Loading nearby amenities…
Taxation est. · year 1
- Rental income
- $49,392
- − Mortgage interest
- −$21,000
- − Property taxes
- −$5,624
- − Insurance
- −$1,874
- − Repairs & maintenance
- −$3,951
- − Management
- −$3,951
- − HOA
- −$2,004
- − Depreciation
- −$10,906
- Taxable income
- $81
- Est. tax owed @ 24.0%
- −$19
- After-tax cash flow
- $5,906/yr
For passive investors: Depreciation is non-cash, so a rental often shows a tax loss while cash-flowing — sheltering income. Rental losses are passive: they offset passive income freely, and up to $25,000/yr can offset ordinary (W-2) income if you actively participate and your MAGI is under $100k (phasing out to $0 by $150k); unused losses carry forward. On sale, claimed depreciation is recaptured at up to 25%, and gains may owe capital-gains tax (a 1031 exchange can defer both). Figures are a year-1 estimate at your 24.0% rate — not tax advice; consult a CPA.
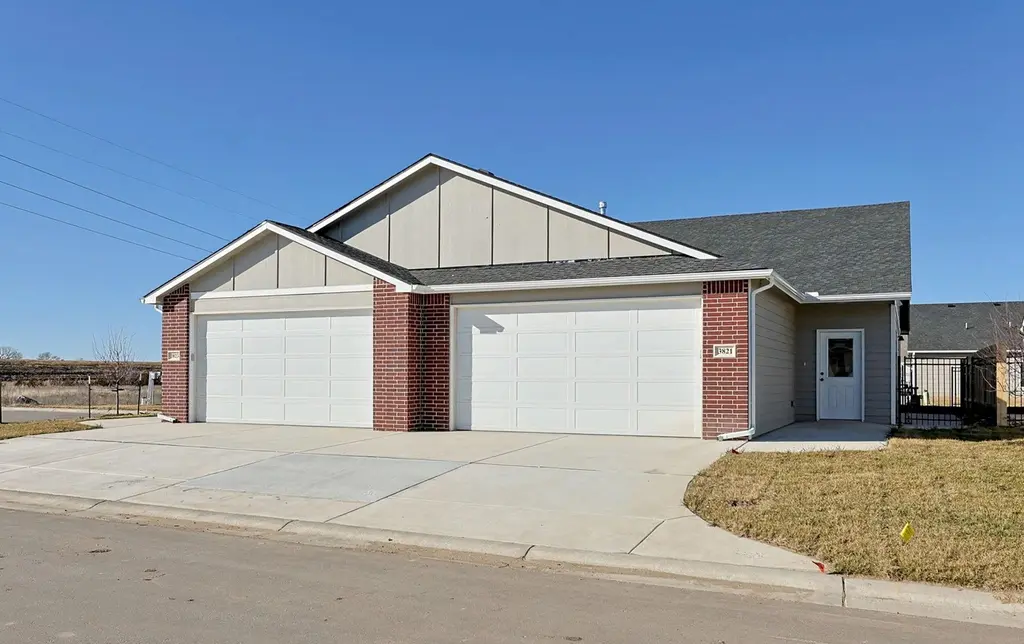
Condition & rehab AI · 13 photos
This multi-family property is in good condition with minimal repairs needed. Painting the exterior and cleaning gutters would significantly enhance its curb appeal and value.
Value-add opportunities
- Both Paint exterior — Enhances curb appeal and value
- Both Clean gutters — Improves drainage and property value
Renovation cost estimate screening
Value-add ROI direction
- Both Paint exterior — Enhances curb appeal and value ↑
- Both Clean gutters — Improves drainage and property value ↑
ⓘ Cost ranges are severity-bucket heuristics (US national rule-of-thumb). Get contractor quotes + a written scope before underwriting a rehab budget.
Schools (NCES district)
- District
- Haysville
- NCES district ID
- 2007050
- Math proficiency
- 18% ▼ -7.00%
- Reading proficiency
- 29% ▼ -1.00%
- Median HH income
- $55,560
- Composite
- 21.3/100
- National rank
- #8385
- State rank
- #137 of 169 in KS
Livability — Wichita
- Score
- 72/100
- State rank
- #100
- US rank
- #5730
Category grades
Schools grade is shown separately in the Schools card above.
Census & demographics
- Census place
- Wichita, KS
- City population
- 365,168
- Population (ZIP)
- 6,468
Population outlook (Sedgwick County) Hauer SSP2
- Today (2025)
- 537,014 people
- By 2030
- 546,984 · +1.9%
- By 2040
- 559,141 · +4.1%
- By 2050
- 562,027 · +4.7%
- By 2075
- 557,255 · +3.8%
- By 2100
- 513,383 · -4.4%
Race, ethnicity, and origin ACS 2023
- Neighborhood character
- Predominantly White (68%)
- Race & ethnicity
- White 68% Hispanic / Latino 14% Two or more races 9% Asian 8% Black 4%
- Hispanic origin (detail)
- Mexican 12%
- Common ancestry
- Lithuanian 4% Romanian 2% Iranian 2%
- Foreign-born
- 10% · Vietnam, Canada, South Korea
- Languages at home
- 82% English-only · Spanish 11% Other Asian/Pacific 2% Korean 2%
Political lean MEDSL · Sedgwick
- 2024 margin
- R (+13.8) · D 42.3% · R 56.1% · Other 1.6%
- 2008→2024 swing
- -1.1pp toward R · 2008: -12.7pp · 2024: -13.8pp
- All cycles
- 2024: R+13.8 2020: R+12.6 2016: R+19.1 2012: R+19.7 2008: R+12.7
Not yet ingested
- Civics
- —
Market trends
- HPI YoY
- ▼ -43.22%
- Current HPI
- 262.6723
- Rent YoY
- —
- Metro
- —
- State GDP YoY
- —
- F500 in state
- 0
Price history
1 event — show timeline
- 2026-03-20 Listed $374,900 SCKMLS as Distributed by MLS Grid
Cash-flow waterfall
monthlySold comps — $/sqft
last 12 mo · ≤1 miLoading sold comps…