215 Lakepark · Placentia, CA
Flood risk 1/10 · Minimal
- FEMA flood zone
- X (shaded)
- Chance of flooding over 30 yrs
- 0.0%
- Est. flood insurance / yr
- $507 – $1,088
Fire risk 1/10 · Minimal
- Est. fire insurance / yr
- $659 – $1,223
Heat risk 6/10 · Moderate
- Hot days now (above 95°F)
- 7 days/yr
- Hot days in 30 yrs
- 21 days/yr
Wind risk 1/10 · Minimal
- Chance of severe wind over 30 yrs
- —
Air-quality risk 5/10 · Moderate
- Unhealthy air days now
- 7 days/yr
- Unhealthy air days in 30 yrs
- 9 days/yr
Risk factors via First Street. Map © Google.
Why this score? — see what drove the B- grade
The composite is a weighted blend of 9 inputs, each scored 0–100. Each bar is that input's sub-score; the figure is the points it added to the 100-point composite (weight × sub-score).
- Cash flow +30.0/30.0
- DSCR +10.0/10.0
- 1% rule +8.9/10.0
- ARV discount +5.2/15.0
- Schools +5.2/10.0
- Livability +3.4/5.0
- Rent growth +3.3/5.0
- Condition / age +2.5/5.0
- Appreciation +0.0/10.0
$230,000
🖨 Deal sheet 📄 Offer letter ✓ Due diligence
Listing remarks MLS
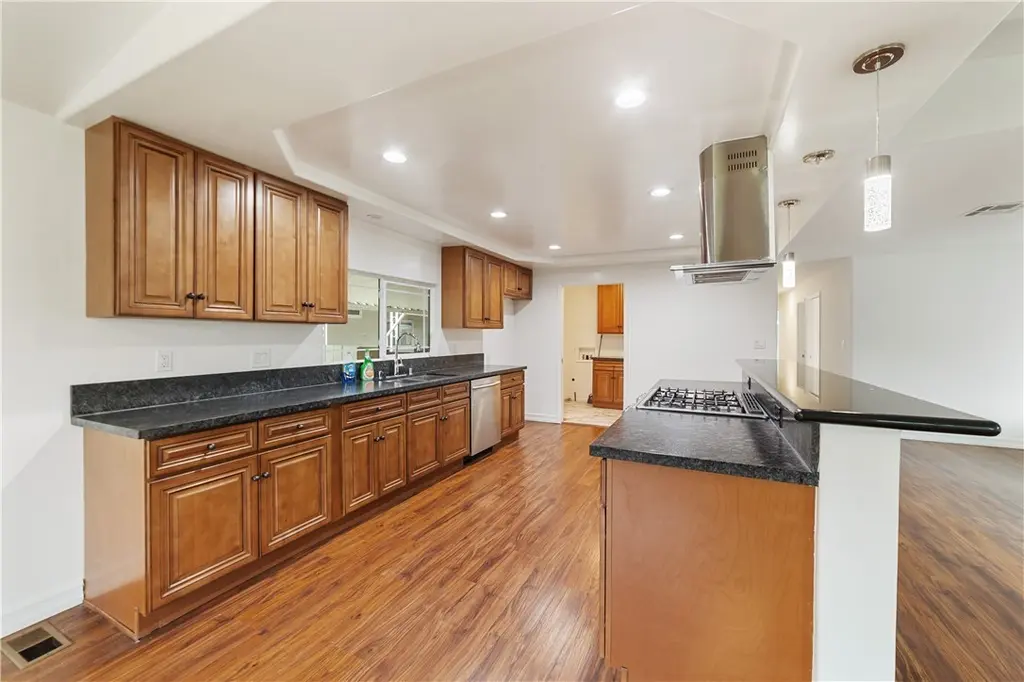
complete remodel * * * Corner Lot * * * BIG front porch * * * NEW flooring * * * NEW bathrooms * * * NEW kitchen * * * 2 bedroom + den/office * * * NEW windows * * * one of Orange County's most desirable communities!
Key facts
- Open floor plan
- New kitchen
- Inviting front porch
Tags
Neighborhood map
What this means for you Summary
Snapshot
- This is a 2-bed/2.0-bath manufactured listed at $230k.
Deal economics
- At list price, monthly cash flow is $935 ($11k/yr) — positive.
- The deal already cash-flows at list — no discount required.
- Meets the 1% rule at list price ($3k rent vs $230k).
- Cap rate 11.2% vs local median 2.3% in Placentia — top-decile yield for the area; either an underpriced asset or a hidden risk that comps aren't pricing in. Stress-test before assuming the spread holds.
Location & tenants
- Location reads 68/100 on livability (#290 in CA) — a middle-class / working-renter tenant base. Strengths: commute A+, employment A+; Watch: amenities F, cost of living F, health & safety F.
- Placentia-Yorba Linda Unified (suburban): math 48% / reading 66% proficiency, ranked #78 of 517 in CA (top 15%) — acceptable for families but not a draw, mixed tenant base, ~2y average lease.
- Market conditions: Rents rising (+3.3%/yr); 73 active listings in the ZIP; 20 comparable units currently listed for rent nearby; rentals leasing fast (median 7d on market — plan ~1-2 weeks tenant-placement turnaround); high-income renter base; 6,974 units permitted in Orange County in 2024 (3,839 in 5+ unit buildings).
- This rent runs 33% of the median local income ($116k/yr) — at the standard rent-burdened threshold; future hikes will face affordability resistance.
Forward outlook
- Local home prices are declining (-3.0%/yr); year-one equity from $2k of loan paydown is wiped out by about $7k of value loss. Plan a longer hold.
- Orange County population projected at +14% by 2050 — modest demand growth; plan on rents tracking national, not racing it.
- At projected returns (-3.0% appreciation + 3.3% rent growth), your $64k cash investment doubles in ~7 years — after that, you're playing with house money.
Negotiation context
- Only 9 days on market — expect competitive offers; lowballing is unlikely to land.
- 3 sale attempts since 2y ago; this cycle's ask has dropped $29k (11%) from the opening price — seller is motivated, your offer sets the floor, not the list.
Risks & watch-outs
- Climate carrying-cost: extreme-heat days projected 7→21/yr by 2055 (HVAC capex compounding) — expect insurance premiums to compound above CPI over the hold.
Questions for the listing agent
- Built in 1976 — when were the roof, HVAC, electrical panel, plumbing, and water heater last replaced?
- Is there a deadline driving the sale (1031 exchange, divorce, estate, relocation)? That informs how much negotiation room exists.
- Schools are B-rated — typically a magnet for longer-tenancy family renters. What's the average tenant stay here, and is there a school-zone premium baked into asking?
- What's the average days-on-market for RENTAL listings here right now (not sales)? A rising rental-DOM trend means longer vacancies and softer asking-rent achievability than the comps imply.
- What's the recent tenant-quality profile in this submarket — average credit score on applications, eviction rate, late-payment / NSF rate, and stable-employment percentage? A property-management company in the area should have these aggregated.
- How much new for-sale + rental construction is in the pipeline within 1–3 miles? Heavy new supply typically softens prices + rents 12–24 months out; constrained supply supports both.
Investment metrics
- 1% rule
- 1.39% ✓
- Cap rate
- 11.17%
- Cash-on-cash
- 17.43%
- DSCR
- 1.78
- GRM
- 6.0
CMA / ARV
- ARV (median comp)
- $218,685
- List price
- $230,000
- Delta
- 7.46%
- Verdict
- FAIR
- Comps
- 20 within 1.0 mi
Show comp detail 12 sales within ~0.75 mi
| Address | Dist | Beds/Ba | Sqft | Sold | Price | $/sf | Match |
|---|---|---|---|---|---|---|---|
| 210 Silverlake | 0.06mi | 2/2.0 | 1,536 (0%) | 1mo | $235,000 | $153 | 96 |
| 210 Lakepark Dr | 0.02mi | 2/2.0 | 1,440 (-6%) | 12mo | $240,000 | $167 | 79 |
| 320 Lakepark Dr | 0.03mi | 2/2.0 | 1,440 (-6%) | 11mo | $230,000 | $160 | 79 |
| 161 E Orangethorpe Ave #102 | 0.29mi | 3/2.0 (+1) | 1,512 (-2%) | 1mo | $299,000 | $198 | 78 |
| 345 Crestlake Cir | 0.05mi | 2/2.0 | 1,650 (+7%) | 9mo | $195,000 | $118 | 78 |
| 300 Ridgelake Dr #46 | 0.10mi | 2/2.0 | 1,440 (-6%) | 11mo | $230,000 | $160 | 76 |
| 255 Clearlake Cir #98 | 0.11mi | 2/2.0 | 1,440 (-6%) | 14mo | $369,500 | $257 | 72 |
| 335 Ridgelake | 0.13mi | 2/2.0 | 1,356 (-12%) | 4mo | $175,000 | $129 | 71 |
| 305 Ridge Lake Dr #33 | 0.12mi | 2/2.0 | 1,680 (+9%) | 16mo | $370,000 | $220 | 66 |
| 235 Silverlake Dr | 0.11mi | 3/2.0 (+1) | 1,680 (+9%) | 16mo | $310,000 | $185 | 61 |
| 161 E Orangethorpe Ave #130 | 0.29mi | 2/2.0 | 1,344 (-12%) | 16mo | $280,000 | $208 | 52 |
| 161 E Orangethorpe Ave #8 | 0.29mi | 2/2.0 | 1,344 (-12%) | 18mo | $245,000 | $182 | 51 |
Match score weights: distance 35% · size 25% · config 20% · recency 20%. Top-matched comps best support the ARV.
Projected returns pro-forma
-3.0% appreciation · 3.33% rent growth · sell at horizon
- IRR
- 9.2%
- Equity multiple
- 1.36×
- Total profit
- $23,425
- Equity at exit
- $34,294
- IRR
- 18.7%
- Equity multiple
- 2.58×
- Total profit
- $101,714
- Equity at exit
- $19,886
Cash invested: $64,400 (down + closing). Projections, not guarantees.
Landlord ↔ Tenant lean methodology
- Overall (STATE)
- 18 Strongly Tenant-Friendly
- State California
- 18 Strongly Tenant-Friendly · D+13
- County
- — inherits STATE
- City
- — inherits STATE
ZIP-level market 92870
- Rents YoY
- 3.3%
- Active inventory
- 73
- Price-to-rent
- 6.0×
Monthly cashflow live
- Estimated rent
- $3,196 high interval (Pro) →
- Mortgage (P&I)
- −$1,206
- Tax est. 1.5%
- −$288 /mo · $3,450/yr
- Insurance
- −$96
- HOA
- −$0
- Vacancy / Maint / Mgmt
- −$671
- Net cashflow
- $935
Break-even live
UW: 25.0% down · 7.5% · 30yr · 1.5% tax · 5.0% vac · 8.0% maint · 8.0% mgmt
Financing live
Cash to close
- Down payment
- $57,500
- Closing costs
- $6,900
- Reserves months
- —
- Total cash needed
- —
Loan-product check · same deal, 3 products live
Conventional
25% down · 7.5% · 30yr
- Down + closing
- —
- Monthly P&I
- —
- Monthly cashflow
- —
- DSCR
- —
- Eligible?
- —
Personal DTI + credit; lowest rate.
DSCR
20% down · 8.5% · 30yr
- Down + closing
- —
- Monthly P&I
- —
- Monthly cashflow
- —
- DSCR
- —
- Eligible?
- —
No personal income docs; deal must DSCR.
Hard money
10% down · 12.0% · 12mo
- Down + closing
- —
- Monthly P&I
- —
- Monthly cashflow
- —
- DSCR
- —
- Eligible?
- —
Short-term bridge; refi at stabilization.
Rent comps 20 comps
| Address | Beds | Baths | Sqft | Rent | $/sqft | DOM | Units | Dist |
|---|---|---|---|---|---|---|---|---|
| 150 E Crowther Ave Placentia, CA | 1.0–2.0 | 1.0–2.0 | 871 | $3,661 | $4.20 | 3d | 12 | 0.31mi |
| 266 Backs Ln Placentia, CA | 2.0–3.0 | 2.0–2.5 | 1221 | $2,600 | $2.13 | 6d | 5 | 0.37mi |
| 155 S Angelina Dr Placentia, CA | 1.0–2.0 | 1.0–2.5 | 906 | $2,855 | $3.15 | 3d | 7 | 0.45mi |
| 203 Oahu Way Placentia, CA | 2.0 | 1.5 | 1270 | $3,495 | $2.75 | 24d | 1 | 0.47mi |
| 307 E Chapman Ave Placentia, CA | 3.0 | 2.5 | 1280 | $3,650 | $2.85 | 3d | 1 | 0.56mi |
| 501 W Crowther Ave Placentia, CA | 3.0 | 1.0–2.5 | 1050 | $3,612 | $3.44 | 3d | 38 | 0.56mi |
| 201 E Chapman Ave Placentia, CA | 1.0–2.0 | 1.0–2.0 | 938 | $3,127 | $3.33 | 2d | 21 | 0.62mi |
| 349 Camarillo St Unit C Placentia, CA | 2.0 | 1.5 | 1100 | $2,300 | $2.09 | 43d | 1 | 0.66mi |
| 940 Cypress Ave Placentia, CA | 3.0 | 2.0 | 1644 | $3,900 | $2.37 | 17d | 1 | 0.69mi |
| 1017 Avenue De Pio Pico Unit 1017 Placentia, CA | 3.0 | 2.0 | 1400 | $3,695 | $2.64 | 43d | 1 | 0.79mi |
| 2650 E Park Ln Apt A Anaheim, CA | 3.0 | 2.0 | 1100 | $3,200 | $2.91 | 43d | 1 | 0.82mi |
| 144 Primrose Ave Unit 1 Placentia, CA | 3.0 | 3.0 | 1300 | $3,850 | $2.96 | 7d | 1 | 0.87mi |
| 525 Twilight St Placentia, CA | 3.0 | 2.0 | 1160 | $3,800 | $3.28 | 12d | 1 | 1.00mi |
| 449 N Via Napoli Anaheim, CA | 3.0 | 1.5 | 1266 | $3,445 | $2.72 | 10d | 1 | 1.31mi |
| 3004 E Via Bruno Anaheim, CA | 3.0 | 1.5 | 1180 | $3,350 | $2.84 | 24d | 1 | 1.34mi |
| 2965 E Jackson Ave Anaheim, CA | 1.0–2.0 | 1.0–1.5 | 885 | $3,075 | $3.47 | 2d | 11 | 1.34mi |
| 3300 Quartz Ln Fullerton, CA | 1.0–2.0 | 1.0–2.0 | 882 | $3,015 | $3.42 | 6d | 8 | 1.36mi |
| 2627 E La Palma Ave Anaheim, CA | 2.0 | 2.0 | 1204 | $3,360 | $2.79 | 7d | 1 | 1.40mi |
| 3340 Topaz Ln Fullerton, CA | 2.0 | 2.0 | 1050 | $2,666 | $2.54 | 2d | 7 | 1.42mi |
| 1341 Cameo Ln Fullerton, CA | 2.0 | 1.5 | 1210 | $3,000 | $2.48 | 17d | 1 | 1.45mi |
Listing history 25 events
-
2026-06-18days on market $230,000 Active 9 DOM
-
2026-06-17price $230,000 Active 8 DOM
-
2026-06-17days on market $235,000 Active 8 DOM
-
2026-06-16days on market $235,000 Active 7 DOM
-
2026-06-15days on market $235,000 Active 6 DOM
-
2026-06-13days on market $235,000 Active 4 DOM
-
2026-06-13days on market $235,000 Active 3 DOM
-
2026-06-10remarks 305-char remark
-
2026-06-10days on market $235,000 Active 1 DOM
-
2026-06-04days on market $235,000 Active 89 DOM
-
2026-06-03days on market $235,000 Active 88 DOM
-
2026-06-02days on market $235,000 Active 87 DOM
-
2026-06-01days on market $235,000 Active 86 DOM
-
2026-05-31days on market $235,000 Active 85 DOM
-
2026-05-15price $235,000 248-char remark
Show marketing remark (248 chars)
complete remodel * * * Corner Lot * * * BIG front porch * * * NEW flooring * * * NEW bathrooms * * * NEW kitchen * * * 2 bedroom + den/office * * * NEW windows * * * one of Orange County's most desirable communities!
-
2026-04-16price $240,000 248-char remark
Show marketing remark (248 chars)
complete remodel * * * Corner Lot * * * BIG front porch * * * NEW flooring * * * NEW bathrooms * * * NEW kitchen * * * 2 bedroom + den/office * * * NEW windows * * * one of Orange County's most desirable communities!
-
2026-03-23price $250,000 248-char remark
Show marketing remark (248 chars)
complete remodel * * * Corner Lot * * * BIG front porch * * * NEW flooring * * * NEW bathrooms * * * NEW kitchen * * * 2 bedroom + den/office * * * NEW windows * * * one of Orange County's most desirable communities!
-
2026-03-07$259,000 Active 248-char remark
Show marketing remark (248 chars)
complete remodel * * * Corner Lot * * * BIG front porch * * * NEW flooring * * * NEW bathrooms * * * NEW kitchen * * * 2 bedroom + den/office * * * NEW windows * * * one of Orange County's most desirable communities!
-
2026-03-06historical
-
2026-02-19price $265,000
-
2026-01-29price $274,999
-
2026-01-11price $284,999
-
2026-01-04$309,900 Active
-
2024-07-05historical
-
2024-05-09$289,500 Active
ⓘ Source: listings_history table (triggers on properties + properties_extension) + one-shot
backfill from property_details.listing_events for pre-trigger history.
Climate risk First Street
- Flood 1/10 Low FEMA zone X (shaded) · 0% chance over 30 yrs
- Wildfire 1/10 Low
- Heat 6/10 Major 7 d/yr ≥95°F today · 21 d/yr by 30 yrs out
- Wind 1/10 Low
- Air quality 5/10 Major 7 unhealthy d/yr today · 9 by 30 yrs out
Nearby sold comps map
Loading sold comps map…
Walkable amenities ~0.75 mi
Loading nearby amenities…
Taxation est. · year 1
- Rental income
- $38,354
- − Mortgage interest
- −$12,884
- − Property taxes
- −$3,450
- − Insurance
- −$1,150
- − Repairs & maintenance
- −$3,068
- − Management
- −$3,068
- − Depreciation
- −$6,691
- Taxable income
- $8,043
- Est. tax owed @ 24.0%
- −$1,930
- After-tax cash flow
- $9,296/yr
For passive investors: Depreciation is non-cash, so a rental often shows a tax loss while cash-flowing — sheltering income. Rental losses are passive: they offset passive income freely, and up to $25,000/yr can offset ordinary (W-2) income if you actively participate and your MAGI is under $100k (phasing out to $0 by $150k); unused losses carry forward. On sale, claimed depreciation is recaptured at up to 25%, and gains may owe capital-gains tax (a 1031 exchange can defer both). Figures are a year-1 estimate at your 24.0% rate — not tax advice; consult a CPA.
Schools (NCES district)
- District
- Placentia-Yorba Linda Unified
- NCES district ID
- 0630660
- Math proficiency
- 48% ▼ -10.00%
- Reading proficiency
- 66% ▼ -2.00%
- Median HH income
- $87,455
- Composite
- 52.1/100
- National rank
- #1622
- State rank
- #78 of 517 in CA
Livability — Placentia
- Score
- 68/100
- State rank
- #290
- US rank
- #9784
Category grades
Schools grade is shown separately in the Schools card above.
Census & demographics
- Census place
- Placentia, CA
- County
- Orange County · 3,096,323 people
- City population
- 52,826
- Metro
- Los Angeles-Long Beach-Anaheim, CA
- Population (ZIP)
- 52,826
- Household income
- $115,929
- Rent vs Own
- Severe rent burden
- 2024.0
Population outlook (Orange County) Hauer SSP2
- Today (2025)
- 3,477,456 people
- By 2030
- 3,613,117 · +3.9%
- By 2040
- 3,835,945 · +10.3%
- By 2050
- 3,968,736 · +14.1%
- By 2075
- 4,097,053 · +17.8%
- By 2100
- 3,903,633 · +12.3%
Race, ethnicity, and origin ACS 2023
- Neighborhood character
- Diverse neighborhood (Simpson 0.69)
- Race & ethnicity
- White 39% Hispanic / Latino 36% Two or more races 20% Asian 18% Black 2%
- Hispanic origin (detail)
- Mexican 29% Salvadoran 1%
- Common ancestry
- Lithuanian 2% Iranian 2% Italian 2%
- Foreign-born
- 24% · Canada, South Korea, China
- Languages at home
- 61% English-only · Spanish 22% Other Indo-European 4% Chinese 3%
Political lean MEDSL · Orange
- 2024 margin
- Toss-up / Even · D 49.7% · R 47.1% · Other 3.2%
- 2008→2024 swing
- +5.2pp toward D · 2008: -2.6pp · 2024: 2.6pp
- All cycles
- 2024: D+2.6 2020: D+9.0 2016: D+7.7 2012: R+8.3 2008: R+2.6
Not yet ingested
- Civics
- —
Market trends
- HPI YoY
- ▼ -855.13%
- Current HPI
- 413.4729
- Rent YoY
- ▲ 3.33%
- Metro
- Los Angeles-Long Beach-Anaheim, CA
- State GDP YoY
- ▲ 3.21%
- F500 in state
- 116
Industry mix (Fortune 500 HQ in CA)
| Industry | F500 HQs | Revenue |
|---|---|---|
| Technology | 27 | $1,492B |
|
||
| Financial Services | 3 | $174B |
|
||
| Retail | 3 | $44B |
|
||
| Insurance | 3 | $26B |
|
||
| Media / Entertainment | 2 | $115B |
|
||
| Pharmaceuticals / Biotech | 2 | $62B |
|
||
Price history
-18.8% since first listed11 events — show timeline
- 2026-05-15 Price Changed $235,000 CRMLS
- 2026-04-16 Price Changed $240,000 CRMLS
- 2026-03-23 Price Changed $250,000 CRMLS
- 2026-03-07 Listed $259,000 CRMLS
- 2026-03-06 Listing Removed — CRMLS
- 2026-02-19 Price Changed $265,000 CRMLS
- 2026-01-29 Price Changed $274,999 CRMLS
- 2026-01-11 Price Changed $284,999 CRMLS
- 2026-01-04 Listed $309,900 CRMLS
- 2024-07-05 Listing Removed — CRMLS
- 2024-05-09 Listed $289,500 CRMLS
Property tax history
-4.0%/yrLatest (2025): $32 · +0.1% YoY. Source: county tax records.
Cash-flow waterfall
monthlySold comps — $/sqft
last 12 mo · ≤1 miLoading sold comps…