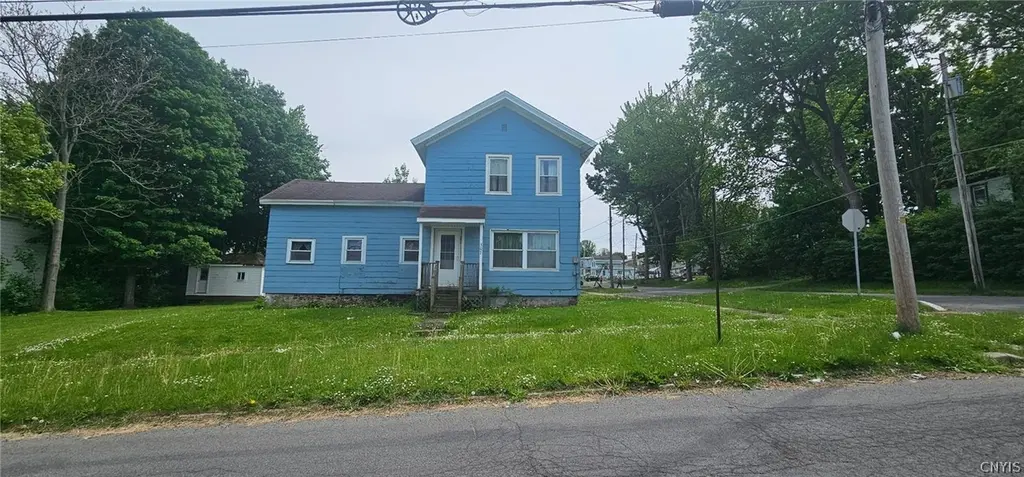
502 Utica St · Fulton, NY
Flood risk 1/10 · Minimal
- FEMA flood zone
- X (unshaded)
- Chance of flooding over 30 yrs
- 0.0%
- Est. flood insurance / yr
- $473 – $860
Fire risk 2/10 · Minimal
- Est. fire insurance / yr
- $691 – $1,283
Heat risk 2/10 · Minimal
- Hot days now (above 95°F)
- 7 days/yr
- Hot days in 30 yrs
- 16 days/yr
Wind risk 1/10 · Minimal
- Chance of severe wind over 30 yrs
- 1.0%
Air-quality risk 2/10 · Minimal
- Unhealthy air days now
- 1 days/yr
- Unhealthy air days in 30 yrs
- 1 days/yr
Risk factors via First Street. Map © Google.
Why this score? — see what drove the B+ grade
The composite is a weighted blend of 9 inputs, each scored 0–100. Each bar is that input's sub-score; the figure is the points it added to the 100-point composite (weight × sub-score).
- Cash flow +30.0/30.0
- 1% rule +10.0/10.0
- DSCR +10.0/10.0
- Appreciation +8.4/10.0
- ARV discount +7.5/15.0
- Livability +3.1/5.0
- Schools +3.0/10.0
- Rent growth +2.5/5.0
- Condition / age +2.5/5.0
$50,000
🖨 Deal sheet (PDF) 📄 Offer letter ✓ Due diligence
Listing remarks
This 3 bedroom, 1 1/2 bath two-story home is situated on a corner lot and offers plenty of potential for its next owner.
Key facts
- 4,356 sq ft lot
- Built 1891
- Listed 7 days
Property features AI
Exterior
- Parking: No garage
- Utilities: Public water connected; Sewer connected
- Home design: 2-story home; Existing construction; Wood siding
- Construction: Block foundation
- Exterior features: Dirt driveway; Corner, rectangular residential lot; 66 x 66 lot dimensions; City street frontage
Interior
- Kitchen: Country-style kitchen
- Bedrooms: 3 main-level bedrooms
- Bathrooms: 1 full bathroom; 1 half bathroom; 2 main-level bathrooms
- Heating & cooling: Forced air heating; Has heating
- Interior features: Separate/formal living room; Country kitchen; Partial basement
- Laundry & utility: Laundry in basement; Water heater
Neighborhood map
What this means for you Summary
Snapshot
- This is a 3-bed/1.5-bath single-family listed at $50k.
Deal economics
- At list price, monthly cash flow is $979 ($12k/yr) — positive.
- The deal already cash-flows at list — no discount required.
- Meets the 1% rule at list price ($2k rent vs $50k).
- Cap rate 29.8% vs local median 6.9% in Fulton — top-decile yield for the area; either an underpriced asset or a hidden risk that comps aren't pricing in. Stress-test before assuming the spread holds.
Location & tenants
- Location reads 61/100 on livability (#907 in NY) — a middle-class / working-renter tenant base. Strengths: cost of living A+, housing A+; Watch: employment D, schools D-, crime F.
- Fulton City School District (town): math 29% / reading 43% proficiency, ranked #554 of 590 in NY (top 94%) — families likely to look elsewhere, expect single-tenant / working-renter base with shorter leases.
- Market conditions: 115 active listings in the ZIP; 3 comparable units currently listed for rent nearby; rentals at typical pace (median 15d on market — plan ~3-4 weeks tenant-placement turnaround); 172 units permitted in Oswego County in 2024 (27 in 5+ unit buildings).
Forward outlook
- In year one you build about $4k of equity ($346 loan paydown + $3k appreciation (6.8% local appreciation)).
- Oswego County population projected at -23% by 2050 — secular population decline; favor cash flow + early exit over multi-decade hold.
- At projected returns (6.8% appreciation + 3.0% rent growth), your $14k cash investment doubles in ~1 year — after that, you're playing with house money.
- By year 9, paydown + projected appreciation supports a ~$34k cash-out refi (75% LTV) — recoverable capital for the next deal without selling this one.
Negotiation context
- Only 7 days on market — expect competitive offers; lowballing is unlikely to land.
Risks & watch-outs
- Watch-outs: built in 1891 — expect roof / HVAC / electrical / plumbing capex.
Questions for the listing agent
- Built in 1891 — when were the roof, HVAC, electrical panel, plumbing, and water heater last replaced?
- Is there a deadline driving the sale (1031 exchange, divorce, estate, relocation)? That informs how much negotiation room exists.
- Schools are D-rated, which usually means shorter tenancies and higher turnover. Who's the typical renter profile here, and what's been the actual vacancy rate?
- Crime grade is F in this area — have there been break-ins, vandalism, or insurance claims at this property in the last 3 years? What carrier currently insures it and at what premium?
- What's the average days-on-market for RENTAL listings here right now (not sales)? A rising rental-DOM trend means longer vacancies and softer asking-rent achievability than the comps imply.
- What's the recent tenant-quality profile in this submarket — average credit score on applications, eviction rate, late-payment / NSF rate, and stable-employment percentage? A property-management company in the area should have these aggregated.
- How much new for-sale + rental construction is in the pipeline within 1–3 miles? Heavy new supply typically softens prices + rents 12–24 months out; constrained supply supports both.
Investment metrics
- 1% rule
- 3.35% ✓
- Cap rate
- 29.78%
- Cash-on-cash
- 83.89%
- DSCR
- 4.73
- GRM
- 2.5
CMA / ARV
- ARV (on-the-fly)
- $161,357
- Comps found
- 12
Show comp detail 12 sales within ~0.75 mi
| Address | Dist | Beds/Ba | Sqft | Sold | Price | $/sf | Match |
|---|---|---|---|---|---|---|---|
| 409 Seneca St | 0.21mi | 4/1.0 (+1) | 1,726 (-5%) | 2mo | $111,300 | $64 | 74 |
| 608 Seneca St | 0.20mi | 4/2.0 (+1) | 1,942 (+7%) | 0mo | $149,900 | $77 | 72 |
| 368 S 7th St | 0.43mi | 4/1.5 (+1) | 1,842 (+2%) | 3mo | $162,000 | $88 | 70 |
| 362 S 4th St | 0.45mi | 4/1.5 (+1) | 1,812 (-0%) | 8mo | $180,000 | $99 | 67 |
| 1021 Cayuga St | 0.48mi | 3/1.0 | 1,743 (-4%) | 3mo | $95,000 | $55 | 67 |
| 890 Cayuga St | 0.39mi | 4/1.5 (+1) | 1,716 (-5%) | 4mo | $110,000 | $64 | 64 |
| 17 N 5th St | 0.18mi | 4/2.0 (+1) | 1,650 (-9%) | 7mo | $192,000 | $116 | 64 |
| 205 S 4th St | 0.22mi | 4/1.5 (+1) | 2,004 (+10%) | 8mo | $215,000 | $107 | 61 |
| 264 S 5th St | 0.29mi | 3/3.0 | 2,034 (+12%) | 9mo | $193,500 | $95 | 52 |
| 121 Lyon St | 0.70mi | 3/2.0 | 1,684 (-7%) | 5mo | $42,500 | $25 | 50 |
| 57 W 1st St S | 0.59mi | 3/1.5 | 1,590 (-12%) | 5mo | $180,000 | $113 | 48 |
| 410 Park St | 0.54mi | 4/1.5 (+1) | 1,595 (-12%) | 10mo | $141,400 | $89 | 41 |
Match score weights: distance 35% · size 25% · config 20% · recency 20%. Top-matched comps best support the ARV.
Projected returns pro-forma
6.75% appreciation · 3.0% rent growth · sell at horizon
- IRR
- 91.0%
- Equity multiple
- 6.65×
- Total profit
- $79,043
- Equity at exit
- $33,822
- IRR
- 88.1%
- Equity multiple
- 14.09×
- Total profit
- $183,253
- Equity at exit
- $63,510
Cash invested: $14,000 (down + closing). Projections, not guarantees.
Landlord ↔ Tenant lean methodology
- Overall (STATE)
- 15 Strongly Tenant-Friendly
- State New York
- 15 Strongly Tenant-Friendly · D+10
- County
- — inherits STATE
- City
- — inherits STATE
ZIP-level market 13069
- Home prices YoY
- 2.3%
- Active inventory
- 115
- Price-to-rent
- 2.5×
Monthly cashflow live
- Estimated rent
- $1,676 medium interval (Pro) →
- Mortgage (P&I)
- −$262
- Tax est. 1.5%
- −$62 /mo · $750/yr
- Insurance
- −$21
- HOA
- −$0
- Vacancy / Maint / Mgmt
- −$352
- Net cashflow
- $979
Break-even live
Sensitivity live
| Price | -10% $1,013 | -5% $996 | +0% $979 | +5% $961 | +10% $944 |
|---|---|---|---|---|---|
| Rent | -10% $846 | -5% $913 | +0% $979 | +5% $1,045 | +10% $1,111 |
| Rate | -1.0pp $1,004 | -0.5pp $991 | base $979 | +0.5pp $966 | +1.0pp $953 |
UW: 25.0% down · 7.5% · 30yr · 1.5% tax · 5.0% vac · 8.0% maint · 8.0% mgmt
Financing live
Cash to close
- Down payment
- $12,500
- Closing costs
- $1,500
- Reserves months
- —
- Total cash needed
- —
Loan-product check · same deal, 3 products live
Conventional
25% down · 7.5% · 30yr
- Down + closing
- —
- Monthly P&I
- —
- Monthly cashflow
- —
- DSCR
- —
- Eligible?
- —
Personal DTI + credit; lowest rate.
DSCR
20% down · 8.5% · 30yr
- Down + closing
- —
- Monthly P&I
- —
- Monthly cashflow
- —
- DSCR
- —
- Eligible?
- —
No personal income docs; deal must DSCR.
Hard money
10% down · 12.0% · 12mo
- Down + closing
- —
- Monthly P&I
- —
- Monthly cashflow
- —
- DSCR
- —
- Eligible?
- —
Short-term bridge; refi at stabilization.
Rent comps 3 comps
| Address | Beds | Baths | Sqft | Rent | $/sqft | DOM | Units | Dist |
|---|---|---|---|---|---|---|---|---|
| 303 S 5th St Fulton, NY | 4.0 | 1.5 | 1800 | $1,850 | $1.03 | 14d | 1 | 0.30mi |
| 115 W 1st St S Unit 2 Fulton, NY | 2.0 | 1.0 | 1958 | $1,400 | $0.72 | 14d | 1 | 0.59mi |
| 262 W 4th St S Unit 1 Fulton, NY | 3.0 | 1.0 | 1316 | $1,500 | $1.14 | 44d | 1 | 0.86mi |
Listing history 2 events
-
2026-05-30status $50,000 Pending 7 DOM
-
2026-05-22$50,000 Active
ⓘ Source: listings_history table (triggers on properties + properties_extension) + one-shot
backfill from property_details.listing_events for pre-trigger history.
Climate risk First Street
- Flood 1/10 Low FEMA zone X (unshaded) · 0% chance over 30 yrs
- Wildfire 2/10 Low
- Heat 2/10 Low 7 d/yr ≥95°F today · 16 d/yr by 30 yrs out
- Wind 1/10 Low 100% chance of damaging wind over 30 yrs
- Air quality 2/10 Low 1 unhealthy d/yr today · 1 by 30 yrs out
Nearby sold comps map
Loading sold comps map…
Walkable amenities ~0.75 mi
Loading nearby amenities…
Taxation est. · year 1
- Rental income
- $20,115
- − Mortgage interest
- −$2,801
- − Property taxes
- −$750
- − Insurance
- −$250
- − Repairs & maintenance
- −$1,609
- − Management
- −$1,609
- − Depreciation
- −$1,455
- Taxable income
- $11,642
- Est. tax owed @ 24.0%
- −$2,794
- After-tax cash flow
- $8,951/yr
For passive investors: Depreciation is non-cash, so a rental often shows a tax loss while cash-flowing — sheltering income. Rental losses are passive: they offset passive income freely, and up to $25,000/yr can offset ordinary (W-2) income if you actively participate and your MAGI is under $100k (phasing out to $0 by $150k); unused losses carry forward. On sale, claimed depreciation is recaptured at up to 25%, and gains may owe capital-gains tax (a 1031 exchange can defer both). Figures are a year-1 estimate at your 24.0% rate — not tax advice; consult a CPA.
Schools (NCES district)
- District
- Fulton City School District
- NCES district ID
- 3611700
- Math proficiency
- 29% ▼ -11.00%
- Reading proficiency
- 43% ▲ 5.00%
- Median HH income
- $43,337
- Composite
- 30.49/100
- National rank
- #6220
- State rank
- #554 of 590 in NY
Livability — Fulton
- Score
- 61/100
- State rank
- #907
- US rank
- #17723
Category grades
Schools grade is shown separately in the Schools card above.
Census & demographics
- Census place
- Fulton, NY
- Population (ZIP)
- 23,176
Population outlook (Oswego County) Hauer SSP2
- Today (2025)
- 114,465 people
- By 2030
- 109,968 · -3.9%
- By 2040
- 99,205 · -13.3%
- By 2050
- 87,979 · -23.1%
- By 2075
- 65,100 · -43.1%
- By 2100
- 47,117 · -58.8%
Race, ethnicity, and origin ACS 2023
- Neighborhood character
- Predominantly White (93%)
- Race & ethnicity
- White 93% Hispanic / Latino 4% Two or more races 3%
- Common ancestry
- Lithuanian 6% Romanian 6% Iranian 2%
- Foreign-born
- 2% · Canada
- Languages at home
- 96% English-only · Spanish 2% German/W. Germanic 1%
Political lean MEDSL · Oswego
- 2024 margin
- Strong R (+24.2) · D 37.9% · R 62.1%
- 2008→2024 swing
- -26.6pp toward R · 2008: 2.5pp · 2024: -24.2pp
- All cycles
- 2024: R+24.2 2020: R+20.2 2016: R+23.2 2012: D+7.9 2008: D+2.5
Not yet ingested
- Civics
- —
Market trends
- HPI YoY
- ▲ 6.75%
- Current HPI
- 304.443
- Rent YoY
- —
- Metro
- —
- State GDP YoY
- ▲ 2.60%
- F500 in state
- 92
Industry mix (Fortune 500 HQ in NY)
| Industry | F500 HQs | Revenue |
|---|---|---|
| Financial Services | 10 | $950B |
|
||
| Consumer Goods | 9 | $162B |
|
||
| Insurance | 4 | $225B |
|
||
| Telecommunications | 2 | $144B |
|
||
| Pharmaceuticals | 2 | $112B |
|
||
| Media / Entertainment | 2 | $69B |
|
||
Price history
1 event — show timeline
- 2026-05-22 Listed $50,000 CNYIS
Property tax history
+10.0%/yrLatest (2025): $2,690 · +2.4% YoY. Source: county tax records.
Cash-flow waterfall
monthlySold comps — $/sqft
last 12 mo · ≤1 miLoading sold comps…