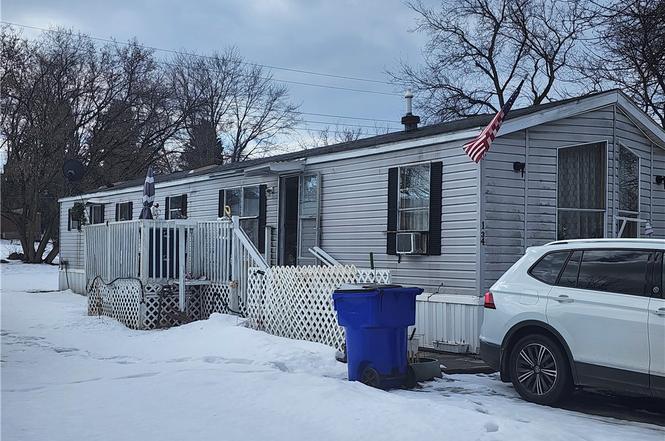
134 Fourth · Jordan, NY
Flood risk 4/10 · Minor
- FEMA flood zone
- X (unshaded)
- Chance of flooding over 30 yrs
- 0.2%
- Est. flood insurance / yr
- $507 – $1,088
Fire risk 1/10 · Minimal
- Est. fire insurance / yr
- $691 – $1,283
Heat risk 2/10 · Minimal
- Hot days now (above 95°F)
- 7 days/yr
- Hot days in 30 yrs
- 15 days/yr
Wind risk 1/10 · Minimal
- Chance of severe wind over 30 yrs
- 1.0%
Air-quality risk 2/10 · Minimal
- Unhealthy air days now
- 0 days/yr
- Unhealthy air days in 30 yrs
- 1 days/yr
Risk factors via First Street. Map © Google.
Why this score? — see what drove the C grade
The composite is a weighted blend of 9 inputs, each scored 0–100. Each bar is that input's sub-score; the figure is the points it added to the 100-point composite (weight × sub-score).
- Cash flow +15.0/30.0
- Appreciation +10.0/10.0
- ARV discount +7.5/15.0
- 1% rule +5.0/10.0
- DSCR +5.0/10.0
- Schools +4.9/10.0
- Livability +3.4/5.0
- Rent growth +2.5/5.0
- Condition / age +2.5/5.0
$16,000
🖨 Deal sheet 📄 Offer letter ✓ Due diligence
Listing remarks
This 2 bedroom could be a nice home with a little work. Comes with stainless steel stove and refrigerator. Has a great deck and 2 car parking.
Key facts
- Great deck
- 2 car parking
- 3,049 sq ft lot
Tags
Property features AI
Finance
- HOA & community: Land lease: $525/month
Exterior
- Parking: No garage
- Utilities: Sewer connected; Public water connected
- Home design: Single-wide mobile home; 1 story; Resale property
- Construction: Vinyl siding; Existing construction
- Exterior features: Blacktop driveway; Rectangular lot; Main thoroughfare frontage
Interior
- Kitchen: Free-standing range; Oven; Refrigerator
- Bedrooms: 2 main-level bedrooms
- Flooring: Carpet; Vinyl; Varies
- Bathrooms: 1 full bathroom; 1 half bathroom; 2 main-level bathrooms
- Heating & cooling: Gas forced-air heating
- Interior features: Eat-in kitchen; Main-level primary bedroom; Primary suite
- Laundry & utility: Laundry on main level; Electric water heater
Neighborhood map
What this means for you Summary
Snapshot
- This is a 2-bed/1.5-bath manufactured listed at $16k.
Deal economics
- At list price, monthly cash flow is $1k ($13k/yr) — positive.
- The deal already cash-flows at list — no discount required.
- Meets the 1% rule at list price ($2k rent vs $16k).
- Recommended offer: $15k (6.0% below list) — sets the bar for market timing.
- Cap rate 89.6% vs local median 1.1% in Jordan — top-decile yield for the area; either an underpriced asset or a hidden risk that comps aren't pricing in. Stress-test before assuming the spread holds.
Location & tenants
- Location reads 67/100 on livability (#581 in NY) — a middle-class / working-renter tenant base. Strengths: cost of living A+, housing A+, crime A-; Watch: amenities F, commute F, health & safety D-.
- Jordan-Elbridge Central School District (rural): math 57% / reading 57% proficiency, ranked #277 of 590 in NY (top 47%) — acceptable for families but not a draw, mixed tenant base, ~2y average lease.
- Market conditions: 16 active listings in the ZIP; 161 units permitted in Cayuga County in 2024 (65 in 5+ unit buildings).
Forward outlook
- In year one you build about $2k of equity ($111 loan paydown + $2k appreciation (10.0% local appreciation)).
- Cayuga County population projected at -18% by 2050 — secular population decline; favor cash flow + early exit over multi-decade hold.
- At projected returns (10.0% appreciation + 3.0% rent growth), your $4k cash investment doubles in ~1 year — after that, you're playing with house money.
Negotiation context
- It's been on market 80 days — a 6% lower offer ($15k) is reasonable based on typical stale-listing flexibility.
Questions for the listing agent
- It's been on market 80 days. Have you received any prior offers? Is the seller open to a 6% concession, seller financing, or rate buy-down credit?
- Why hasn't it sold? Are there any deal-killer items the seller is aware of (foundation, flood, title, zoning, code violations)?
- Is there a deadline driving the sale (1031 exchange, divorce, estate, relocation)? That informs how much negotiation room exists.
- Schools are B-rated — typically a magnet for longer-tenancy family renters. What's the average tenant stay here, and is there a school-zone premium baked into asking?
- What's the average days-on-market for RENTAL listings here right now (not sales)? A rising rental-DOM trend means longer vacancies and softer asking-rent achievability than the comps imply.
- What's the recent tenant-quality profile in this submarket — average credit score on applications, eviction rate, late-payment / NSF rate, and stable-employment percentage? A property-management company in the area should have these aggregated.
- How much new for-sale + rental construction is in the pipeline within 1–3 miles? Heavy new supply typically softens prices + rents 12–24 months out; constrained supply supports both.
Investment metrics
- 1% rule
- 9.66% ✓
- Cap rate
- 89.55%
- Cash-on-cash
- 297.35%
- DSCR
- 14.23
- GRM
- 0.9
CMA / ARV
- ARV (on-the-fly)
- $48,020
- Comps found
- 10
Show comp detail 10 sales within ~0.75 mi
| Address | Dist | Beds/Ba | Sqft | Sold | Price | $/sf | Match |
|---|---|---|---|---|---|---|---|
| 134 Fourth | 0.00mi | 2/1.5 | 980 (0%) | 0mo | $13,000 | $13 | 100 |
| 114 4th Dr | 0.07mi | 3/2.0 (+1) | 980 (0%) | 5mo | $8,500 | $9 | 86 |
| 117 Meadowlark Dr | 0.11mi | 2/2.0 | 1,020 (+4%) | 13mo | $89,500 | $88 | 76 |
| 116 Oakleaf Dr | 0.11mi | 1/1.5 (-1) | 1,056 (+8%) | 3mo | $52,000 | $49 | 75 |
| 210 Henderson Ln | 0.36mi | 3/2.0 (+1) | 980 (0%) | 5mo | $37,500 | $38 | 72 |
| 115 Briarwood Dr | 0.15mi | 2/2.0 | 1,020 (+4%) | 16mo | $97,500 | $96 | 71 |
| 125 Oakleaf Dr | 0.07mi | 2/2.0 | 907 (-7%) | 22mo | $85,995 | $95 | 64 |
| 4 Lower Ln | 0.24mi | 3/2.0 (+1) | 1,080 (+10%) | 12mo | $35,000 | $32 | 55 |
| 118 Oakleaf Dr | 0.11mi | 3/2.0 (+1) | 1,073 (+10%) | 22mo | $49,900 | $47 | 54 |
| 19 Lower Ln | 0.40mi | 3/1.0 (+1) | 1,056 (+8%) | 20mo | $55,000 | $52 | 45 |
Match score weights: distance 35% · size 25% · config 20% · recency 20%. Top-matched comps best support the ARV.
Projected returns pro-forma
10.0% appreciation · 3.0% rent growth · sell at horizon
- IRR
- —
- Equity multiple
- 18.73×
- Total profit
- $79,441
- Equity at exit
- $14,414
- IRR
- —
- Equity multiple
- 40.82×
- Total profit
- $178,387
- Equity at exit
- $31,084
Cash invested: $4,480 (down + closing). Projections, not guarantees.
Landlord ↔ Tenant lean methodology
- Overall (STATE)
- 15 Strongly Tenant-Friendly
- State New York
- 15 Strongly Tenant-Friendly · D+10
- County
- — inherits STATE
- City
- — inherits STATE
ZIP-level market 13166
- Home prices YoY
- 5.8%
- Active inventory
- 16
- Price-to-rent
- 0.9×
Monthly cashflow live
- Estimated rent
- $1,545 medium interval (Pro) →
- Mortgage (P&I)
- −$84
- Tax est. 1.5%
- −$20 /mo · $240/yr
- Insurance
- −$7
- HOA
- −$0
- Vacancy / Maint / Mgmt
- −$324
- Net cashflow
- $1,110
Break-even live
UW: 25.0% down · 7.5% · 30yr · 1.5% tax · 5.0% vac · 8.0% maint · 8.0% mgmt
Financing live
Cash to close
- Down payment
- $4,000
- Closing costs
- $480
- Reserves months
- —
- Total cash needed
- —
Loan-product check · same deal, 3 products live
Conventional
25% down · 7.5% · 30yr
- Down + closing
- —
- Monthly P&I
- —
- Monthly cashflow
- —
- DSCR
- —
- Eligible?
- —
Personal DTI + credit; lowest rate.
DSCR
20% down · 8.5% · 30yr
- Down + closing
- —
- Monthly P&I
- —
- Monthly cashflow
- —
- DSCR
- —
- Eligible?
- —
No personal income docs; deal must DSCR.
Hard money
10% down · 12.0% · 12mo
- Down + closing
- —
- Monthly P&I
- —
- Monthly cashflow
- —
- DSCR
- —
- Eligible?
- —
Short-term bridge; refi at stabilization.
Listing history 3 events
-
2026-05-30status $16,000 Pending 80 DOM
-
2026-04-26price $16,000
-
2026-03-10$18,000 Active
ⓘ Source: listings_history table (triggers on properties + properties_extension) + one-shot
backfill from property_details.listing_events for pre-trigger history.
Climate risk First Street
- Flood 4/10 Moderate FEMA zone X (unshaded) · 20% chance over 30 yrs
- Wildfire 1/10 Low
- Heat 2/10 Low 7 d/yr ≥95°F today · 15 d/yr by 30 yrs out
- Wind 1/10 Low 100% chance of damaging wind over 30 yrs
- Air quality 2/10 Low 0 unhealthy d/yr today · 1 by 30 yrs out
Nearby sold comps map
Loading sold comps map…
Walkable amenities ~0.75 mi
Loading nearby amenities…
Taxation est. · year 1
- Rental income
- $18,542
- − Mortgage interest
- −$896
- − Property taxes
- −$240
- − Insurance
- −$80
- − Repairs & maintenance
- −$1,483
- − Management
- −$1,483
- − Depreciation
- −$465
- Taxable income
- $13,894
- Est. tax owed @ 24.0%
- −$3,334
- After-tax cash flow
- $9,987/yr
For passive investors: Depreciation is non-cash, so a rental often shows a tax loss while cash-flowing — sheltering income. Rental losses are passive: they offset passive income freely, and up to $25,000/yr can offset ordinary (W-2) income if you actively participate and your MAGI is under $100k (phasing out to $0 by $150k); unused losses carry forward. On sale, claimed depreciation is recaptured at up to 25%, and gains may owe capital-gains tax (a 1031 exchange can defer both). Figures are a year-1 estimate at your 24.0% rate — not tax advice; consult a CPA.
Schools (NCES district)
- District
- Jordan-Elbridge Central School District
- NCES district ID
- 3615990
- Math proficiency
- 57% ▲ 4.00%
- Reading proficiency
- 57% ▲ 8.00%
- Median HH income
- $55,408
- Composite
- 49.11/100
- National rank
- #2049
- State rank
- #277 of 590 in NY
Livability — Jordan
- Score
- 67/100
- State rank
- #581
- US rank
- #10506
Category grades
Schools grade is shown separately in the Schools card above.
Census & demographics
- Population (ZIP)
- 5,667
Population outlook (Cayuga County) Hauer SSP2
- Today (2025)
- 74,820 people
- By 2030
- 72,402 · -3.2%
- By 2040
- 66,917 · -10.6%
- By 2050
- 61,007 · -18.5%
- By 2075
- 48,047 · -35.8%
- By 2100
- 34,512 · -53.9%
Race, ethnicity, and origin ACS 2023
- Neighborhood character
- Predominantly White (93%)
- Race & ethnicity
- White 93% Two or more races 6%
- Common ancestry
- Romanian 8% Iranian 5% Lithuanian 3%
- Foreign-born
- 1% · Canada
- Languages at home
- 98% English-only · German/W. Germanic 1%
Political lean MEDSL · Cayuga
- 2024 margin
- R (+13.0) · D 43.5% · R 56.5%
- 2008→2024 swing
- -21.5pp toward R · 2008: 8.5pp · 2024: -13.0pp
- All cycles
- 2024: R+13.0 2020: R+9.2 2016: R+13.2 2012: D+10.8 2008: D+8.5
Not yet ingested
- Civics
- —
Market trends
- HPI YoY
- ▲ 18.93%
- Current HPI
- 347.8499
- Rent YoY
- —
- Metro
- —
- State GDP YoY
- ▲ 2.60%
- F500 in state
- 92
Industry mix (Fortune 500 HQ in NY)
| Industry | F500 HQs | Revenue |
|---|---|---|
| Financial Services | 10 | $950B |
|
||
| Consumer Goods | 9 | $162B |
|
||
| Insurance | 4 | $225B |
|
||
| Telecommunications | 2 | $144B |
|
||
| Pharmaceuticals | 2 | $112B |
|
||
| Media / Entertainment | 2 | $69B |
|
||
Price history
-11.1% since first listed2 events — show timeline
- 2026-04-26 Price Changed $16,000 UNYREIS
- 2026-03-10 Listed $18,000 UNYREIS
Cash-flow waterfall
monthlySold comps — $/sqft
last 12 mo · ≤1 miLoading sold comps…