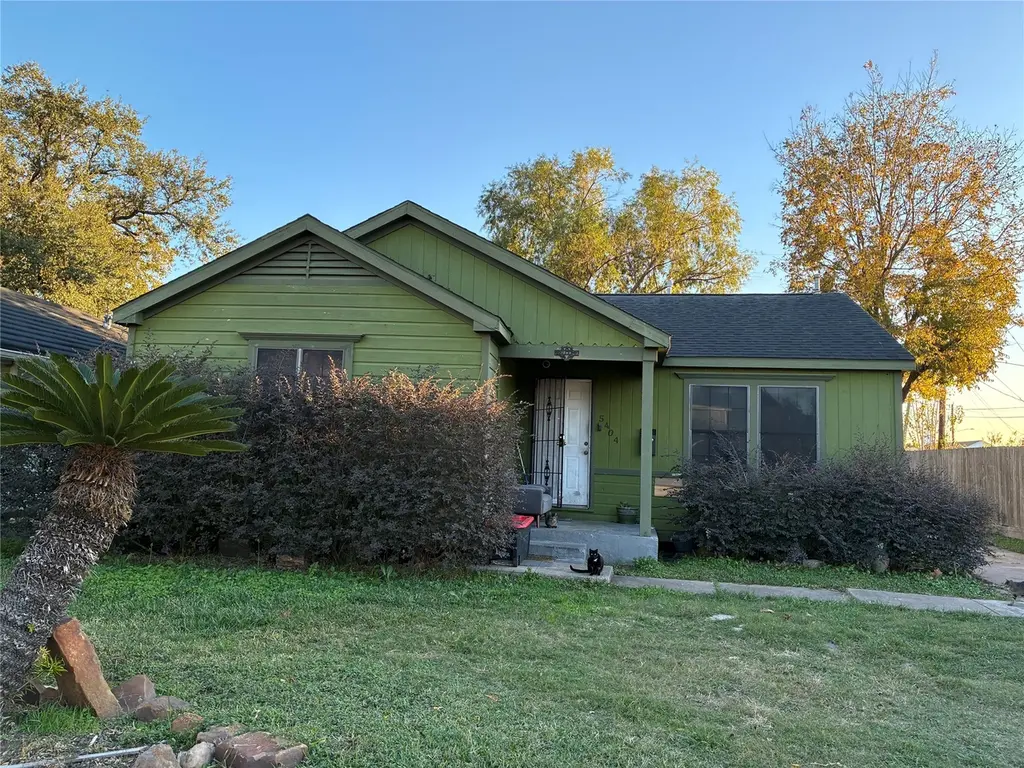
5404 Starling St · Houston, TX
Flood risk 5/10 · Moderate
- FEMA flood zone
- X (shaded)
- Chance of flooding over 30 yrs
- 0.24%
- Est. flood insurance / yr
- $507 – $1,088
Fire risk 1/10 · Minimal
- Est. fire insurance / yr
- $1,222 – $2,270
Heat risk 9/10 · Severe
- Hot days now (above 109°F)
- 7 days/yr
- Hot days in 30 yrs
- 22 days/yr
Wind risk 9/10 · Severe
- Chance of severe wind over 30 yrs
- 99.0%
Air-quality risk 2/10 · Minimal
- Unhealthy air days now
- 2 days/yr
- Unhealthy air days in 30 yrs
- 2 days/yr
Risk factors via First Street. Map © Google.
Why this score? — see what drove the C+ grade
The composite is a weighted blend of 9 inputs, each scored 0–100. Each bar is that input's sub-score; the figure is the points it added to the 100-point composite (weight × sub-score).
- Cash flow +23.0/30.0
- ARV discount +15.0/15.0
- DSCR +7.4/10.0
- 1% rule +6.6/10.0
- Livability +3.7/5.0
- Rent growth +2.7/5.0
- Schools +2.7/10.0
- Condition / age +2.5/5.0
- Appreciation +0.0/10.0
$130,000
🖨 Deal sheet (PDF) 📄 Offer letter ✓ Due diligence
Listing remarks MLS
Great home to add to your portfolio! This 3-bedroom, 1-bath home offers a great opportunity for buyers looking to add their own touch or an investor looking for their next project. This property provides a solid starting point for renovations and updates. With its functional layout and spacious bedrooms, this home has plenty of potential to be transformed into a comfortable residence or investment property. While it does need work, the possibilities are endless for those with vision. Don’t miss the chance to make this property your own! Schedule your showing today!
Key facts
- 6,324 sq ft lot
- Built 1940
- Listed 27 days
Neighborhood map
What this means for you Summary
Snapshot
- This is a 3-bed/1.0-bath single-family listed at $130k.
Deal economics
- At list price, monthly cash flow is $231 ($3k/yr) — positive.
- The deal already cash-flows at list — no discount required.
- Meets the 1% rule at list price ($2k rent vs $130k).
- Recommended offer: $128k (1.5% below list) — sets the bar for market timing.
- Cap rate 8.4% vs local median 3.2% in Houston — top-decile yield for the area; either an underpriced asset or a hidden risk that comps aren't pricing in. Stress-test before assuming the spread holds.
Location & tenants
- Location reads 74/100 on livability (#184 in TX, #4,771 nationally) — a middle-class / working-renter tenant base. Strengths: amenities A+, cost of living A+, housing A+; Watch: crime F.
- Houston ISD (urban): math 27% / reading 35% proficiency, ranked #593 of 826 in TX (top 72%) — families likely to look elsewhere, expect single-tenant / working-renter base with shorter leases; 71% free/reduced lunch — lower-income household profile, screen leases tightly.
- Zoned schools: Patterson El (math 28% / reading 37%, grade F, #2,234 of 4,322 statewide, top 52%, 921 students, 95% FRL); Stevenson Middle (math 22% / reading 35%, grade F, #1,122 of 1,662 statewide, top 69%, 1,192 students, 92% FRL); Chavez H S (math 26% / reading 26%, grade F, #1,234 of 1,632 statewide, top 76%, 2,272 students, 93% FRL) — zoned schools average 94% FRL vs 71% district-wide (22 pts higher); higher-poverty schools than district average — tighter screening recommended.
- Market conditions: Rents flat; 88 active listings in the ZIP; 13 comparable units currently listed for rent nearby; rentals leasing fast (median 13d on market — plan ~1-2 weeks tenant-placement turnaround); 29,883 units permitted in Harris County in 2024 (8,621 in 5+ unit buildings).
- This rent runs 36% of the median local income ($51k/yr) — at the standard rent-burdened threshold; future hikes will face affordability resistance.
Forward outlook
- Local home prices are declining (-3.0%/yr); year-one equity from $899 of loan paydown is wiped out by about $4k of value loss. Plan a longer hold.
- Harris County population projected at +47% by 2050 — long-run rental-demand tailwind backs the buy-and-hold thesis.
Negotiation context
- It's been on market 27 days — a 2% lower offer ($128k) is reasonable based on typical stale-listing flexibility.
- 3 sale attempts since 12y ago with the ask held roughly flat each time — persistent listings suggest the price (not the market) is what's stuck; bring a comps-based counter.
- Current owner paid $30k; list at $130k implies a 341% gain — meaningful room to come down on a strong offer.
Risks & watch-outs
- Watch-outs: built in 1940 — expect roof / HVAC / electrical / plumbing capex.
- Climate carrying-cost: moderate flood risk; severe wind risk, 99% chance of damaging wind over 30y; extreme-heat days projected 7→22/yr by 2055 (HVAC capex compounding) — expect insurance premiums to compound above CPI over the hold.
Questions for the listing agent
- Built in 1940 — when were the roof, HVAC, electrical panel, plumbing, and water heater last replaced?
- Is there a deadline driving the sale (1031 exchange, divorce, estate, relocation)? That informs how much negotiation room exists.
- Schools are D-rated, which usually means shorter tenancies and higher turnover. Who's the typical renter profile here, and what's been the actual vacancy rate?
- Crime grade is F in this area — have there been break-ins, vandalism, or insurance claims at this property in the last 3 years? What carrier currently insures it and at what premium?
- What's the average days-on-market for RENTAL listings here right now (not sales)? A rising rental-DOM trend means longer vacancies and softer asking-rent achievability than the comps imply.
- What's the recent tenant-quality profile in this submarket — average credit score on applications, eviction rate, late-payment / NSF rate, and stable-employment percentage? A property-management company in the area should have these aggregated.
- How much new for-sale + rental construction is in the pipeline within 1–3 miles? Heavy new supply typically softens prices + rents 12–24 months out; constrained supply supports both.
Investment metrics
- 1% rule
- 1.16% ✓
- Cap rate
- 8.42%
- Cash-on-cash
- 7.60%
- DSCR
- 1.34
- GRM
- 7.2
CMA / ARV
- ARV (median comp)
- $190,159
- List price
- $130,000
- Delta
- -31.64%
- Verdict
- UNDERPRICED
- Comps
- 20 within 1.0 mi
Show comp detail 12 sales within ~0.75 mi
| Address | Dist | Beds/Ba | Sqft | Sold | Price | $/sf | Match |
|---|---|---|---|---|---|---|---|
| 5403 Primrose St | 0.19mi | 4/1.0 (+1) | 1,269 (-1%) | 6mo | $190,000 | $150 | 80 |
| 919 Oak Meadows St | 0.49mi | 3/1.0 | 1,218 (-5%) | 0mo | $195,500 | $161 | 69 |
| 1308 Pecan Dr | 0.58mi | 3/1.0 | 1,256 (-2%) | 2mo | $120,000 | $96 | 68 |
| 1703 Seagull St | 0.42mi | 3/2.0 | 1,260 (-2%) | 10mo | $229,900 | $182 | 66 |
| 1106 Aubert St | 0.52mi | 3/2.0 | 1,290 (+1%) | 6mo | $215,000 | $167 | 65 |
| 10 Pine Creek Ct | 0.58mi | 3/2.0 | 1,225 (-4%) | 5mo | $227,500 | $186 | 58 |
| 5510 Meadow Creek Ln | 0.40mi | 3/1.5 | 1,422 (+11%) | 8mo | $165,000 | $116 | 54 |
| 1114 Maroby St | 0.67mi | 3/1.0 | 1,200 (-6%) | 7mo | $215,000 | $179 | 53 |
| 5551 Winding Creek Way | 0.40mi | 2/2.0 (-1) | 1,463 (+14%) | 2mo | $129,900 | $89 | 47 |
| 806 Evonne St | 0.46mi | 3/1.0 | 1,463 (+14%) | 10mo | $195,000 | $133 | 46 |
| 4921 Michael Dr | 0.70mi | 3/1.0 | 1,140 (-11%) | 8mo | $179,900 | $158 | 42 |
| 1508 Hemlock Dr | 0.59mi | 4/2.0 (+1) | 1,468 (+15%) | 5mo | $229,900 | $157 | 34 |
Match score weights: distance 35% · size 25% · config 20% · recency 20%. Top-matched comps best support the ARV.
Projected returns pro-forma
-3.0% appreciation · 0.88% rent growth · sell at horizon
- IRR
- -7.2%
- Equity multiple
- 0.74×
- Total profit
- $-9,474
- Equity at exit
- $19,383
- IRR
- -0.7%
- Equity multiple
- 0.96×
- Total profit
- $-1,509
- Equity at exit
- $11,240
Cash invested: $36,400 (down + closing). Projections, not guarantees.
Landlord ↔ Tenant lean methodology
- Overall (STATE)
- 87 Strongly Landlord-Friendly
- State Texas
- 87 Strongly Landlord-Friendly · R+5
- County
- — inherits STATE
- City
- — inherits STATE
ZIP-level market 77017
- Home prices YoY
- -21.7%
- Rents YoY
- 0.9%
- Active inventory
- 88
- Price-to-rent
- 7.2×
Monthly cashflow live
- Estimated rent
- $1,513 high interval (Pro) →
- Mortgage (P&I)
- −$682
- Tax from tax record
- −$229 /mo · $2,748/yr
- Insurance
- −$54
- HOA
- −$0
- Vacancy / Maint / Mgmt
- −$318
- Net cashflow
- $231
Break-even live
Sensitivity live
| Price | -10% $304 | -5% $267 | +0% $231 | +5% $194 | +10% $157 |
|---|---|---|---|---|---|
| Rent | -10% $111 | -5% $171 | +0% $231 | +5% $290 | +10% $350 |
| Rate | -1.0pp $296 | -0.5pp $264 | base $231 | +0.5pp $197 | +1.0pp $163 |
UW: 25.0% down · 7.5% · 30yr · 1.5% tax · 5.0% vac · 8.0% maint · 8.0% mgmt
Financing live
Cash to close
- Down payment
- $32,500
- Closing costs
- $3,900
- Reserves months
- —
- Total cash needed
- —
Loan-product check · same deal, 3 products live
Conventional
25% down · 7.5% · 30yr
- Down + closing
- —
- Monthly P&I
- —
- Monthly cashflow
- —
- DSCR
- —
- Eligible?
- —
Personal DTI + credit; lowest rate.
DSCR
20% down · 8.5% · 30yr
- Down + closing
- —
- Monthly P&I
- —
- Monthly cashflow
- —
- DSCR
- —
- Eligible?
- —
No personal income docs; deal must DSCR.
Hard money
10% down · 12.0% · 12mo
- Down + closing
- —
- Monthly P&I
- —
- Monthly cashflow
- —
- DSCR
- —
- Eligible?
- —
Short-term bridge; refi at stabilization.
Rent comps 13 comps
| Address | Beds | Baths | Sqft | Rent | $/sqft | DOM | Units | Dist |
|---|---|---|---|---|---|---|---|---|
| 1514 Allen Genoa Rd Houston, TX | 1.0–2.0 | 1.0–2.0 | 846 | $1,715 | $2.03 | 3d | 24 | 0.41mi |
| 4800 Allendale Rd Unit 2165 Houston, TX | 2.0 | 2.0 | 1322 | $1,333 | $1.01 | 0d | 1 | 0.66mi |
| 4800 Allendale Rd Unit 4857 Houston, TX | 2.0 | 2.0 | 1322 | $1,373 | $1.04 | 12d | 1 | 0.66mi |
| 4800 Allendale Rd Unit 2162 Houston, TX | 2.0 | 2.0 | 1322 | $1,349 | $1.02 | 6d | 1 | 0.66mi |
| 4800 Allendale Rd Unit 425 Houston, TX | 2.0 | 2.0 | 1322 | $1,349 | $1.02 | 9d | 1 | 0.66mi |
| 4921 Barkley St Houston, TX | 3.0 | 2.0 | 1502 | $1,900 | $1.26 | 21d | 1 | 0.67mi |
| 4800 Allendale Rd Unit 2047 Houston, TX | 2.0 | 2.0 | 1322 | $1,384 | $1.05 | 12d | 1 | 0.67mi |
| 5535 Timber Creek Place Dr Houston, TX | 1.0–2.0 | 1.0–2.0 | 757 | $1,214 | $1.60 | 4d | 18 | 0.74mi |
| 4806 Allendale Rd Houston, TX | 2.0 | 2.0 | 1322 | $1,152 | $0.87 | 45d | 1 | 0.76mi |
| 2810 Forest Oaks Blvd Houston, TX | 4.0 | 2.0 | 1280 | $1,675 | $1.31 | 46d | 1 | 0.95mi |
| 4206 E Villa St Houston, TX | 3.0 | 1.0 | 1190 | $1,845 | $1.55 | 15d | 1 | 1.24mi |
| 6043 Bonn Echo Ln Houston, TX | 2.0 | 2.0 | 900 | $1,165 | $1.29 | 45d | 1 | 1.28mi |
| 1009 Richey St Pasadena, TX | 1.0–3.0 | 1.0–2.0 | 885 | $1,499 | $1.69 | 0d | 24 | 1.43mi |
Listing history 13 events
-
2026-05-13status Pending 578-char remark
Show marketing remark (578 chars)
Great home to add to your portfolio! This 3-bedroom, 1-bath home offers a great opportunity for buyers looking to add their own touch or an investor looking for their next project. This property provides a solid starting point for renovations and updates. With its functional layout and spacious bedrooms, this home has plenty of potential to be transformed into a comfortable residence or investment property. While it does need work, the possibilities are endless for those with vision. Don’t miss the chance to make this property your own! Schedule your showing today!
-
2026-04-16$130,000 Active 578-char remark
Show marketing remark (578 chars)
Great home to add to your portfolio! This 3-bedroom, 1-bath home offers a great opportunity for buyers looking to add their own touch or an investor looking for their next project. This property provides a solid starting point for renovations and updates. With its functional layout and spacious bedrooms, this home has plenty of potential to be transformed into a comfortable residence or investment property. While it does need work, the possibilities are endless for those with vision. Don’t miss the chance to make this property your own! Schedule your showing today!
-
2026-04-07status Pending
-
2026-04-07historical
-
2025-12-18$140,000 Active
-
2015-04-07soldstatus
-
2014-12-10historical
-
2014-12-09soldstatus
-
2014-12-03price $59,900
-
2014-11-26soldstatus Sold
-
2014-10-25$54,900 Active
-
1997-08-22soldstatus
-
1989-12-01soldstatus $29,500
ⓘ Source: listings_history table (triggers on properties + properties_extension) + one-shot
backfill from property_details.listing_events for pre-trigger history.
Tax reassessment forecast TX · Resets to sale price
- Current annual tax
- $2,748 · $229/mo
- Projected year-2 tax
- $2,748 · $229/mo
- Expected delta
- $0/yr ($0/mo · 0.0%)
ⓘ Screening estimate from a state-policy table — verify with the county assessor before closing.
Climate risk First Street
- Flood 5/10 Major FEMA zone X (shaded) · 24% chance over 30 yrs
- Wildfire 1/10 Low
- Heat 9/10 Extreme 7 d/yr ≥109°F today · 22 d/yr by 30 yrs out
- Wind 9/10 Extreme 99% chance of damaging wind over 30 yrs
- Air quality 2/10 Low 2 unhealthy d/yr today · 2 by 30 yrs out
Nearby sold comps map
Loading sold comps map…
Walkable amenities ~0.75 mi
Loading nearby amenities…
Taxation est. · year 1
- Rental income
- $18,160
- − Mortgage interest
- −$7,282
- − Property taxes
- −$2,748
- − Insurance
- −$650
- − Repairs & maintenance
- −$1,453
- − Management
- −$1,453
- − Depreciation
- −$3,782
- Taxable income
- $793
- Est. tax owed @ 24.0%
- −$190
- After-tax cash flow
- $2,577/yr
For passive investors: Depreciation is non-cash, so a rental often shows a tax loss while cash-flowing — sheltering income. Rental losses are passive: they offset passive income freely, and up to $25,000/yr can offset ordinary (W-2) income if you actively participate and your MAGI is under $100k (phasing out to $0 by $150k); unused losses carry forward. On sale, claimed depreciation is recaptured at up to 25%, and gains may owe capital-gains tax (a 1031 exchange can defer both). Figures are a year-1 estimate at your 24.0% rate — not tax advice; consult a CPA.
Schools (NCES district)
- District
- Houston ISD
- NCES district ID
- 4823640
- Math proficiency
- 27% ▼ -18.00%
- Reading proficiency
- 35% ▼ -6.00%
- Median HH income
- $46,054
- Composite
- 26.63/100
- National rank
- #7173
- State rank
- #593 of 826 in TX
Livability — Houston
- Score
- 74/100
- State rank
- #184
- US rank
- #4771
Category grades
Schools grade is shown separately in the Schools card above.
Census & demographics
- Census place
- Houston, TX
- County
- Harris County · 4,702,590 people
- City population
- 3,226,434
- Metro
- Houston-The Woodlands-Sugar Land, TX
- Population (ZIP)
- 29,640
- Household income
- $51,079
- Rent vs Own
- Severe rent burden
- 1601.0
Population outlook (Harris County) Hauer SSP2
- Today (2025)
- 5,571,493 people
- By 2030
- 6,089,821 · +9.3%
- By 2040
- 7,142,806 · +28.2%
- By 2050
- 8,185,864 · +46.9%
- By 2075
- 10,574,329 · +89.8%
- By 2100
- 12,109,958 · +117.4%
Race, ethnicity, and origin ACS 2023
- Neighborhood character
- Predominantly Hispanic (81%)
- Race & ethnicity
- Hispanic / Latino 81% Two or more races 38% White 7% Black 6% Asian 4%
- Hispanic origin (detail)
- Mexican 65%
- Common ancestry
- Lithuanian 1%
- Foreign-born
- 39% · Canada, Vietnam
- Languages at home
- 32% English-only · Spanish 63% Vietnamese 4%
Political lean MEDSL · Harris
- 2024 margin
- Lean D (+5.5) · D 52.0% · R 46.4% · Other 1.6%
- 2008→2024 swing
- +3.9pp toward D · 2008: 1.6pp · 2024: 5.5pp
- All cycles
- 2024: D+5.5 2020: D+13.3 2016: D+12.4 2012: D+0.1 2008: D+1.6
Not yet ingested
- Civics
- —
Market trends
- HPI YoY
- ▼ -76.86%
- Current HPI
- 277.3656
- Rent YoY
- ▲ 0.88%
- Metro
- Houston-The Woodlands-Sugar Land, TX
- State GDP YoY
- ▲ 3.95%
- F500 in state
- 110
Industry mix (Fortune 500 HQ in TX)
| Industry | F500 HQs | Revenue |
|---|---|---|
| Energy | 16 | $1,198B |
|
||
| Technology | 5 | $198B |
|
||
| Engineering / Construction | 4 | $72B |
|
||
| Energy Services | 3 | $60B |
|
||
| Utilities | 3 | $41B |
|
||
| Healthcare | 2 | $330B |
|
||
Price history
+340.7% since first listed13 events — show timeline
- 2026-05-13 Pending — HARMLS
- 2026-04-16 Listed $130,000 HARMLS
- 2026-04-07 Pending — HARMLS
- 2026-04-07 Listing Removed — HARMLS
- 2025-12-18 Listed $140,000 HARMLS
- 2015-04-07 Sold (Public Records) — Public Records
- 2014-12-10 Listing Removed — HARMLS
- 2014-12-09 Sold (Public Records) — Public Records
- 2014-12-03 Price Changed $59,900 HARMLS
- 2014-11-26 Sold (MLS) — HARMLS
- 2014-10-25 Listed $54,900 HARMLS
- 1997-08-22 Sold (Public Records) — Public Records
- 1989-12-01 Sold (Public Records) $29,500 Public Records
Property tax history
+5.0%/yrLatest (2025): $2,748 · +11.7% YoY. Source: county tax records.
Cash-flow waterfall
monthlySold comps — $/sqft
last 12 mo · ≤1 miLoading sold comps…