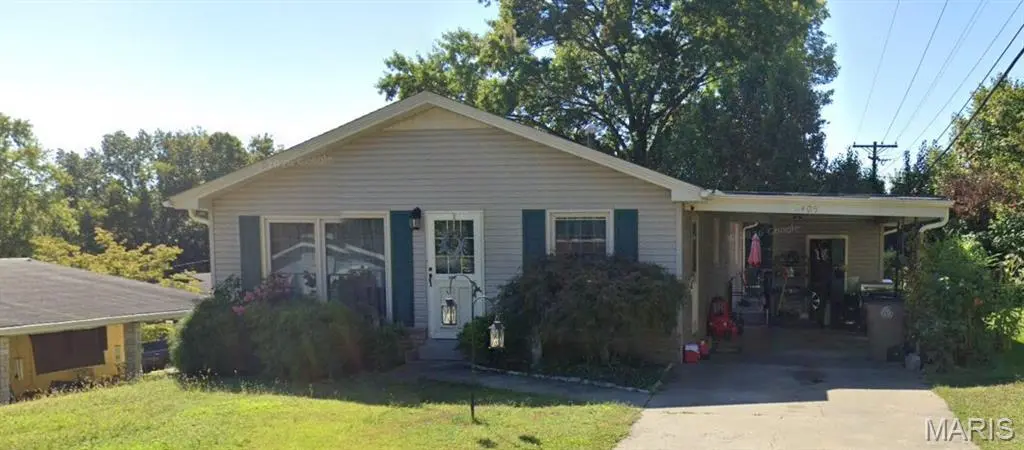
2405 Lynnwood Dr · Cape Girardeau, MO
Flood risk 1/10 · Minimal
- FEMA flood zone
- X (unshaded)
- Chance of flooding over 30 yrs
- 0.0%
- Est. flood insurance / yr
- $473 – $860
Fire risk 1/10 · Minimal
- Est. fire insurance / yr
- $1,054 – $1,958
Heat risk 5/10 · Moderate
- Hot days now (above 108°F)
- 7 days/yr
- Hot days in 30 yrs
- 20 days/yr
Wind risk 2/10 · Minimal
- Chance of severe wind over 30 yrs
- 3.0%
Air-quality risk 2/10 · Minimal
- Unhealthy air days now
- 1 days/yr
- Unhealthy air days in 30 yrs
- 2 days/yr
Risk factors via First Street. Map © Google.
Why this score? — see what drove the B- grade
The composite is a weighted blend of 9 inputs, each scored 0–100. Each bar is that input's sub-score; the figure is the points it added to the 100-point composite (weight × sub-score).
- Cash flow +26.8/30.0
- ARV discount +15.0/15.0
- DSCR +9.2/10.0
- 1% rule +6.4/10.0
- Rent growth +3.3/5.0
- Livability +3.2/5.0
- Schools +3.1/10.0
- Condition / age +2.5/5.0
- Appreciation +0.0/10.0
$140,000
🖨 Deal sheet 📄 Offer letter ✓ Due diligence
Listing remarks
Cute home in Schrader school district with large kitchen on main and a large deck for outside entertaining. Walk out basement has great living area and all the windows provide lots of natural light.
Key facts
- 6,490 sq ft lot
- Parking
- Built 1962
Property features AI
Exterior
- Parking: Carport (1 space)
- Utilities: Public water; Public sewer; Electricity connected (Ameren)
- Home design: Single-family residence; One level
- Construction: Vinyl siding
- Exterior features: Back yard
Interior
- Bedrooms: 3 bedrooms (all on the main level)
- Bathrooms: 2 full bathrooms
- Heating & cooling: Forced air heating; Central air conditioning
- Interior features: Basement with walk-out access; Fireplace in basement
Neighborhood map
What this means for you Summary
Snapshot
- This is a 3-bed/2.0-bath single-family listed at $140k.
Deal economics
- At list price, monthly cash flow is $385 ($5k/yr) — positive.
- The deal already cash-flows at list — no discount required.
- Meets the 1% rule at list price ($2k rent vs $140k).
- Cap rate 9.6% vs local median 3.9% in Cape Girardeau — top-decile yield for the area; either an underpriced asset or a hidden risk that comps aren't pricing in. Stress-test before assuming the spread holds.
Location & tenants
- Location reads 64/100 on livability (#297 in MO) — a middle-class / working-renter tenant base. Strengths: cost of living A+, housing A+; Watch: employment D+, crime F, amenities F.
- Cape Girardeau 63 (urban): math 33% / reading 42% proficiency, ranked #188 of 324 in MO (top 58%) — families likely to look elsewhere, expect single-tenant / working-renter base with shorter leases; 60% free/reduced lunch — lower-income household profile, screen leases tightly.
- Zoned schools: Alma Schrader Elem. (math 42% / reading 57%, grade D, #284 of 1,115 statewide, top 30%, 351 students, 0% FRL); Central High (math 36% / reading 47%, grade F, #234 of 521 statewide, top 45%, 1,341 students, 0% FRL) — zoned schools average 0% FRL vs 60% district-wide (60 pts lower); this property's tenant base skews higher-income than the district average.
- Market conditions: Rents rising (+3.3%/yr); 326 active listings in the ZIP; 1 comparable units currently listed for rent nearby; 81 units permitted in Cape Girardeau County in 2024 (0 in 5+ unit buildings).
Forward outlook
- Local home prices are declining (-3.0%/yr); year-one equity from $968 of loan paydown is wiped out by about $4k of value loss. Plan a longer hold.
- Cape Girardeau County population projected at +17% by 2050 — long-run rental-demand tailwind backs the buy-and-hold thesis.
- At projected returns (-3.0% appreciation + 3.3% rent growth), your $39k cash investment doubles in ~10 years — after that, you're playing with house money.
Negotiation context
- Only 1 days on market — expect competitive offers; lowballing is unlikely to land.
Risks & watch-outs
- Climate carrying-cost: extreme-heat days projected 7→20/yr by 2055 (HVAC capex compounding) — expect insurance premiums to compound above CPI over the hold.
Questions for the listing agent
- Built in 1962 — when were the roof, HVAC, electrical panel, plumbing, and water heater last replaced?
- Is there a deadline driving the sale (1031 exchange, divorce, estate, relocation)? That informs how much negotiation room exists.
- Crime grade is F in this area — have there been break-ins, vandalism, or insurance claims at this property in the last 3 years? What carrier currently insures it and at what premium?
- What's the average days-on-market for RENTAL listings here right now (not sales)? A rising rental-DOM trend means longer vacancies and softer asking-rent achievability than the comps imply.
- What's the recent tenant-quality profile in this submarket — average credit score on applications, eviction rate, late-payment / NSF rate, and stable-employment percentage? A property-management company in the area should have these aggregated.
- How much new for-sale + rental construction is in the pipeline within 1–3 miles? Heavy new supply typically softens prices + rents 12–24 months out; constrained supply supports both.
Investment metrics
- 1% rule
- 1.14% ✓
- Cap rate
- 9.60%
- Cash-on-cash
- 11.79%
- DSCR
- 1.52
- GRM
- 7.3
CMA / ARV
- ARV (on-the-fly)
- $214,326
- Comps found
- 12
Show comp detail 12 sales within ~0.75 mi
| Address | Dist | Beds/Ba | Sqft | Sold | Price | $/sf | Match |
|---|---|---|---|---|---|---|---|
| 1426 N Clark Ave | 0.57mi | 3/2.0 | 1,704 (+0%) | 0mo | $224,900 | $132 | 73 |
| 2525 Albert Rasche Dr | 0.23mi | 3/1.5 | 1,846 (+8%) | 2mo | $265,000 | $144 | 72 |
| 1465 David St | 0.38mi | 3/2.5 | 1,776 (+4%) | 2mo | $200,000 | $113 | 72 |
| 1925 Randol Dr | 0.36mi | 3/2.0 | 1,550 (-9%) | 0mo | $355,000 | $229 | 68 |
| 2313 Hillbrook Dr | 0.16mi | 3/2.0 | 1,956 (+15%) | 6mo | $219,900 | $112 | 62 |
| 1157 Landgraf Dr | 0.66mi | 3/1.5 | 1,746 (+3%) | 1mo | $219,500 | $126 | 62 |
| 1516 E Riverside Dr | 0.51mi | 3/2.0 | 1,822 (+7%) | 3mo | $230,000 | $126 | 62 |
| 1623 Lexington Ave | 0.57mi | 3/2.0 | 1,590 (-6%) | 6mo | $279,900 | $176 | 58 |
| 1601 Clark Ave | 0.49mi | 3/2.0 | 1,900 (+12%) | 5mo | $205,000 | $108 | 54 |
| 2224 Lombardo St | 0.64mi | 2/2.0 (-1) | 1,814 (+7%) | 1mo | $209,900 | $116 | 53 |
| 2512 Ford Dr | 0.57mi | 3/2.0 | 1,930 (+14%) | 2mo | $235,000 | $122 | 49 |
| 1508 Kingsbury Dr | 0.57mi | 2/1.0 (-1) | 1,910 (+12%) | 2mo | $189,900 | $99 | 42 |
Match score weights: distance 35% · size 25% · config 20% · recency 20%. Top-matched comps best support the ARV.
Projected returns pro-forma
-3.0% appreciation · 3.27% rent growth · sell at horizon
- IRR
- 1.5%
- Equity multiple
- 1.06×
- Total profit
- $2,254
- Equity at exit
- $20,874
- IRR
- 11.3%
- Equity multiple
- 1.90×
- Total profit
- $35,227
- Equity at exit
- $12,105
Cash invested: $39,200 (down + closing). Projections, not guarantees.
Landlord ↔ Tenant lean methodology
- Overall (STATE)
- 81 Strongly Landlord-Friendly
- State Missouri
- 81 Strongly Landlord-Friendly · R+10
- County
- — inherits STATE
- City
- — inherits STATE
ZIP-level market 63701
- Rents YoY
- 3.3%
- Active inventory
- 326
- Price-to-rent
- 7.3×
Monthly cashflow live
- Estimated rent
- $1,598 medium interval (Pro) →
- Mortgage (P&I)
- −$734
- Tax from tax record
- −$85 /mo · $1,018/yr
- Insurance
- −$58
- HOA
- −$0
- Vacancy / Maint / Mgmt
- −$336
- Net cashflow
- $385
Break-even live
UW: 25.0% down · 7.5% · 30yr · 1.5% tax · 5.0% vac · 8.0% maint · 8.0% mgmt
Financing live
Cash to close
- Down payment
- $35,000
- Closing costs
- $4,200
- Reserves months
- —
- Total cash needed
- —
Loan-product check · same deal, 3 products live
Conventional
25% down · 7.5% · 30yr
- Down + closing
- —
- Monthly P&I
- —
- Monthly cashflow
- —
- DSCR
- —
- Eligible?
- —
Personal DTI + credit; lowest rate.
DSCR
20% down · 8.5% · 30yr
- Down + closing
- —
- Monthly P&I
- —
- Monthly cashflow
- —
- DSCR
- —
- Eligible?
- —
No personal income docs; deal must DSCR.
Hard money
10% down · 12.0% · 12mo
- Down + closing
- —
- Monthly P&I
- —
- Monthly cashflow
- —
- DSCR
- —
- Eligible?
- —
Short-term bridge; refi at stabilization.
Rent comps 1 comps
| Address | Beds | Baths | Sqft | Rent | $/sqft | DOM | Units | Dist |
|---|---|---|---|---|---|---|---|---|
| 2581 Fairlane Dr Cape Girardeau, MO | 4.0 | 2.0 | 2223 | $2,250 | $1.01 | 43d | 1 | 0.58mi |
Listing history 2 events
-
2026-05-14status Pending
-
2026-05-14$140,000 Active
ⓘ Source: listings_history table (triggers on properties + properties_extension) + one-shot
backfill from property_details.listing_events for pre-trigger history.
Tax reassessment forecast MO · Resets to sale price
- Current annual tax
- $1,018 · $85/mo
- Projected year-2 tax
- $1,358 · $113/mo
- Expected delta
- +$340/yr (+$28/mo · 33.3%)
ⓘ Screening estimate from a state-policy table — verify with the county assessor before closing.
Climate risk First Street
- Flood 1/10 Low FEMA zone X (unshaded) · 0% chance over 30 yrs
- Wildfire 1/10 Low
- Heat 5/10 Major 7 d/yr ≥108°F today · 20 d/yr by 30 yrs out
- Wind 2/10 Low 3% chance of damaging wind over 30 yrs
- Air quality 2/10 Low 1 unhealthy d/yr today · 2 by 30 yrs out
Nearby sold comps map
Loading sold comps map…
Walkable amenities ~0.75 mi
Loading nearby amenities…
Taxation est. · year 1
- Rental income
- $19,179
- − Mortgage interest
- −$7,842
- − Property taxes
- −$1,018
- − Insurance
- −$700
- − Repairs & maintenance
- −$1,534
- − Management
- −$1,534
- − Depreciation
- −$4,073
- Taxable income
- $2,477
- Est. tax owed @ 24.0%
- −$595
- After-tax cash flow
- $4,028/yr
For passive investors: Depreciation is non-cash, so a rental often shows a tax loss while cash-flowing — sheltering income. Rental losses are passive: they offset passive income freely, and up to $25,000/yr can offset ordinary (W-2) income if you actively participate and your MAGI is under $100k (phasing out to $0 by $150k); unused losses carry forward. On sale, claimed depreciation is recaptured at up to 25%, and gains may owe capital-gains tax (a 1031 exchange can defer both). Figures are a year-1 estimate at your 24.0% rate — not tax advice; consult a CPA.
Schools (NCES district)
- District
- Cape Girardeau 63
- NCES district ID
- 2907120
- Math proficiency
- 33% ▼ -6.00%
- Reading proficiency
- 42% ▼ -7.00%
- Median HH income
- $40,543
- Composite
- 31.49/100
- National rank
- #5974
- State rank
- #188 of 324 in MO
Livability — Cape Girardeau
- Score
- 64/100
- State rank
- #297
- US rank
- #13759
Category grades
Schools grade is shown separately in the Schools card above.
Census & demographics
- Census place
- Cape Girardeau, MO
- County
- Cape Girardeau County · 75,175 people
- City population
- 47,546
- Metro
- Cape Girardeau, MO-IL
- Population (ZIP)
- 39,345
- Household income
- $66,654
- Rent vs Own
- Severe rent burden
- 1300.0
Population outlook (Cape Girardeau County) Hauer SSP2
- Today (2025)
- 84,807 people
- By 2030
- 88,016 · +3.8%
- By 2040
- 93,914 · +10.7%
- By 2050
- 99,541 · +17.4%
- By 2075
- 114,527 · +35.0%
- By 2100
- 121,718 · +43.5%
Race, ethnicity, and origin ACS 2023
- Neighborhood character
- Predominantly White (79%)
- Race & ethnicity
- White 79% Black 12% Two or more races 4% Hispanic / Latino 3% Asian 3%
- Common ancestry
- Italian 2% Slovak 2% Lithuanian 2%
- Foreign-born
- 3% · China, Canada
- Languages at home
- 95% English-only · Spanish 1% Other Indo-European 1% Other Asian/Pacific 1%
Political lean MEDSL · Cape Girardeau
- 2024 margin
- Solid R (+46.5) · D 26.2% · R 72.7% · Other 1.1%
- 2008→2024 swing
- -12.9pp toward R · 2008: -33.6pp · 2024: -46.5pp
- All cycles
- 2024: R+46.5 2020: R+45.0 2016: R+50.1 2012: R+43.8 2008: R+33.6
Not yet ingested
- Civics
- —
Market trends
- HPI YoY
- ▼ -177.04%
- Current HPI
- 156.0433
- Rent YoY
- ▲ 3.27%
- Metro
- Cape Girardeau, MO-IL
- State GDP YoY
- ▲ 1.84%
- F500 in state
- 20
Industry mix (Fortune 500 HQ in MO)
| Industry | F500 HQs | Revenue |
|---|---|---|
| Healthcare | 1 | $163B |
|
||
| Insurance | 1 | $21B |
|
||
| Industrial Technology | 1 | $17B |
|
||
| Retail | 1 | $16B |
|
||
| Industrial Distribution | 1 | $10B |
|
||
| Utilities | 1 | $9B |
|
||
Price history
2 events — show timeline
- 2026-05-14 Pending — MARIS as Distributed by MLS Grid
- 2026-05-14 Listed $140,000 MARIS as Distributed by MLS Grid
Property tax history
+1.8%/yrLatest (2025): $1,018 · +5.4% YoY. Source: county tax records.
Cash-flow waterfall
monthlySold comps — $/sqft
last 12 mo · ≤1 miLoading sold comps…