 Triplex
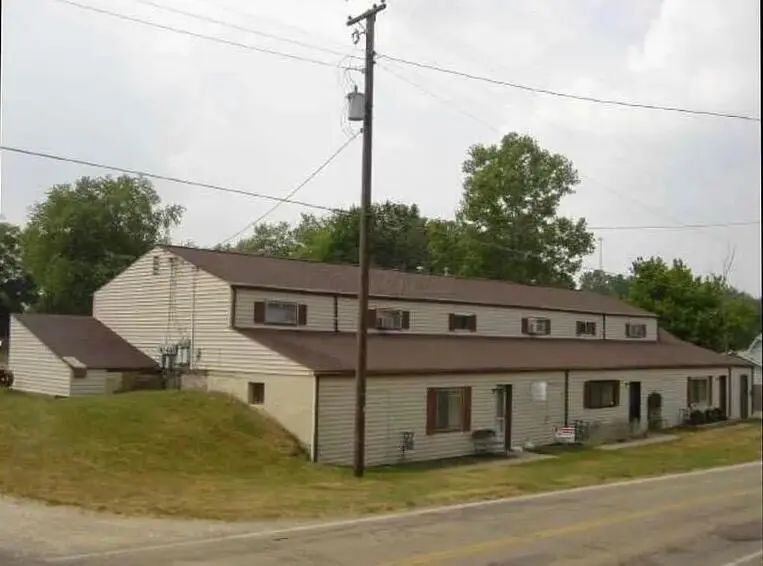
321 N 5th St · Kirkersville, OH
Flood risk 1/10 · Minimal
- FEMA flood zone
- X (unshaded)
- Chance of flooding over 30 yrs
- 0.0%
- Est. flood insurance / yr
- $507 – $1,088
Fire risk 1/10 · Minimal
- Est. fire insurance / yr
- $713 – $1,323
Heat risk 3/10 · Minor
- Hot days now (above 99°F)
- 7 days/yr
- Hot days in 30 yrs
- 18 days/yr
Wind risk 2/10 · Minimal
- Chance of severe wind over 30 yrs
- 1.0%
Air-quality risk 2/10 · Minimal
- Unhealthy air days now
- 1 days/yr
- Unhealthy air days in 30 yrs
- 2 days/yr
Risk factors via First Street. Map © Google.
Why this score? — see what drove the C+ grade
The composite is a weighted blend of 9 inputs, each scored 0–100. Each bar is that input's sub-score; the figure is the points it added to the 100-point composite (weight × sub-score).
- Cash flow +22.6/30.0
- Appreciation +8.6/10.0
- ARV discount +7.5/15.0
- DSCR +7.3/10.0
- Schools +5.4/10.0
- 1% rule +5.3/10.0
- Livability +3.2/5.0
- Rent growth +2.5/5.0
- Condition / age +2.5/5.0
$350,000
🖨 Deal sheet (PDF) 📄 Offer letter ✓ Due diligence
Multi-family units
County records classify this as Multi-Family (2-4 Unit). Listing-text estimate: 3 units. confirmed
Listing remarks
Fully occupied 3-unit multifamily property offering immediate rental income. Landlord currently pays for trash service, sewer, mowing, and minimal electric expenses that operate the well pump and garage lighting, helping keep management simple and predictable. The property features three large residential units, each with its own private back deck and access to a large backyard. The largest unit enjoys a dedicated private driveway, while the two smaller units share a separate parking area located at the opposite end of the building. Largest unit has 6 bedroom and 2 full bathrooms. The other two have 3 bedrooms and one has 2 full baths the other has 1 full bath. Additional income potential c
Key facts
- 1.5-car garage
- Private back deck
- Private driveway
Tags
Property features AI
Finance
- Financial info: Three total units; Net operating income reported at $43,380; Operating expenses reported at $4,620; Owner pays sewer; Annual water/sewer expense reported at $1,656; Annual electric expense reported at $276; Tax amount reported for 2025: $3,138
Exterior
- Parking: Common parking with 8 spaces
- Utilities: Well water; Sewer available; Natural gas available; Electricity available
- Home design: Duplex; Built in 1970
- Exterior features: Lot approximately 0.59 acres
Interior
- Heating & cooling: No central cooling
- Interior features: Forced air heating
Neighborhood map
What this means for you Summary
Snapshot
- This is a 3 × 2-bed/1.5-bath units multifamily listed at $350k.
Deal economics
- At list price, monthly cash flow is $599 ($7k/yr) — positive. Per door: $200/mo.
- The deal already cash-flows at list — no discount required.
- Meets the 1% rule at list price ($4k rent vs $350k).
Location & tenants
- Location reads 63/100 on livability (#814 in OH) — a middle-class / working-renter tenant base. Strengths: cost of living A+, housing A+, employment B+; Watch: amenities F, commute F, health & safety F.
- Southwest Licking Local (rural): math 59% / reading 62% proficiency, ranked #243 of 656 in OH (top 37%) — acceptable for families but not a draw, mixed tenant base, ~2y average lease.
- Zoned schools: Kirkersville Elementary School (475 students, 23% FRL); Watkins Middle School (math 50% / reading 57%, grade C+, #362 of 654 statewide, top 57%, 1,065 students, 32% FRL); Watkins Memorial High School (math 49% / reading 66%, grade C, #272 of 781 statewide, top 35%, 1,373 students, 26% FRL) — zoned schools at 27% FRL track the district average.
- Market conditions: 4 active listings in the ZIP; 159 units permitted in Licking County in 2024 (0 in 5+ unit buildings).
- At $3,597/mo this rent would consume 63% of the median local household income ($68k/yr) — very limited rent-growth headroom before tenants either downsize or default.
Forward outlook
- In year one you build about $28k of equity ($2k loan paydown + $25k appreciation (7.3% local appreciation)).
- At projected returns (7.3% appreciation + 3.0% rent growth), your $98k cash investment doubles in ~3 years — after that, you're playing with house money.
- By year 2, paydown + projected appreciation supports a ~$45k cash-out refi (75% LTV) — recoverable capital for the next deal without selling this one.
Negotiation context
- Only 8 days on market — expect competitive offers; lowballing is unlikely to land.
- 6 sale attempts since 21y ago with the ask held roughly flat each time — persistent listings suggest the price (not the market) is what's stuck; bring a comps-based counter.
- Current owner paid $180k; list at $350k implies a 94% gain — meaningful room to come down on a strong offer.
Questions for the listing agent
- Can we see the unit-by-unit rent roll, current vacancy, and any below-market leases? What's the average tenancy length?
- What capital expenditures (roof, boiler, parking lot, exteriors) have been made in the last 5 years, and what's planned in the next 2?
- Built in 1970 — when were the roof, HVAC, electrical panel, plumbing, and water heater last replaced?
- Is there a deadline driving the sale (1031 exchange, divorce, estate, relocation)? That informs how much negotiation room exists.
- Schools are D-rated, which usually means shorter tenancies and higher turnover. Who's the typical renter profile here, and what's been the actual vacancy rate?
- What's the average days-on-market for RENTAL listings here right now (not sales)? A rising rental-DOM trend means longer vacancies and softer asking-rent achievability than the comps imply.
- What's the recent tenant-quality profile in this submarket — average credit score on applications, eviction rate, late-payment / NSF rate, and stable-employment percentage? A property-management company in the area should have these aggregated.
- How much new apartment / multifamily construction is in the pipeline within 1–3 miles? Heavy new supply (>2% of stock underway) typically softens rents 12–24 months out; light construction supports rent growth.
Investment metrics
- 1% rule
- 1.03% ✓
- Cap rate
- 8.35%
- Cash-on-cash
- 7.33%
- DSCR
- 1.33
- GRM
- 8.1
CMA / ARV
No comps found within radius.
Projected returns pro-forma
7.28% appreciation · 3.0% rent growth · sell at horizon
- IRR
- 24.1%
- Equity multiple
- 2.70×
- Total profit
- $166,296
- Equity at exit
- $248,914
- IRR
- 22.2%
- Equity multiple
- 5.63×
- Total profit
- $454,217
- Equity at exit
- $478,712
Cash invested: $98,000 (down + closing). Projections, not guarantees.
Landlord ↔ Tenant lean methodology
- Overall (STATE)
- 73 Landlord-Friendly
- State Ohio
- 73 Landlord-Friendly · R+6
- County
- — inherits STATE
- City
- — inherits STATE
ZIP-level market 43033
- Home prices YoY
- 2.3%
- Active inventory
- 4
- Price-to-rent
- 24.3×
Monthly cashflow live
- Estimated rent
- $3,597 medium interval (Pro) →
- Mortgage (P&I)
- −$1,835
- Tax from tax record
- −$262 /mo · $3,138/yr
- Insurance
- −$146
- HOA
- −$0
- Vacancy / Maint / Mgmt
- −$755
- Net cashflow
- $599
Break-even live
Sensitivity live
| Price | -10% $797 | -5% $698 | +0% $599 | +5% $500 | +10% $401 |
|---|---|---|---|---|---|
| Rent | -10% $315 | -5% $457 | +0% $599 | +5% $741 | +10% $883 |
| Rate | -1.0pp $775 | -0.5pp $688 | base $599 | +0.5pp $508 | +1.0pp $416 |
3-unit breakdown (identical units grouped — click to expand)
| Units | Beds | Baths | Est. rent |
|---|---|---|---|
| 3× units | 2 | 1.5 | $3,597 |
| #1 | 2 | 1.5 | $1,199 |
| #2 | 2 | 1.5 | $1,199 |
| #3 | 2 | 1.5 | $1,199 |
| Total (3 units) | $3,597 | ||
UW: 25.0% down · 7.5% · 30yr · 1.5% tax · 5.0% vac · 8.0% maint · 8.0% mgmt
Financing live
Cash to close
- Down payment
- $87,500
- Closing costs
- $10,500
- Reserves months
- —
- Total cash needed
- —
Loan-product check · same deal, 3 products live
Conventional
25% down · 7.5% · 30yr
- Down + closing
- —
- Monthly P&I
- —
- Monthly cashflow
- —
- DSCR
- —
- Eligible?
- —
Personal DTI + credit; lowest rate.
DSCR
20% down · 8.5% · 30yr
- Down + closing
- —
- Monthly P&I
- —
- Monthly cashflow
- —
- DSCR
- —
- Eligible?
- —
No personal income docs; deal must DSCR.
Hard money
10% down · 12.0% · 12mo
- Down + closing
- —
- Monthly P&I
- —
- Monthly cashflow
- —
- DSCR
- —
- Eligible?
- —
Short-term bridge; refi at stabilization.
Listing history 7 events
-
2026-06-21days on market $350,000 Active 8 DOM
-
2026-06-18days on market $350,000 Active 5 DOM
-
2026-06-17days on market $350,000 Active 4 DOM
-
2026-06-16days on market $350,000 Active 3 DOM
-
2026-06-15days on market $350,000 Active 2 DOM
-
2026-06-13remarks 699-char remark
-
2026-06-13$350,000 Active 1 DOM
ⓘ Source: listings_history table (triggers on properties + properties_extension) + one-shot
backfill from property_details.listing_events for pre-trigger history.
Tax reassessment forecast OH · Partial reset (capped growth)
- Current annual tax
- $3,138 · $262/mo
- Projected year-2 tax
- $4,299 · $358/mo
- Expected delta
- +$1,161/yr (+$97/mo · 37.0%)
ⓘ Screening estimate from a state-policy table — verify with the county assessor before closing.
Climate risk First Street
- Flood 1/10 Low FEMA zone X (unshaded) · 0% chance over 30 yrs
- Wildfire 1/10 Low
- Heat 3/10 Moderate 7 d/yr ≥99°F today · 18 d/yr by 30 yrs out
- Wind 2/10 Low 100% chance of damaging wind over 30 yrs
- Air quality 2/10 Low 1 unhealthy d/yr today · 2 by 30 yrs out
Nearby sold comps map
Loading sold comps map…
Walkable amenities ~0.75 mi
Loading nearby amenities…
Taxation est. · year 1
- Rental income
- $43,164
- − Mortgage interest
- −$19,605
- − Property taxes
- −$3,138
- − Insurance
- −$1,750
- − Repairs & maintenance
- −$3,453
- − Management
- −$3,453
- − Depreciation
- −$10,182
- Taxable income
- $1,582
- Est. tax owed @ 24.0%
- −$380
- After-tax cash flow
- $6,806/yr
For passive investors: Depreciation is non-cash, so a rental often shows a tax loss while cash-flowing — sheltering income. Rental losses are passive: they offset passive income freely, and up to $25,000/yr can offset ordinary (W-2) income if you actively participate and your MAGI is under $100k (phasing out to $0 by $150k); unused losses carry forward. On sale, claimed depreciation is recaptured at up to 25%, and gains may owe capital-gains tax (a 1031 exchange can defer both). Figures are a year-1 estimate at your 24.0% rate — not tax advice; consult a CPA.
Schools (NCES district)
- District
- Southwest Licking Local
- NCES district ID
- 3904804
- Math proficiency
- 59% ▼ -13.00%
- Reading proficiency
- 62% ▼ -9.00%
- Median HH income
- $72,711
- Composite
- 53.66/100
- National rank
- #1432
- State rank
- #243 of 656 in OH
Livability — Kirkersville
- Score
- 63/100
- State rank
- #814
- US rank
- #15084
Category grades
Schools grade is shown separately in the Schools card above.
Census & demographics
- Census place
- Kirkersville, OH
- County
- Licking · 160,960 people
- City population
- 413
- Metro
- Columbus, OH
- Population (ZIP)
- 413
- Household income
- $68,333
- Rent vs Own
Population outlook (Licking County) Hauer SSP2
- Today (2025)
- 178,210 people
- By 2030
- 180,917 · +1.5%
- By 2040
- 183,885 · +3.2%
- By 2050
- 182,985 · +2.7%
- By 2075
- 178,377 · +0.1%
- By 2100
- 161,075 · -9.6%
Race, ethnicity, and origin ACS 2023
- Neighborhood character
- Predominantly White (89%)
- Race & ethnicity
- White 89% Two or more races 7% Hispanic / Latino 6% Black 1%
- Hispanic origin (detail)
- Mexican 6%
- Common ancestry
- Italian 7% Iranian 4% Serbian 1%
- Foreign-born
- 0%
- Languages at home
- 98% English-only · German/W. Germanic 1% Tagalog/Filipino 1%
Political lean MEDSL · Licking
- 2024 margin
- Solid R (+30.0) · D 34.5% · R 64.6%
- 2008→2024 swing
- -14.2pp toward R · 2008: -15.8pp · 2024: -30.0pp
- All cycles
- 2024: R+30.0 2020: R+28.1 2016: R+28.9 2012: R+14.7 2008: R+15.8
Not yet ingested
- Civics
- —
Market trends
- HPI YoY
- ▲ 7.28%
- Current HPI
- 322.3302
- Rent YoY
- —
- Metro
- —
- State GDP YoY
- ▲ 1.98%
- F500 in state
- 48
Industry mix (Fortune 500 HQ in OH)
| Industry | F500 HQs | Revenue |
|---|---|---|
| Insurance | 3 | $145B |
|
||
| Industrial Machinery | 3 | $49B |
|
||
| Financial Services | 3 | $24B |
|
||
| Consumer Goods | 2 | $93B |
|
||
| Aerospace / Defense | 2 | $47B |
|
||
| Utilities | 2 | $33B |
|
||
Price history
+112.2% since first listed16 events — show timeline
- 2026-06-12 Listed $350,000 CBRMLS
- 2021-03-19 Sold (Public Records) $180,000 Public Records
- 2021-03-17 Listing Removed — CBRMLS
- 2021-01-05 Price Changed $195,555 CBRMLS
- 2020-11-03 Price Changed $200,000 CBRMLS
- 2020-09-28 Listed $220,000 CBRMLS
- 2012-08-01 Listing Removed — CBRMLS
- 2011-07-09 Listed $175,000 CBRMLS
- 2010-04-23 Listing Removed — CBRMLS
- 2009-04-22 Listed $175,000 CBRMLS
- 2008-07-28 Listing Removed — CBRMLS
- 2008-01-22 Listed $189,900 CBRMLS
- 2005-10-06 Sold (Public Records) $148,000 Public Records
- 2005-10-05 Sold (MLS) $148,000 CBRMLS
- 2005-08-01 Listing Removed — CBRMLS
- 2005-06-30 Listed $164,900 CBRMLS
Property tax history
-0.6%/yrLatest (2025): $3,138 · -11.8% YoY. Source: county tax records.
Cash-flow waterfall
monthlySold comps — $/sqft
last 12 mo · ≤1 miLoading sold comps…